


Although health risks associated to excessive body fat increase with small increases in body weight, measurement of body fat is usually grouped in very few categories. The aim of our study was to assess whether the risk for a combined end-point including the incidence of either hypertension and/or type 2 diabetes mellitus and/or the metabolic syndrome was elevated even within the “normal” limits of body-mass index (BMI).
Material and methodsWe followed up 10,639 initially healthy university graduates participating in the SUN dynamic cohort for a variable period ranging 2 to 6 years. Baseline BMI and physical activity were the major exposures. The combined end-point was defined by the incidence of either hypertension and/or type 2 diabetes and/or the metabolic syndrome during the follow-up period.
We fitted non-conditional logistic regression models and nonparametric regression models (restricted cubic splines).
ResultsWe observed 768 incident cases of the combined outcome (incidence of 16/1000 person-years) and found a monotonic linear association between BMI and the combined end-point. The multivariate-adjusted odds ratios for the combined end-point were 1.4 (95% CI: 1.1–1.7) for BMI 22–24.9kg/m2, 2.7 (2.1–3.5) for 25–29.9kg/m2 and 4.0 (2.8–5.6) for ⩾30kg/m2. We observed a threshold effect in the association between physical activity and the combined end-point multivariate-adjusted odds ratio=0.8 (0.7–0.9) for >15METs-h/week.
ConclusionsOur findings suggest that the incidence of metabolic risk factors (hypertension, diabetes mellitus and/or metabolic syndrome) is already increased at a BMI of 22kg/m2 in young adults. These results deserve consideration for judging whether the cut-off point for “normal” weight should be lowered.
Aunque el riesgo asociado a excesiva adiposidad aumente con pequeños incrementos de ésta, la medida de la grasa corporal (índice de masa corporal, IMC) se ha agrupado frecuentemente en pocas categorías. Este estudio pretende valorar si el riesgo de un desenlace combinado incluyendo la incidencia de hipertensión y/o diabetes y/o síndrome metabólico se eleva incluso dentro del rango considerado habitualmente como “normal” para el IMC.
Material y métodos10.639 graduados universitarios inicialmente sanos de la cohorte dinámica SUN fueron seguidos durante un periodo variable de 2 a 6 años. El IMC y el ejercicio al inicio del estudio fueron las exposiciones estudiadas. Se definió un desenlace combinado que incluía la incidencia de hipertensión y/o diabetes mellitus tipo 2 y/o síndrome metabólico durante el seguimiento.
Se ajustaron modelos de regresión logística no condicional y no paramétricos (restricted cubic splines).
ResultadosSe hallaron 768 casos incidentes del desenlace combinado (incidencia de 16/1000 personas-año) y una asociación lineal progresiva entre el IMC y el desenlace combinado. Las odds ratios multivariables para el desenlace combinado fueron 1,4 (IC 95%: 1,1–1,7) para IMC 22–24,9kg/m2, 2,7 (2,1–3,5) para 25–29,9kg/m2 y 4,0 (2,8–5,6) para ⩾30kg/m2. Se observó un efecto umbral en la asociación entre ejercicio y el desenlace combinado odds ratio ajustada=0,8 (0,7–0,9) para > 15METs-h/semana.
ConclusionesLos resultados sugieren que la incidencia de factores de riesgo metabólicos (hipertensión, diabetes y/o síndrome metabólico) aumenta ya a partir de un IMC de 22kg/m2 en adultos jóvenes. Esto debería tenerse en cuenta para juzgar si se debe establecer un límite inferior a 25kg/m2 como criterio de “normalidad” para el IMC.
An increased BMI has a substantial impact not only on mortality but also on an increased incidence of major chronic diseases, thus impairing health care costs and quality of life.1 It has been suggested that obesity may have approximately the same impact on chronic health conditions as 20 years of smoking. Much of this impact is due to chronic disease burden related to hypertension and/or type 2 diabetes mellitus and/or the metabolic syndrome.
Though it has been accepted that the health risks derived from excessive body fat increase with only small increases in body weight, measurement of body fat has been frequently classified in very few categories and the risk within each category has been regarded as homogeneous. Concretely, normal weight is defined as a body mass index (BMI) between 18.5kg/m2 and 25kg/m2.2 In addition, the higher risks associated with an increasing BMI have been observed to be independent of physical activity.3,4 That is why there is interest in studying the association between BMI and its consequences in order to set an adequate cut-off point to define normality or the “ideal” weight.
The aim of this study was to assess whether the risk of hypertension and/or type 2 diabetes mellitus and/or metabolic syndrome5 associated with a high BMI is elevated even within the usually considered “normal” limits of BMI (18.5 to 25kg/m2) and to assess the joint association of physical activity and high BMI with the risk of hypertension and/or type 2 diabetes mellitus and/or metabolic syndrome in an ongoing dynamic Spanish cohort of young adults, all of them university graduates –the SUN [Seguimiento Universidad de Navarra (University of Navarra follow-up study)]-project- followed-up for up to 6 years.
Material and methodsStudy populationThe SUN [Seguimiento Universidad de Navarra (University of Navarra follow-up study)]-cohort is an ongoing, multipurpose, prospective and dynamic cohort of university graduates conducted in Spain. The study protocol was approved by the Institutional Review Board of the University of Navarra.
The study methods have been reported in detail elsewhere.6,7 Briefly, starting in December 1999, all graduates from the University of Navarra were contacted through mailed questionnaires and received an invitation letter to participate in the study. Later on, university graduates from other universities and university graduates from other associations were also contacted. Participants are recruited through collaborations with alumni (former students) from several Spanish universities and professional associations throughout the country. Approximately 20% of invitees agreed to participate. Voluntary completion of the first questionnaire was considered as informed consent. After the baseline assessment, follow-up was conducted through biennial mailed questionnaires. Non-respondents received up to 5 additional mailings requesting their questionnaire.
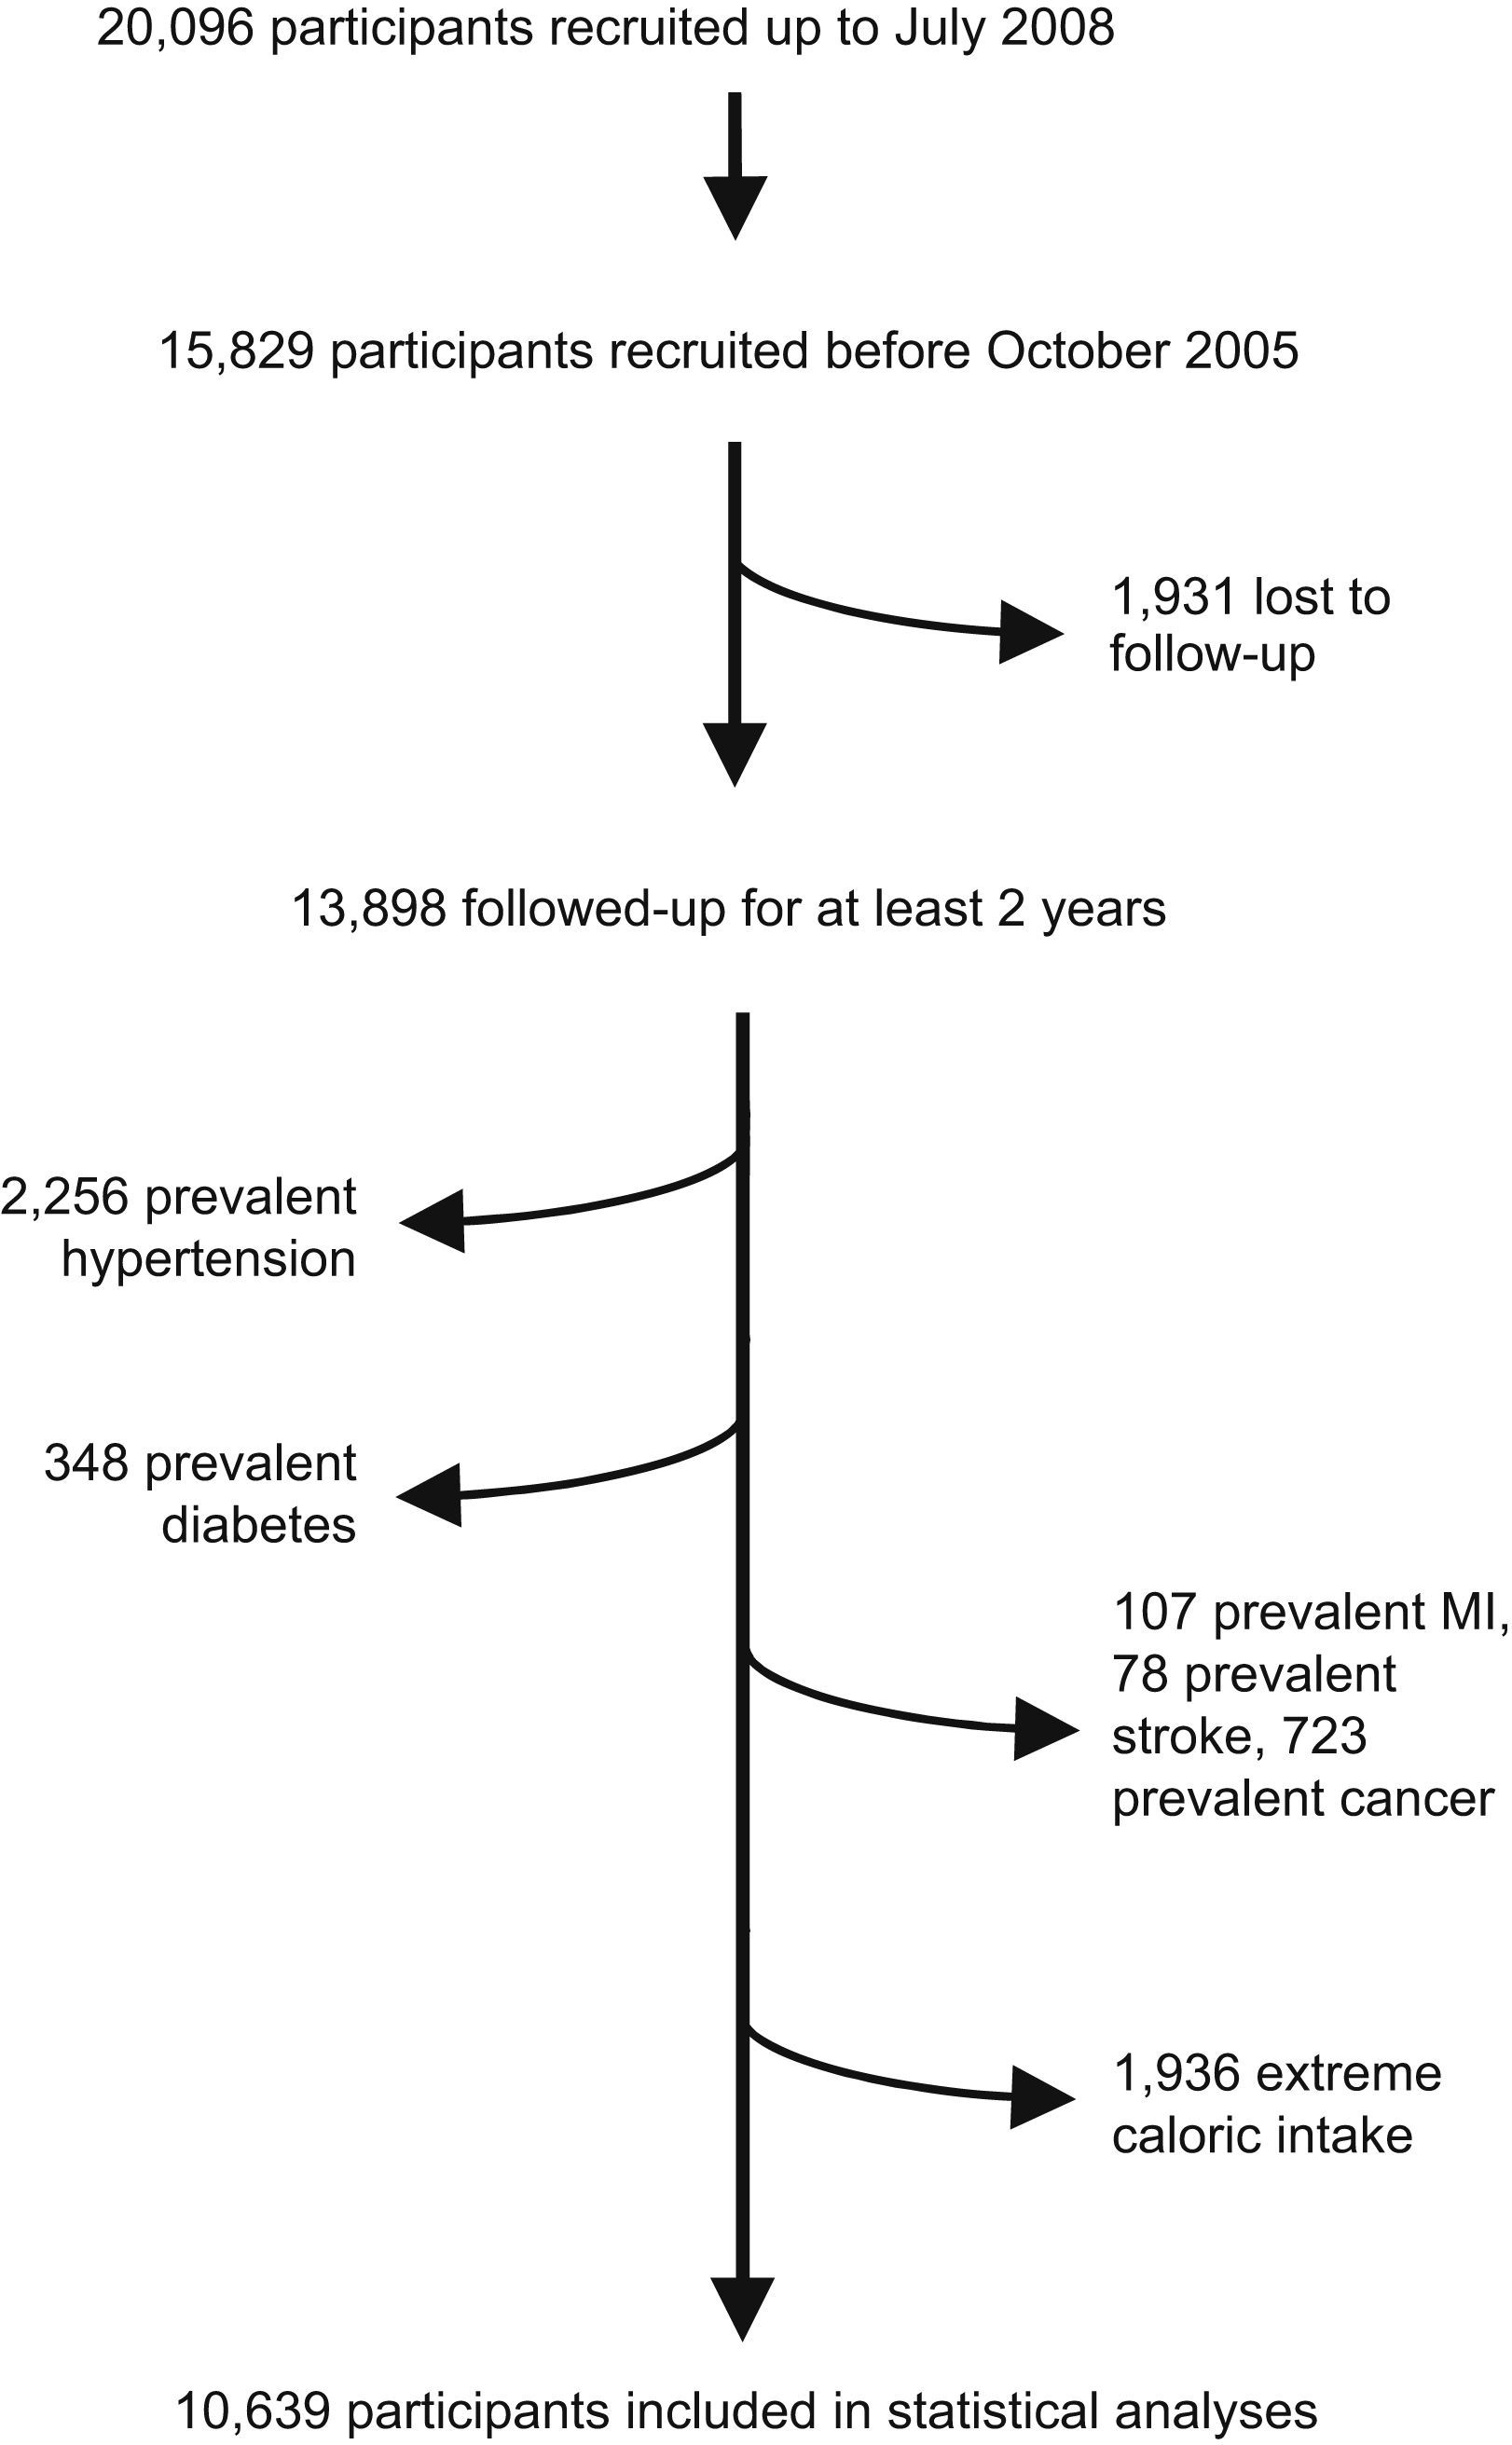
Up to July 2008, 20,096 participants were enrolled in the dynamic SUN project (Fig. 1). To warrant a minimum follow-up of two years, 15,829 participants recruited before October 2005 were candidates to be eligible for this analysis because they had spent enough time in the study as to be able to complete at least the 2-year follow-up questionnaire. Among them, the retention rate was 88%. Therefore, we had follow-up information of 13,898 participants. We excluded 2,256 participants due to baseline prevalent hypertension, 348 who reported baseline diabetes mellitus, 107 with a previous history of acute myocardial infarction, 78 who reported stroke in the baseline questionnaire, 723 with cancer history in the baseline ascertainment and 1,936 participants with total caloric intake outside the pre-specified limits (500kcal/d to 3500kcal/d in women and 800kcal/d to 4000kcal/d in men).8 Thus, the effective sample size for the analyses was 10,639 participants. All participants were followed up between 2 to 6 years.
BMI ascertainment
Baseline BMI was calculated by dividing the self-reported weight in kg by the square of the self-reported height in m2. Self-reported weight and BMI have been previously validated in a subsample of this cohort.9
Measurement of physical activityPhysical activity was ascertained with a previously validated 17-item questionnaire.10 A multiple of the resting metabolic rate (MET score) was assigned to each of these different activities according to published guidelines. This MET score was multiplied by the time spent in each of the different activities and then summed for the overall activities in order to quantify the average intensity of physical activity.
Outcome ascertainmentWe defined a combined end-point considering together the incidence of hypertension and/or diabetes mellitus and/or the metabolic syndrome. Any of them qualified a participant as meeting the end-point. Hypertension was defined by the report of a new medical diagnosis of hypertension during the follow-up period. Self-reported hypertension has been previously validated in this cohort.11 Cases of self-reported incident type-2 diabetes mellitus were confirmed through medical reports and an additional detailed questionnaire posted to those who self-reported a new diagnosis of diabetes by a medical doctor during the follow-up period.7 Finally, metabolic syndrome was defined according to the International Diabetes Federation (IDF) criteria, i.e. by the presence of central obesity (waist circumference ⩾94cm for men and ⩾80cm for women) plus any two of the following conditions: raised triglycerides (>150mg/dL or specific treatment for this lipid abnormality), reduced HDL-cholesterol (<40mg/dL for men and<50mg/dL for women or specific treatment for this lipid abnormality), raised blood pressure (systolic ⩾130mmHg or diastolic ⩾85mmHg or treatment for hypertension) or raised fasting plasma glucose (fasting plasma glucose ⩾100mg/dL or diagnosed type 2 diabetes).5
Assessment of other covariatesAge, sex and family history of diabetes or hypertension were addressed in the baseline questionnaire.
Dietary habits of the participants were ascertained by a 136-item food-frequency questionnaire previously validated in Spain.12 The questionnaire was based on typical portion sizes that were multiplied by the frequency of consumption of each food item. Nutrient composition of the diet was derived with the use of Spanish food composition tables.
Adherence to the Mediterranean Food Pattern was assessed by the score proposed by Trichopoulou et al.13 The definition of the Mediterranean Food Pattern was operationalized by developing an a priori 10-point score. A value of 0 or 1 was assigned to each of nine indicated components with the use of the sex-specific median as the cut-off point. For beneficial components (vegetables, legumes, fruits and nuts, cereal, and fish), participants whose consumption was below the median were assigned a value of 0, and a value of 1 otherwise. For components presumed to be detrimental (meat and dairy products), participants whose consumption was below the median were assigned a value of 1, and a value of 0 otherwise. A value of 1 was given to men consuming from 10g to less than 50g of alcohol per day and to women consuming from 5g to 25g. For lipid intake, the ratio of monounsaturates to saturates (MUFA/SFA ratio) was calculated. Participants were categorized into a low (0–2), intermediate (3–6) or high adherence (7–9) to the Mediterranean Food Pattern.
Statistical analysisAll food and nutrient intakes were adjusted with the residual method, separately for men and women to control for confounding and reduce extraneous variation.8
Missing values for weight (20 participants) and height (141 participants) were imputed by age and sex using a regression approach. All missing values for physical activity (699 participants) were due to a lack of information about the seasonality of practice of activities; and they were imputed applying an algorithm based on the sex- and activity-specific medians of months per year participating in that activity.
We fitted crude non-conditional logistic regression models across increasing categories of BMI and across increasing categories of physical activity, using BMI<22kg/m2 according to Willett et al14 and total leisure-time physical activity<15MET-h/wk –approximately the first tertile- as the reference category, respectively. Multivariable non-conditional logistic regression models were fitted adjusting for age, sex, physical activity (when assessing the relationship between BMI and the outcome), BMI (when assessing the relationship between physical activity and the outcome), low fat dairy products consumption, sodium intake, the Mediterranean Food Pattern score (3 categories) and olive oil consumption. Foods and nutrients (low-fat dairy products, sodium, olive oil) were introduced categorized into quintiles in order to avoid making specific assumptions about the shape of their relationship with the outcome and minimize the influence of outliers.8 We also evaluated the potential bias introduced by the discrepancy between BMI and physical activity. Herefore, as a sensitivity analysis, we excluded those participants with both a high BMI and a high physical activity level or with both a low BMI and low physical activity, defining high and low as the upper or the lower 15% of the distribution, respectively. For the linear trend tests, we treated the exposure as linear.
Statistical interaction was assessed by likelihood ratio tests, comparing full models, including interaction terms, with reduced models without interaction terms. We calculated statistical power for a potential interaction between sedentarism and overweight for different assumptions.15 Assuming an overweight prevalence of 39%, a prevalence of sedentary lifestyle of 30%, a two-sided alpha error of 0.05, different combinations of prevalence OR between obesity and a sedentary lifestyle within 1.2–1.6, ORs for overweight within 1.5–2.5 and different ORs for sedentary lifestyle within 1–2, the statisical power for detecting interactions between overweight and sedentarism with ORs within 1.3–1.7 ranged from 0.82 to > 0.99.
We also evaluated the nonparametric association between BMI and the outcome fitting nonparametric regression curves (regression cubic splines) which we adjusted for age, sex and physical activity.16
All p-values are two-tailed and statistical significance was set at p<0.05. Analysis were performed with SPSS version 15.0 (SPSS Inc, Chicago, IL) and SAS software version 9.1.3 (SAS Institute Inc, Cary NC).
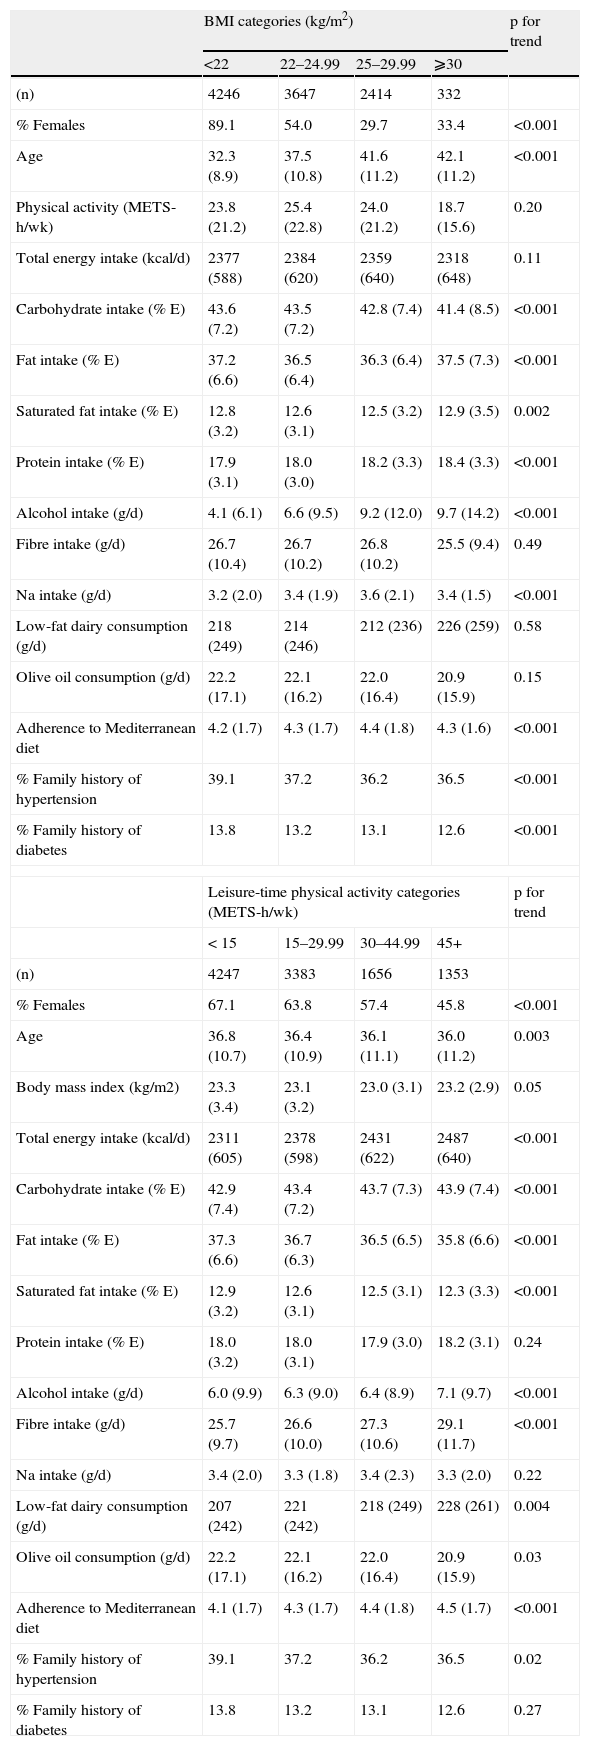
ResultsThe baseline characteristics of the cohort are shown in Table 1. Participants with a higher BMI were more likely to be men, older and less physically active, and to have a higher alcohol consumption and a lower total caloric intake. More physically active participants were prone to have a higher total caloric and fiber intake and a higher consumption of low-fat dairy products but a lower consumption of olive oil.
Distribution of potential confounders according to Body mass index (BMI) and physical activity distribution*. The SUN study
| BMI categories (kg/m2) | p for trend | ||||
| <22 | 22–24.99 | 25–29.99 | ⩾30 | ||
| (n) | 4246 | 3647 | 2414 | 332 | |
| % Females | 89.1 | 54.0 | 29.7 | 33.4 | <0.001 |
| Age | 32.3 (8.9) | 37.5 (10.8) | 41.6 (11.2) | 42.1 (11.2) | <0.001 |
| Physical activity (METS-h/wk) | 23.8 (21.2) | 25.4 (22.8) | 24.0 (21.2) | 18.7 (15.6) | 0.20 |
| Total energy intake (kcal/d) | 2377 (588) | 2384 (620) | 2359 (640) | 2318 (648) | 0.11 |
| Carbohydrate intake (% E) | 43.6 (7.2) | 43.5 (7.2) | 42.8 (7.4) | 41.4 (8.5) | <0.001 |
| Fat intake (% E) | 37.2 (6.6) | 36.5 (6.4) | 36.3 (6.4) | 37.5 (7.3) | <0.001 |
| Saturated fat intake (% E) | 12.8 (3.2) | 12.6 (3.1) | 12.5 (3.2) | 12.9 (3.5) | 0.002 |
| Protein intake (% E) | 17.9 (3.1) | 18.0 (3.0) | 18.2 (3.3) | 18.4 (3.3) | <0.001 |
| Alcohol intake (g/d) | 4.1 (6.1) | 6.6 (9.5) | 9.2 (12.0) | 9.7 (14.2) | <0.001 |
| Fibre intake (g/d) | 26.7 (10.4) | 26.7 (10.2) | 26.8 (10.2) | 25.5 (9.4) | 0.49 |
| Na intake (g/d) | 3.2 (2.0) | 3.4 (1.9) | 3.6 (2.1) | 3.4 (1.5) | <0.001 |
| Low-fat dairy consumption (g/d) | 218 (249) | 214 (246) | 212 (236) | 226 (259) | 0.58 |
| Olive oil consumption (g/d) | 22.2 (17.1) | 22.1 (16.2) | 22.0 (16.4) | 20.9 (15.9) | 0.15 |
| Adherence to Mediterranean diet | 4.2 (1.7) | 4.3 (1.7) | 4.4 (1.8) | 4.3 (1.6) | <0.001 |
| % Family history of hypertension | 39.1 | 37.2 | 36.2 | 36.5 | <0.001 |
| % Family history of diabetes | 13.8 | 13.2 | 13.1 | 12.6 | <0.001 |
| Leisure-time physical activity categories (METS-h/wk) | p for trend | ||||
| < 15 | 15–29.99 | 30–44.99 | 45+ | ||
| (n) | 4247 | 3383 | 1656 | 1353 | |
| % Females | 67.1 | 63.8 | 57.4 | 45.8 | <0.001 |
| Age | 36.8 (10.7) | 36.4 (10.9) | 36.1 (11.1) | 36.0 (11.2) | 0.003 |
| Body mass index (kg/m2) | 23.3 (3.4) | 23.1 (3.2) | 23.0 (3.1) | 23.2 (2.9) | 0.05 |
| Total energy intake (kcal/d) | 2311 (605) | 2378 (598) | 2431 (622) | 2487 (640) | <0.001 |
| Carbohydrate intake (% E) | 42.9 (7.4) | 43.4 (7.2) | 43.7 (7.3) | 43.9 (7.4) | <0.001 |
| Fat intake (% E) | 37.3 (6.6) | 36.7 (6.3) | 36.5 (6.5) | 35.8 (6.6) | <0.001 |
| Saturated fat intake (% E) | 12.9 (3.2) | 12.6 (3.1) | 12.5 (3.1) | 12.3 (3.3) | <0.001 |
| Protein intake (% E) | 18.0 (3.2) | 18.0 (3.1) | 17.9 (3.0) | 18.2 (3.1) | 0.24 |
| Alcohol intake (g/d) | 6.0 (9.9) | 6.3 (9.0) | 6.4 (8.9) | 7.1 (9.7) | <0.001 |
| Fibre intake (g/d) | 25.7 (9.7) | 26.6 (10.0) | 27.3 (10.6) | 29.1 (11.7) | <0.001 |
| Na intake (g/d) | 3.4 (2.0) | 3.3 (1.8) | 3.4 (2.3) | 3.3 (2.0) | 0.22 |
| Low-fat dairy consumption (g/d) | 207 (242) | 221 (242) | 218 (249) | 228 (261) | 0.004 |
| Olive oil consumption (g/d) | 22.2 (17.1) | 22.1 (16.2) | 22.0 (16.4) | 20.9 (15.9) | 0.03 |
| Adherence to Mediterranean diet | 4.1 (1.7) | 4.3 (1.7) | 4.4 (1.8) | 4.5 (1.7) | <0.001 |
| % Family history of hypertension | 39.1 | 37.2 | 36.2 | 36.5 | 0.02 |
| % Family history of diabetes | 13.8 | 13.2 | 13.1 | 12.6 | 0.27 |
During a median follow-up period of 4.8 years, we observed 768 new cases of the comibined end-point; among them were included 583 participants who developed hypertension, 120 participants who developed the metabolic syndrome, 12 participants who developed type 2 diabetes, 48 participants who developed hypertension and the metabolic syndrome, 4 participants who developed hypertension and type 2 diabetes and 1 participant who developed the metabolic syndrome and type 2 diabetes. Thus, we observed 16/1000 person-years new cases of the combined outcome.
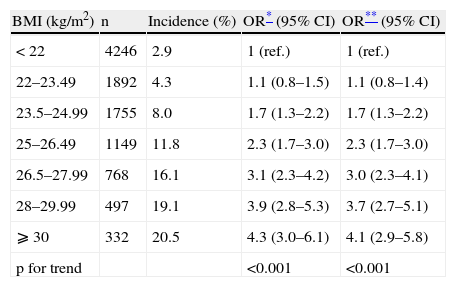
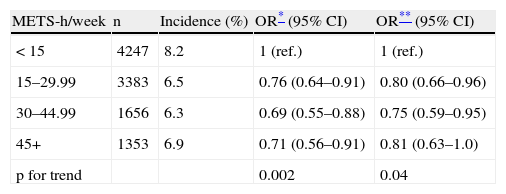
Tables 2 and 3 present the OR for developing the combined end-point (hypertension and/or type 2 diabetes mellitus and/or the metabolic syndrome) across increasing categories of BMI and physical activity, respectively. The OR for the combined end-point monotonically increased across increasing categories of BMI, independently of age, sex and physical activity. The ORs for categories of BMI<22 (ref.), 22–23.49, 23.5–24.99, 25–26.49, 26.5–27.99, 28–29.99, and >30kg/m2 are shown in Table 3. When we merged some of these categories according to the commonly used classification (data not shown) the multivariate-adjusted ORs for the risk of the combined end-point were 1.4 (95% CI: 1.1–1.7) for BMI 22–24.9kg/m2, 2.7 (2.1–3.5) for 25–29.9kg/m2 and 4.0 (2.8–5.6) for ⩾30kg/m2. Participants with a BMI of 22–24.9kg/m2 –usually considered as “normal” in the current classification- had therefore a statistically significant increased risk of developing the outcome. Additional adjustment for low-fat dairy products consumption, sodium intake, adherence to Mediterranean Food Pattern and olive oil consumption did not change neither the point estimates nor the confidence intervals (data not shown). Exclusion of those participants with discrepancy between BMI and physical activity did not change the results substantially (data not shown). We found no statistically significant interaction for BMI and physical activity, sex or smoking habit. Considering physical activity, participants with a leisure-time physical activity level greater or equal to 15MET-h/wk showed a reduced risk for developing the combined end-point than more sedentary participants. However, we found results suggesting a threshold effect and leisure-time physical activity levels above 30MET-h/wk did not further reduce the risk for the combined end-point. Thus the OR (95% CI) for physical activity ⩾15METs-h/week was 0.8 (0.7–0.9).
Odds ratios (95% CI) for developing diabetes and/or hypertension and/or the metabolic syndrome during follow-up according to baseline body mass index. The SUN project
| BMI (kg/m2) | n | Incidence (%) | OR* (95% CI) | OR** (95% CI) |
| < 22 | 4246 | 2.9 | 1 (ref.) | 1 (ref.) |
| 22–23.49 | 1892 | 4.3 | 1.1 (0.8–1.5) | 1.1 (0.8–1.4) |
| 23.5–24.99 | 1755 | 8.0 | 1.7 (1.3–2.2) | 1.7 (1.3–2.2) |
| 25–26.49 | 1149 | 11.8 | 2.3 (1.7–3.0) | 2.3 (1.7–3.0) |
| 26.5–27.99 | 768 | 16.1 | 3.1 (2.3–4.2) | 3.0 (2.3–4.1) |
| 28–29.99 | 497 | 19.1 | 3.9 (2.8–5.3) | 3.7 (2.7–5.1) |
| ⩾ 30 | 332 | 20.5 | 4.3 (3.0–6.1) | 4.1 (2.9–5.8) |
| p for trend | <0.001 | <0.001 |
Ref.: reference.
Odds ratios (95% CI) for developing diabetes and/or hypertension and/or the metabolic syndrome during follow-up according to baseline leisure-time physical activity. The SUN project
| METS-h/week | n | Incidence (%) | OR* (95% CI) | OR** (95% CI) |
| < 15 | 4247 | 8.2 | 1 (ref.) | 1 (ref.) |
| 15–29.99 | 3383 | 6.5 | 0.76 (0.64–0.91) | 0.80 (0.66–0.96) |
| 30–44.99 | 1656 | 6.3 | 0.69 (0.55–0.88) | 0.75 (0.59–0.95) |
| 45+ | 1353 | 6.9 | 0.71 (0.56–0.91) | 0.81 (0.63–1.0) |
| p for trend | 0.002 | 0.04 |
Ref.: reference.
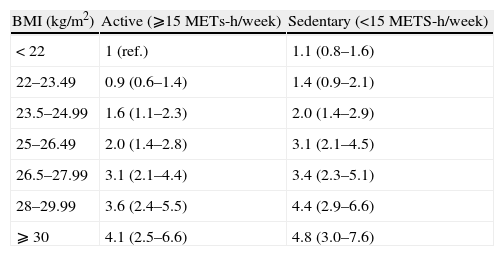
Table 4 shows the association between the joint classification of BMI and physical activity and the incidence of the combined end-point. We found no differential effect between participants with a higher or a lower physical activity during leisure time.
Age- and sex-adjusted odds ratios (95% CI) for developing diabetes and/or hypertension and/or the metabolic syndrome during follow-up according to baseline body mass index and physical activity. The SUN project
| BMI (kg/m2) | Active (⩾15METs-h/week) | Sedentary (<15METS-h/week) |
| < 22 | 1 (ref.) | 1.1 (0.8–1.6) |
| 22–23.49 | 0.9 (0.6–1.4) | 1.4 (0.9–2.1) |
| 23.5–24.99 | 1.6 (1.1–2.3) | 2.0 (1.4–2.9) |
| 25–26.49 | 2.0 (1.4–2.8) | 3.1 (2.1–4.5) |
| 26.5–27.99 | 3.1 (2.1–4.4) | 3.4 (2.3–5.1) |
| 28–29.99 | 3.6 (2.4–5.5) | 4.4 (2.9–6.6) |
| ⩾ 30 | 4.1 (2.5–6.6) | 4.8 (3.0–7.6) |
Ref.: reference.
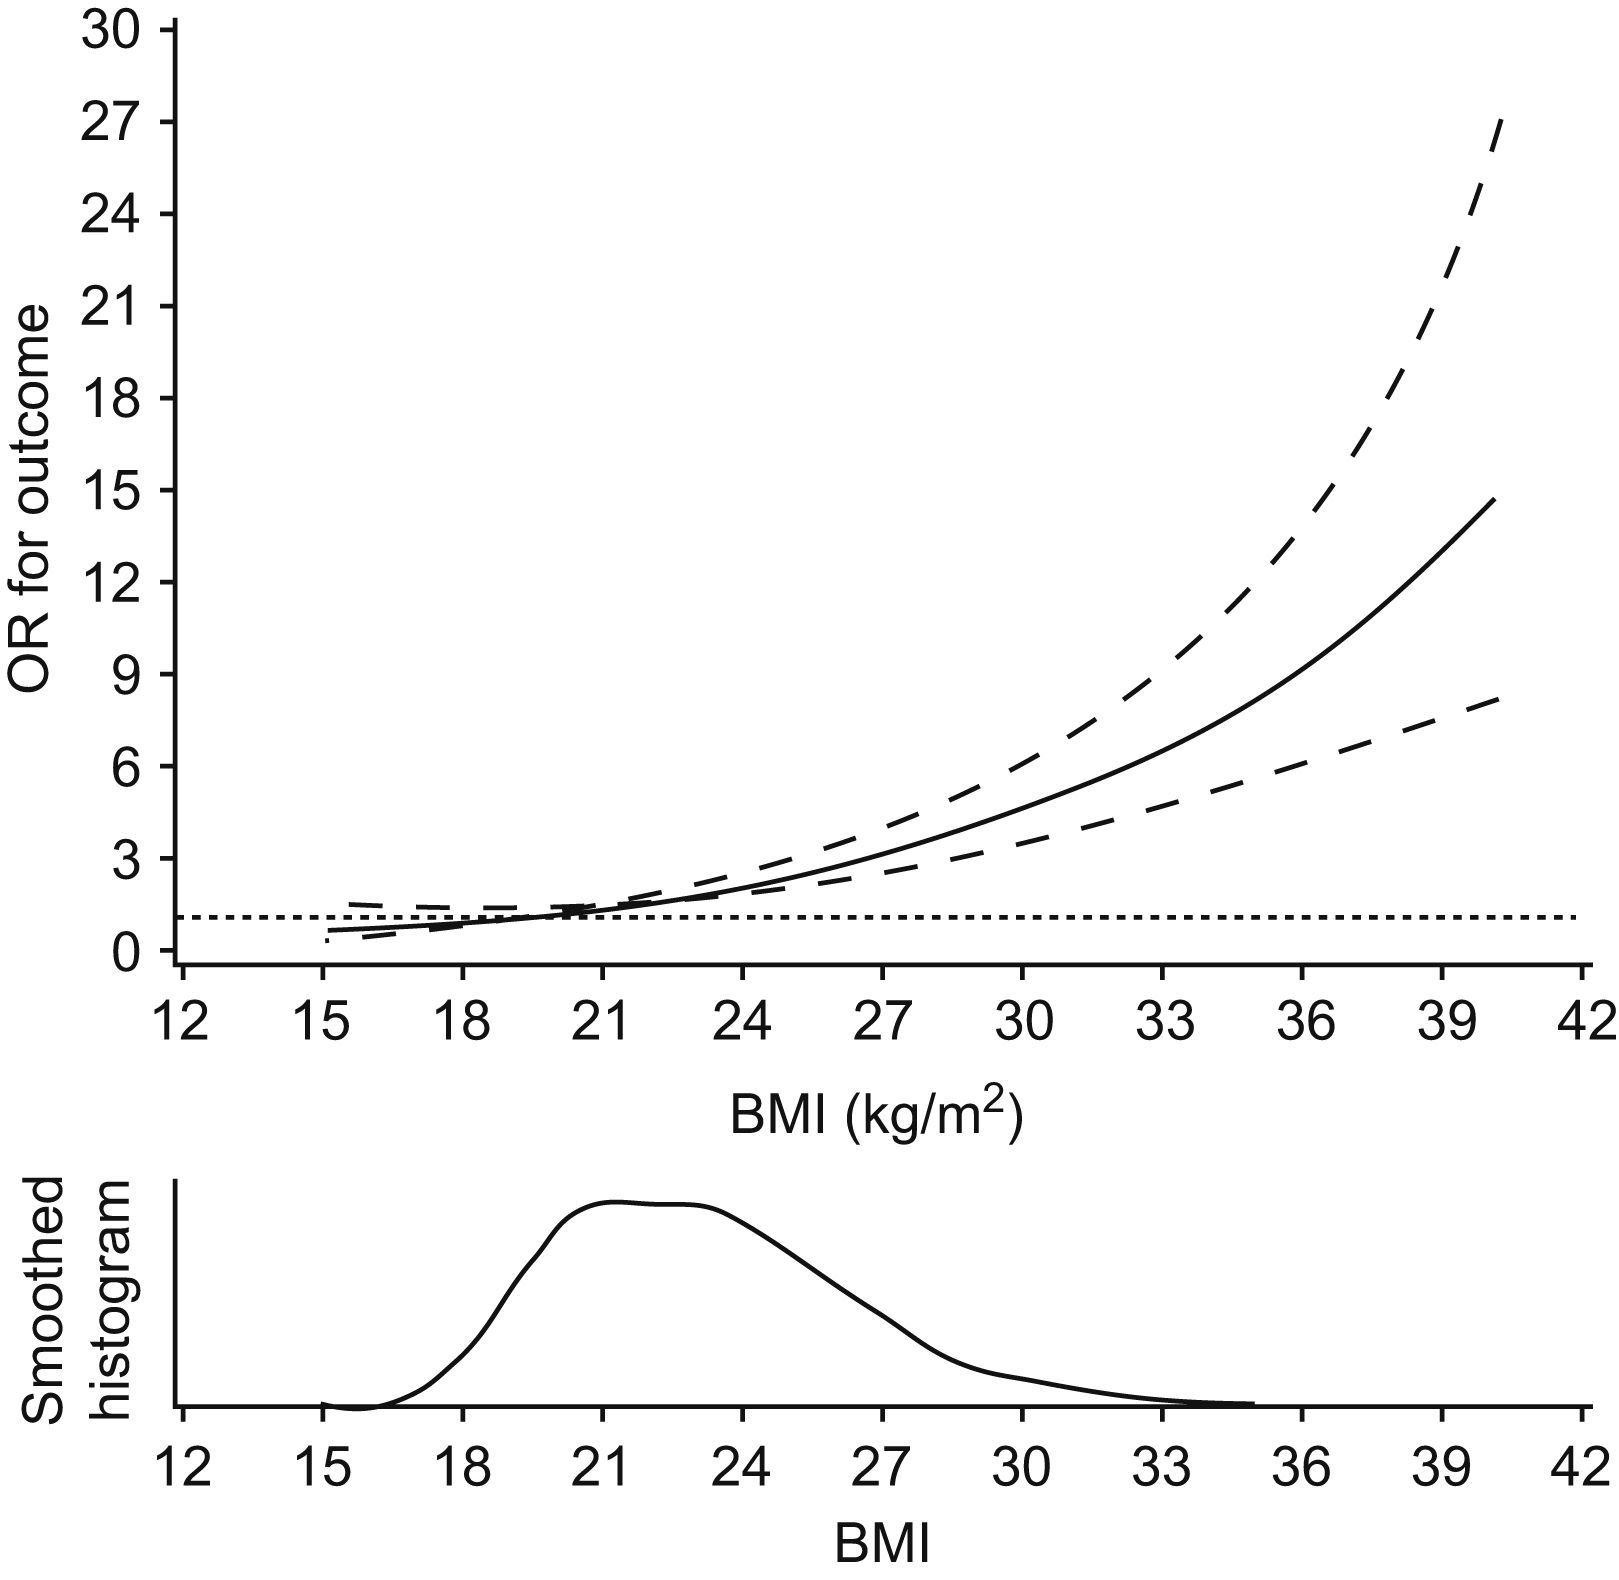
The spline curve for the association between BMI and the outcome is displayed in Fig. 2. The test for curvature was not statistically significant. The significantly elevated risk for the combined outcome started well below 24kg/m2.
Discussion for hypertension and/or type 2 diabetes and/or the metabolic syndrome according to body-mass index (adjusted for age, sex and physical activity). The SUN cohort 1999–2008.")
In the present study we found a monotonic linear association between BMI and the incidence of either hypertension and/or type 2 diabetes and/or the metabolic syndrome starting at levels considerably below the usually accepted lower limits of normality, whereas physical activity showed a threshold effect for the same outcome. Both the effects of BMI and physical activity were independent of each other.
We acknowledge that our study has some limitations. First, since all participants in our study were university graduates, this sample is not representative of the general population. However, there is no biological argument to think that our results might not be generalizable to other population groups. Moreover, because the prevalence of obesity in our study sample (3.1%) is much lower than in the general population (20%),17 the magnitude of the impact of elevated BMI in the general population is expected to be much higher that in our study sample. Second, our cohort is relatively young. The effect of body weight has been shown to be stronger among younger people.18,19 Thus, our results may overestimate the impact of obesity on cardiovascular outcomes. Third, the follow-up time of our participants was not homogoneous. However, this is the usual scenario when a design of dynamic cohort is selected. Fourth, we relied on self-reported information for some of the outcomes and the exposures in our cohort. Nevertheless, self-reported information regarding BMI and hypertension has been validated in this cohort previously.8,10 Fifth, as in all observational studies, residual confounding might be a potential explanation of our findings. We do not consider this hypothesis to be very likely since additional adjustment for other potential confounders hardly changed the point estimates or the confidence intervals of the observed ORs. Thus, we do not think that not accounting for unmeasured variables might be a likely explanation for our results.
The current cut-off point for the classification of the population according to their BMI into normal weight (18.5–24.9kg/m2), overweight (25–29.9kg/m2) and obese (⩾30kg/m2) was established considering the cut-off points for the effect of BMI on total mortality.2 However, the shape of the relationship between these two variables is unclear and it has been described as either J-, U- or linearly-shaped. Nevertheless, epidemiologic studies dealing with this issue are fraught with methodological biases, such as reverse causation bias –weight loss might be attributable to subclinical disease-, confounding especially by smoking, and undue removement of the physiologic effects of excess fatness such as hypertension and hyperglycaemia (because they are mistakenly controlled for in multivariate analyses)- thus overestimating the risks associated to low BMI and underestimating the risks associated to high BMI.14 In fact, some studies that have tried to remove these biases have found a linear association between BMI and mortality, even in the officially considered “non-obese” range, at least at younger ages20–22 although this result was not replicated in some study.23 Evidence suggests that there might be an increased risk for mortality derived from a higher BMI starting between 22–24kg/m2, i.e., even within the officially considered “non-overweight” range (< 25kg/m2).
Consistently with our results, some studies have also found an increased risk of hypertension, hypercholesterolemia or diabetes in men within levels of BMI under 25kg/m2.24 Likewise, a monotonic increase for the risk of hypertension according to BMI was observed in women starting below 25kg/m2.18 In this latter study, an increased risk for hypertension was found for women with a BMI of only 20–21.9kg/m2 in comparison with women with a BMI of<20kg/m2 and a change of only 1kg/m2 in BMI was associated with a 12% increase in risk for hypertension. Accordingly, there is some evidence that women with a BMI 22–22.9kg/m2 have a higher RR for type 2 diabetes mellitus.25 BMI in the range 23–24.9kg/m2 has been associated with a substantially higher risk of diabetes mellitus26 and the association between what is conventionally considered as a normal BMI and the risk for diabetes persisted even after adjustment for waist-to-hip ratio although this association disappeared after adjusting for waist circumference.27,28 Furthermore, Hu et al. found that the most important risk factor for type 2 diabetes was an elevated BMI and even a BMI of 23–24.9kg/m2 was associated with a substantially higher risk.26 In this context, the interest of our findings is that for the first time, we present similar prospective results in a Spanish population. In this highly educated and considerably slim sample, a third of the participants had BMI levels between 22–25kg/m2. According to the currently established guidelines, they will consider themselves as being within the range of a healthy weight. However, our results show that they had a significantly increased risk of developing hypertension and/or diabetes and/or the metabolic syndrome compared to those with BMI under 22kg/m2. Our study provides scientific evidence to support a linear and progressive association between BMI and the combined outcome of metabolic conditions, therefore no specific threshold is apparent. However, beyond scientific interest, we aknowledge that, from the point of view of clinical practice, a specific cut-off point is needed to make decisions. Consequently, our results support the lowering of the currently accepted upper cut-off point for “normal” weight. Furthermore, the results from some previous studies are consistent with our results,18,24 and together they suggest that the impact of changing the current guidelines will be substantial from the point of view of the population strategy of preventive medicine.29
BMI and physical activity were independent predictors of hypertension and/or type 2 diabetes mellitus and/or metabolic syndrome. Thus, our results indirectly support the findings of other studies in which obesity and physical activity were independent predictors of coronary heart disease and total mortality.3,4
Our findings suggest that no threshold at 25kg/m2 exists for BMI on metabolic outcomes or hypertension. In fact, people with a BMI between 22 and 24.9kg/m2 were at higher risk of developing hypertension and/or type 2 diabetes and/or metabolic syndrome than subjects with a BMI<22kg/m2. Contrarily, a threshold effect for physical activity at a level above 15METs-h/week was observed. Therefore, our results deserve consideration to judging whether the upper cut-off point for “normal” weight should be lower than 25kg/m2 at least for young adults.
We are indebted to the participants of the SUN study for their continued cooperation and participation. We also thank other members of the SUN study group including: C de la Fuente, Z Vázquez, S Benito, J A Martínez, J de Irala, M Segui-Gómez, A Martí, F Guillen-Grima, M Serrano-Martínez, University of Navarra; M Delgado-Rodríguez, University of Jaen; J Llorca, University of Cantabria; A Sánchez-Villegas, University of Las Palmas. We thank the members of the Department of Nutrition of the Harvard School of Public Health (A Ascherio, F B Hu, W C Willett) who helped us to design the SUN study.
This project has been funded by the Spanish Government (Instituto de Salud Carlos III, Fondo de Investigaciones Sanitarias projects PI030678, PI040233, PI042241, PI050514, PI050976, PI070240, RD 06/0045) and the Navarra Regional Government (Department of Health, PI41/2005).
