


More than 100 million people worldwide have been infected by SARS-CoV-2 virus, the virus responsible for the acute disease COVID-19. Multiple studies have shown how various symptoms in these patients can persist for several months after resolution of the acute process, a phenomenon known as post-COVID syndrome. Neurological symptoms are varied, but the great majority of patients present fatigue.
ObjectiveTo analyse post-COVID fatigue.
MethodsWe present a prospective, single-centre, case-control study comparing patients with fatigue in the context of post-COVID syndrome with patients with history of COVID-19 but without post-COVID fatigue. Data were recorded at baseline (April 2021) and at 6 months. Data were recorded on clinical variables, fatigue questionnaires, sleep disorders, depression, anxiety, cognitive impairment, and quality of life. Basic laboratory analysis was performed with blood samples collected at the 2 visits. In addition, a substudy of proinflammatory (IL-6, IL-1β, TNF-α) and anti-inflammatory (IL-10) cytokines was performed.
ResultsFatigue as measured by the Chalder Fatigue Scale was mixed (physical and psychological) and of moderate intensity. At 6 months, physical fatigue improved, but psychological fatigue did not. Significant differences were found in sleepiness, cognitive impairment, anxiety, and quality of life. Significant alterations were observed in TNF-α levels, but not in the remaining cytokines.
ConclusionsPatients with fatigue presented a poorer quality of life, with an improvement being observed at 6 months, which suggests a course that may be self-limiting; however, this will have to be confirmed with longer studies.
Más de 100 millones de personas han sido infectadas en el mundo por el virus SARS-CoV-2 responsable de una enfermedad aguda denominada COVID-19. Múltiples estudios han mostrado cómo diversos síntomas en estos enfermos pueden persistir durante varios meses tras la resolución del proceso agudo, denominándose síndrome post-COVID. La clínica neurológica es variada, pero con presentación constante de fatiga.
ObjetivoAnalizar la fatiga post-COVID.
MétodosPresentamos un estudio unicéntrico, prospectivo, de casos y controles comparando pacientes con fatiga en contexto de un síndrome post-COVID con pacientes que hayan pasado el COVID-19 sin fatiga post-COVID. Se realizó un registro basal (abril 2021) y a los 6 meses. Se registran variables clínicas, cuestionarios de fatiga, problemas de sueño, depresión, ansiedad, afectación cognitiva y calidad de vida. Se recogen analíticas básicas de las 2 visitas. Además, se realiza un subestudio de citoquinas inflamatorias (IL-6, IL-1β, TNF-α) y antiinflamatorias (IL-10).
ResultadosLa fatiga de los pacientes medida por Chadler es de intensidad moderada y mixta (física y psicológica). A los 6 meses, mejora la fatiga física, pero no la psicológica. Se encuentran diferencias significativas en mejoría de la somnolencia, ansiedad, deterioro cognitivo y calidad de vida. Se evidencia alteraciones significativas en cuanto a los valores de TNF-α, no en el resto de citoquinas.
ConclusionesLos pacientes con fatiga tienen peor calidad de vida observándose una mejoría en el control a los 6 meses, lo que sugiere un curso que podría autolimitarse, pero habrá que confírmalo con estudios más prolongados.
COVID-19 is caused by the coronavirus SARS-CoV-2. The virus was first described in China in 2019. Since then, it caused one of the greatest global pandemics in history.1
The most characteristic clinical picture in COVID-19 is severe pneumonia, although the disease presents a very broad clinical spectrum, ranging from asymptomatic patients to more severe cases with respiratory distress and multiple organ failure. The initial symptoms are related to the viral infection, and complications may be caused by a so-called cytokine storm triggered by the patient’s immune response.2 Regardless of the initial clinical presentation, some patients continue presenting different symptoms weeks after PCR results for the virus turn negative; this is known as post-COVID syndrome.3 It is defined as a new condition occurring in individuals whose COVID-19 symptoms persist despite the passage of time,4 and specifically after a period of at least 3 months.5 These symptoms very frequently include neurological manifestations, such as fatigue, headache, attentional symptoms, and memory complaints. It is also important to bear in mind that symptoms appear independently of the initial clinical presentation and severity of the patient’s status.6 This entity appears to affect a high percentage of patients with COVID-19. The reported rates range from 10% to 80%, according to international studies.7
Chronic immune dysregulation after infectious processes, known as persistent inflammation, immunosuppression, and catabolism syndrome, has previously been described with other viruses.8 SARS-CoV-2 provokes a disproportionate immune response that leads to the release of a cytokine storm. Damaged organs continue releasing inflammatory molecules, perpetuating the situation of chronic systemic inflammation.9–11 It has been suggested that this may constitute one of the pathophysiological mechanisms underlying post-COVID syndrome.12
Sufficient evidence is now available that suggests that the virus, both directly and indirectly, can cause brainstem dysfunction that may explain many of the neurological manifestations of post-COVID syndrome.13,14 These include fatigue, myalgia, insomnia, headache, depression, anxiety, gustatory/olfactory alterations, and cognitive dysfunction.15 Fatigue is probably the most common symptom in post-COVID syndrome,16 as reported by other authors including Islam et al.17 and Ceban et al.,16 who report this symptom in 32% of patients. Fatigue has also been described in association with other viruses and coronaviruses.18 Patients may use the term to describe sensations including weakness, dyspnoea, difficulty concentrating, low mood, and somnolence.19 Therefore, as proposed by Sandler et al.,19 it is important to objectively measure fatigue using questionnaires, such as the Chalder Fatigue Scale, and to address such aspects as sleep and mood in the assessment. Rudroff et al.20 define post-COVID fatigue as “the decrease in physical and/or mental performance that results from changes in central, psychological, and/or peripheral factors due to the COVID-19 disease.” The authors suggest that the virus may invade the central nervous system (CNS), causing fatigue, as occurs in such other neurological diseases as multiple sclerosis.20 They also describe psychological factors, such as those related with an atmosphere of fear, isolation, social restrictions, or deaths of family members, which may have contributed to this perception.20 Finally, they describe peripheral factors, such as the virus’ capacity to attack different tissues, and the musculoskeletal system in particular. Ceban et al.16 describe a series of risk factors for post-COVID fatigue: female sex, adult age (children and adolescents are less frequently affected), and pre-existing comorbidities. Mazza et al.21 conducted a study evaluating fatigue over time, observing that the condition persists and even increases in intensity over the first year. The only risk factor identified was depression after COVID-19 as a predictor of fatigue at 6 and 12 months after onset of the acute infection, which may form a feedback loop or share a pathophysiological basis, such as neuroinflammation.21
Given the high prevalence and the social and healthcare implications of post-COVID syndrome, there is a need for studies to establish its aetiopathogenesis, possible therapeutic interventions, and prognostic implications. The aims of this study are, on the one hand, to assess fatigue and comorbidity with cognitive alterations, depression, and/or anxiety, and to evaluate its impact on quality of life; and on the other, to analyse the relationship between post-COVID syndrome and inflammatory biomarkers and sleep quality.
Our hypothesis is that patients with fatigue may present higher rates of depression, anxiety, and cognitive alterations, as described in previous series.19,20 The aetiological hypothesis is that fatigue results from continuous low-grade inflammation, on the one hand, and brainstem dysfunction caused by the virus, on the other. Brainstem involvement may also explain the sleep alterations described by patients, which in turn promote cytokine release, perpetuating the symptoms.22 Inflammatory and anti-inflammatory cytokines were analysed in both groups, and questionnaires were used to assess sleep quality. We suspected that patients in the fatigue group would present elevated levels of inflammatory cytokines and greater sleep difficulties than the control group, in which we expected to observe higher levels of anti-inflammatory cytokines.
Material and methodsStudy designWe conducted a prospective, observational, single-centre case-control study, over a period of 24 weeks.
Inclusion and exclusion criteriaThe inclusion criteria were age > 18 years, history of PCR-confirmed COVID-19, and time since symptom onset of at least 12 weeks. Participants were classified as cases or controls according to the presence of symptoms of persistent fatigue related to SARS-CoV-2 infection. The presence or absence of fatigue was established using the 11-item Chalder Fatigue Scale (CFQ-11).
Exclusion criteria were as follows: intensive care admission due to acute COVID-19; prolonged fatigue attributed to causes other than COVID-19 (eg, thyroid disorders, tumours, heart failure) or existing prior to COVID-19; unwillingness to participate in the study and/or failure to complete the informed consent form; and presence of cognitive disorders prior to COVID-19.
Fatigue is defined as an overwhelming sensation of tiredness at rest, exhaustion with activity, and/or lack of energy that interferes with everyday tasks.23 Fatigue was assessed using the CFQ-11,24 and responses were recorded using a Likert scale (0–3 points).25 This scale has been used in previous studies. Scores can be assessed in 2 ways: presence or absence of fatigue (≥ 4 or ≤ 3 points, respectively), or intensity of fatigue (score ranging from 0 to 33, with higher scores indicating more severe fatigue). The scale assesses 2 dimensions: physical fatigue (items 1–7) and psychological fatigue (items 8–11).
Study design and patient selectionThe study was conducted prospectively, over 2 consultations: a baseline visit (visit 1; April–June 2021) and a follow-up visit at 24 weeks (visit 2; October–December 2021). Patients were included consecutively as they agreed to participate in the study. Using the CFQ-11 criteria (≥ 4 or ≤ 3 points), consecutive participants were screened in telephone interviews, and classified as cases or controls, according to the presence or absence of fatigue. At visit 1, participants signed informed consent forms and completed a questionnaire about the study variables: sociodemographic data, comorbidities prior to COVID-19, clinical presentation of COVID-19, care in the acute phase, current situation, and anthropometric data.
The following assessment instruments were used:
- a)
Sleep quality: Pittsburgh Sleep Quality Index26;
- b)
Sleepiness: Epworth Sleepiness Scale27;
- c)
Fatigue: CFQ-11;
- d)
Anxiety: Hamilton Anxiety Rating Scale28;
- e)
Depression: Beck Depression Inventory29;
- f)
Cognitive impairment: Montreal Cognitive Assessment (MoCA)30;
- g)
Quality of life: EuroQol EQ-5D-5L.31
At the same visit, participants were asked to complete questionnaires to quantify and confirm the above-mentioned symptoms, and a blood sample was taken. In addition to the complete blood count and biochemistry studies, enzyme-linked immunosorbent assay (ELISA) and cytometric bead array (CBA) were used to determine levels of the following proinflammatory and anti-inflammatory cytokines: IL-1, IL-6, IL-10, and TNF-α. These analyses were performed according to manufacturer recommendations.
Statistical analysisThe sample size was calculated to maximise the chances of obtaining significant, scientifically valid results, with a statistical power of 80% (equivalent to type II [beta] error of 20%) and establishing the remaining parameters as follows: type I (alpha) error of 5% (equivalent to a confidence level of 95%), and a difference between groups of at least 25% (ie, an approximate surplus recruitment of approximately 9 patients), to compensate for 10% of patients lost to follow-up (equivalent to 4 patients). This calculation returned a sample size of 40 patients per group.
Quantitative variables are expressed as mean (standard deviation [SD]) or median (quartiles 1 and 3 [Q1–Q3]), according to normal distribution. Normality of distribution was tested using the Shapiro-Wilk and Kolmogorov-Smirnov tests. Qualitative variables are expressed as absolute frequencies and percentages.
Normally distributed variables were compared between groups using the t test or one-way ANOVA when 2 or more groups were compared. Non–normally distributed variables were compared using non-parametric tests: the Mann-Whitney U test and the Kruskal-Wallis H test, respectively. Associations between quantitative variables were studied by calculating the Pearson correlation coefficient (parametric) or the Spearman correlation coefficient (non-parametric). Finally, qualitative variables were studied with the chi-square test or the Fisher exact test, as appropriate. In this study, ANOVA was used to conduct a repeated measures or paired samples analysis in order to measure progression between 2 time points (visits 1 and 2) in each individual group and/or in both groups, detecting the existence of potential significant differences in progression, both as a whole (cases vs controls) and separately (in the case group and in the control group). Statistical analysis was performed using the SPSS (version 26.0), STATA/SE (version 16.0), and R (version 4.2.2) software; the threshold for significance was set at P < .05.
All relevant ethical guidelines and standards were observed. The study was approved by our hospital’s medications research ethics committee.
ResultsData on sociodemographic and anthropometric variables and previous comorbidities are reported in Table 1. The only significant difference was the presence of obesity as a previous comorbidity in the fatigue group (P = .029).
Data on sociodemographic and anthropometric variables and comorbidities prior to diagnosis of COVID-19.
| Cases | Controls | P | |
|---|---|---|---|
| n = 40 | n = 40 | ||
| Mean age, years (SD) | 50.55 (11.52) | 51.48 (11.76) | .723 |
| Sex, n (%) | |||
| Men | 10.00 (25.00) | 8.00 (20.00) | .789 |
| Women | 30.00 (75.00) | 32.00 (80.00) | .789 |
| Marital status, n (%) | |||
| Single | 4.00 (10.00) | 5.00 (12.50) | .881 |
| Stable couple/married | 32.00 (80.00) | 32.00 (80.00) | .881 |
| Separated/divorced | 4.00 (10.00) | 3.00 (7.50) | .881 |
| Educational level, n (%) | |||
| Primary education | 1.00 (2.50) | 4.00 (10.00) | .251 |
| Secondary education | 3.00 (7.50) | 5.00 (12.50) | .251 |
| High school | 3.00 (7.50) | 5.00 (12.50) | .251 |
| Vocational/technical training | 11.00 (27.50) | 10.00 (25.00) | .251 |
| University studies | 22.00 (55.00) | 21.00 (52.50) | .251 |
| Employment status, n (%) | |||
| Unemployed | 1.00 (2.50) | 1.00 (2.50) | .128 |
| Retired | 3.00 (7.50) | 6.00 (15.00) | .128 |
| Employed | 28.00 (70.00) | 30.00 (75.00) | .128 |
| Permanently incapacitated for work | 7.00 (17.50) | 1.00 (2.50) | .128 |
| Student | 0.00 (0.00) | 2.00 (5.00) | – |
| Other | 1.00 (2.50) | 0.00 (0.00) | – |
| Socioeconomic level, n (%) | |||
| Low | 1.00 (2.50) | 0.00 (0.00) | – |
| Low-medium | 0.00 (0.00) | 1.00 (2.50) | – |
| Medium | 32.00 (80.00) | 27.00 (67.50) | .421 |
| Medium-high | 6.00 (15.00) | 11.00 (27.50) | .421 |
| High | 1.00 (2.50) | 1.00 (2.50) | .421 |
| Weight (kg), mean (SD) | 71.75 (17.98) | 69.92 (16.00) | .632 |
| Height (m), mean (SD) | 1.64 (0.08) | 1.66 (0.08) | .258 |
| BMI, kg/m2, mean (SD) | 27.56 (5.29) | 26.16 (4.91) | .225 |
| AHT, n (%) | 8.00 (20.00) | 5.00 (12.50) | .544 |
| DM, n (%) | 2.00 (5.00) | 1.00 (2.50) | 1.000 |
| Obesity (BMI > 30), n (%) | 13.00 (32.50) | 4.00 (10.00) | .029* |
| COPD, n (%) | 0.00 (0.00) | 0.00 (0.00) | – |
| Asthma, n (%) | 2.00 (5.00) | 1.00 (2.50) | 1.000 |
| Cognitive impairment, n (%) | 0.00 (0.00) | 0.00 (0.00) | – |
| Headache, n (%) | 13.00 (32.50) | 5.00 (12.50) | .061 |
| Insomnia, n (%) | 13.00 (32.50) | 7.00 (17.50) | .197 |
AHT: arterial hypertension; BMI: body mass index; COPD: chronic obstructive pulmonary disease; DM: diabetes mellitus; SD: standard deviation.
Table 2 presents data on the acute symptoms of COVID-19 and the treatments and vaccines received. Regarding symptoms, dyspnoea was more frequent among cases (recorded in 16, vs 7 among controls; P = .048). Antibiotic treatment was also more frequent in the fatigue group (18 vs 6, P = .007).
Symptoms during the acute infection, treatments received, and vaccination.
| Cases | Controls | P | |
|---|---|---|---|
| n = 40 | n = 40 | ||
| Initial symptoms of the acute infection, n (%) | |||
| Anosmia | 16.00 (40.00) | 16.00 (40.00) | 1.000 |
| Headache | 26.00 (65.00) | 23.00 (57.50) | .646 |
| Diarrhoea | 9.00 (22.50) | 6.00 (15.00) | .567 |
| Coughing | 20.00 (50.00) | 14.00 (35.00) | .258 |
| Fever | 20.00 (50.00) | 17.00 (42.50) | .654 |
| Dyspnoea | 16.00 (40.00) | 7.00 (17.50) | .048* |
| Conjunctivitis | 5.00 (12.50) | 1.00 (2.50) | .203 |
| General discomfort | 29.00 (72.50) | 23.00 (57.50) | .241 |
| Asymptomatic | 2.00 (5.00) | 2.00 (5.00) | 1.000 |
| Treatment, n (%) | |||
| Hospitalisation | 6.00 (15.00) | 4.00 (10.00) | .735 |
| Antibiotics | 18.00 (45.00) | 6.00 (15.00) | .007* |
| Hydroxychloroquine | 1.00 (2.50) | 2.00 (5.00) | 1.000 |
| Corticosteroids | 9.00 (22.50) | 3.00 (7.50) | .118 |
| Immunomodulators | 1.00 (2.50) | 0 | – |
| Vaccinated individuals, n (%) (at V2) | 36.00 (97.30) | 38.00 (97.44) | 1.000 |
| Worsening of symptoms after vaccination n (%) | 3.00 (8.33) | 0 | – |
V2: visit 2.
Table 3 shows the main neurological manifestations of COVID-19 subjectively reported by the patients; in addition to fatigue, other prevalent symptoms were dyspnoea, headache, cognitive and memory complaints, sleep disorders, and myalgia, all of which were significantly more common in the fatigue group. The clinical questionnaires showed differences between groups for fatigue, sleep difficulties, anxiety, depression, and quality of life, with higher scores in the fatigue group. Table 3 presents data from both visits, showing how clinical signs in the cases group (overall fatigue, anxiety, depression, sleep difficulties, and overall quality of life) improved over time. Table 4 presents data on the differences between visits in each group; the fatigue group showed significant improvements at 6 months for overall fatigue, physical fatigue, sleepiness, quality of life, cognitive impairment, and anxiety. The control group showed significant improvements in sleepiness, cognitive impairment, and anxiety. This group showed a statistically significant worsening for overall fatigue and fatigue subscales. Analysis of the difference between timepoints in both groups revealed statistically significant improvements in sleepiness, quality of life, cognitive impairment, and anxiety. A statistically significant worsening in psychological fatigue scores was also observed.
Current symptoms and clinical assessment scale results.
| V1 | V2 | |||||
|---|---|---|---|---|---|---|
| Cases | Controls | Cases vs controls | Cases | Controls | Cases vs controls | |
| n = 40 | n = 40 | P | n = 40 | n = 40 | P | |
| Subjective symptoms reported | ||||||
| None, n (%) | 2.00 (5.00) | 22.00 (55.00) | < .001* | 6.00 (16.22) | 19.00 (48.72) | .006* |
| Fatigue, n (%) | 33.00 (82.50) | 5.00 (12.50) | < .001* | 25.00 (67.57) | 6.00 (15.38) | < .001* |
| Dyspnoea, n (%) | 18.00 (45.00) | 3.00 (7.50) | < .001* | 12.00 (32.43) | 2.00 (5.13) | .006* |
| Headache, n (%) | 20.00 (50.00) | 4.00 (10.26) | < .001* | 10.00 (27.03) | 6.00 (15.38) | .336 |
| Cognitive impairment, n (%) | 13.00 (32.50) | 1.00 (2.50) | .001* | 12.00 (32.43) | 3.00 (7.69) | .016* |
| Sleep difficulties, n (%) | 26.00 (65.00) | 8.00 (20.00) | < .001* | 20.00 (54.05) | 3.00 (7.69) | < .001* |
| Memory complaints, n (%) | 27.00 (67.50) | 5.00 (12.50) | < .001* | 24.00 (64.86) | 5.00 (12.82) | < .001* |
| Depression | 12.00 (30.77) | 4.00 (10.00) | .044* | 9.00 (24.32) | 2.00 (5.13) | .040* |
| Anxiety | 17.00 (42.50) | 7.00 (17.50) | .028* | 14.00 (37.84) | 5.00 (12.82) | .024* |
| Sleep quality: PSQI (score > 5) | 27.00 (67.50) | 10.00 (25.00) | < .001* | 25.00 (67.57) | 7 (17.95) | < .001* |
| Pathological sleepiness: ESS (score > 10) | 19.00 (48.72) | 15.00 (37.50) | .507 | 19.00 (51.35) | 11.00 (28.21) | .108 |
| Chalder Fatigue Scale | ||||||
| Yes | 36.00 (90.00) | 8.00 (20.00) | < .001* | 26.00 (70.27) | 12.00 (30.77) | .001* |
| Fatigue intensity (0−33), mean (SD) | 16.50 (7.40) | 3.23 (4.45) | < .001* | 15.43 (8.83) | 6.85 (6.69) | < .001* |
| Physical fatigue (0−21), mean (SD) | 11.62 (4.87) | 1.88 (3.49) | < .001* | 9.46 (6.02) | 3.82 (4.16) | < .001* |
| Psychological fatigue (0−12), mean (SD) | 4.88 (3.81) | 1.35 (2.13) | < .001* | 5.97 (3.45) | 3.03 (3.03) | < .001* |
| Anxiety: Hamilton Anxiety Rating Scale | ||||||
| Major anxiety (≥ 15) | 24.00 (60.00) | 6.00 (15.00) | < .001* | 17.00 (49.95) | 3.00 (7.69) | < .001* |
| Psychic anxiety (0−28), mean (SD) | 9.38 (5.67) | 4.20 (4.98) | < .001* | 7.27 (6.32) | 3.23 (4.71) | .002* |
| Somatic anxiety (0−28), mean (SD) | 7.88 (4.83) | 2.43 (3.18) | < .001* | 6.24 (5.87) | 2.00 (3.48) | < .001* |
| Depression: BDI, n (%) | ||||||
| Mild symptoms (14−19) | 9.00 (22.50) | 3.00 (7.50) | < .001* | 3.00 (8.11) | 5.00 (12.82) | .001* |
| Moderate symptoms (20−28) | 10.00 (25.00) | 2.00 (5.00) | < .001* | 8.00 (21.62) | 0 | – |
| Severe symptoms (29−63) | 5.00 (12.50) | 0 | – | 6.00 (16.22) | 1.00 (2.56) | .001* |
| Cognitive impairment (MoCA), n (%) (score < 26/30) | 12.00 (30.00) | 9.00 (23.08) | .493 | 4.00 (10.81) | 3.00 (7.69) | .644 |
| Quality of life (EQ-5D-5L) (max 25), mean (SD) | 9.10 (2.67) | 6.18 (1.95) | < .001* | 8.41 (3.07) | 5.72 (1.32) | < .001* |
| Quality of life (EQ-5D-5L) VAS (max 100), mean (SD) | 62.15 (17.05) | 78.65 (12.68) | < .001* | 66.43 (18.90) | 78.69 (15.83) | .003* |
BDI: Beck Depression Inventory; ESS: Epworth Sleepiness Scale; MoCA: Montreal Cognitive Assessment; PSQI: Pittsburgh Sleep Quality Index; SD: standard deviation; VAS: visual analogue scale; V1: visit 1; V2: visit 2.
Paired-samples analysis comparing cases and controls between visits (V2/V1).
| Cases (V2/V1) | Cases (V2/V1) | Controls (V2/V1) | Controls (V2/V1) | Cases vs controls (V2/V1) | |
|---|---|---|---|---|---|
| n = 40 | P | n = 40 | P | P | |
| CFQ-11 | |||||
| Presence of fatigue (%) | 0.19 | .006* | −0.10 | .160 | .442 |
| Fatigue intensity (score 0−33), mean | 1.00 | .440 | −0.10 | .001* | .120 |
| Physical fatigue (score 0−21), mean | 2.03 | .037* | −0.10 | .003* | 1.000 |
| Psychological fatigue (score 0−12), mean | −0.10 | .063 | −0.10 | .005* | .001* |
| Sleep difficulties: PSQI score > 5 (%) | 0.00 | 1.000 | 0.08 | .262 | .442 |
| Pathological sleepiness: ESS score > 10 (%) | 0.44 | < .001* | 0.21 | .002* | < .001* |
| Quality of life scale: total score | 0.84 | .017* | 0.44 | .172 | .007* |
| Cognitive impairment: MoCA score < 26/30 (%) | 0.162 | .012* | 0.158 | .012* | < .001* |
| BDI: moderate-severe symptoms (score > 19) (%) | 0.05 | .544 | 0.00 | – | – |
| Hamilton Anxiety Rating Scale | |||||
| Total score (max: 56), mean | 3.73 | .013* | 1.56 | .048* | .002* |
| Psychic anxiety score (0−28), mean | 2.32 | .011* | 1.08 | .013* | .001* |
| Somatic anxiety score (0−28), mean | 1.89 | .021* | 0.49 | .325 | .013* |
BDI: Beck Depression Inventory; CFQ-11: Chalder Fatigue Scale; ESS: Epworth Sleepiness Scale; MoCA: Montreal Cognitive Assessment; PSQI: Pittsburgh Sleep Quality Index; V1: visit 1; V2: visit 2.
Absolute numbers are the difference in scores between visits. Positive values represent improvement and negative numbers represent worsening.
An analysis of the correlation between fatigue and cognitive impairment as measured with the MoCA identified a correlation value of –0.10 (P = .391), indicating lack of correlation between these variables. The study of correlation between fatigue and anxiety and depression as measured with assessment scales (correlation values of 0.55 [P = .001] and 0.6 [P < .001], respectively) suggested a possible correlation between fatigue and these 2 symptoms. Analysis of the correlation between sleep quality and the inflammatory cytokine IL-6 revealed correlation values of –0.07 (P = .530) at visit 1 and –0.14 (P = .244) at visit 2. These results show that sleep difficulties were not significantly related with the inflammatory cytokine IL-6; however, this may be due to the small sample size, and we cannot draw robust conclusions regarding this finding.
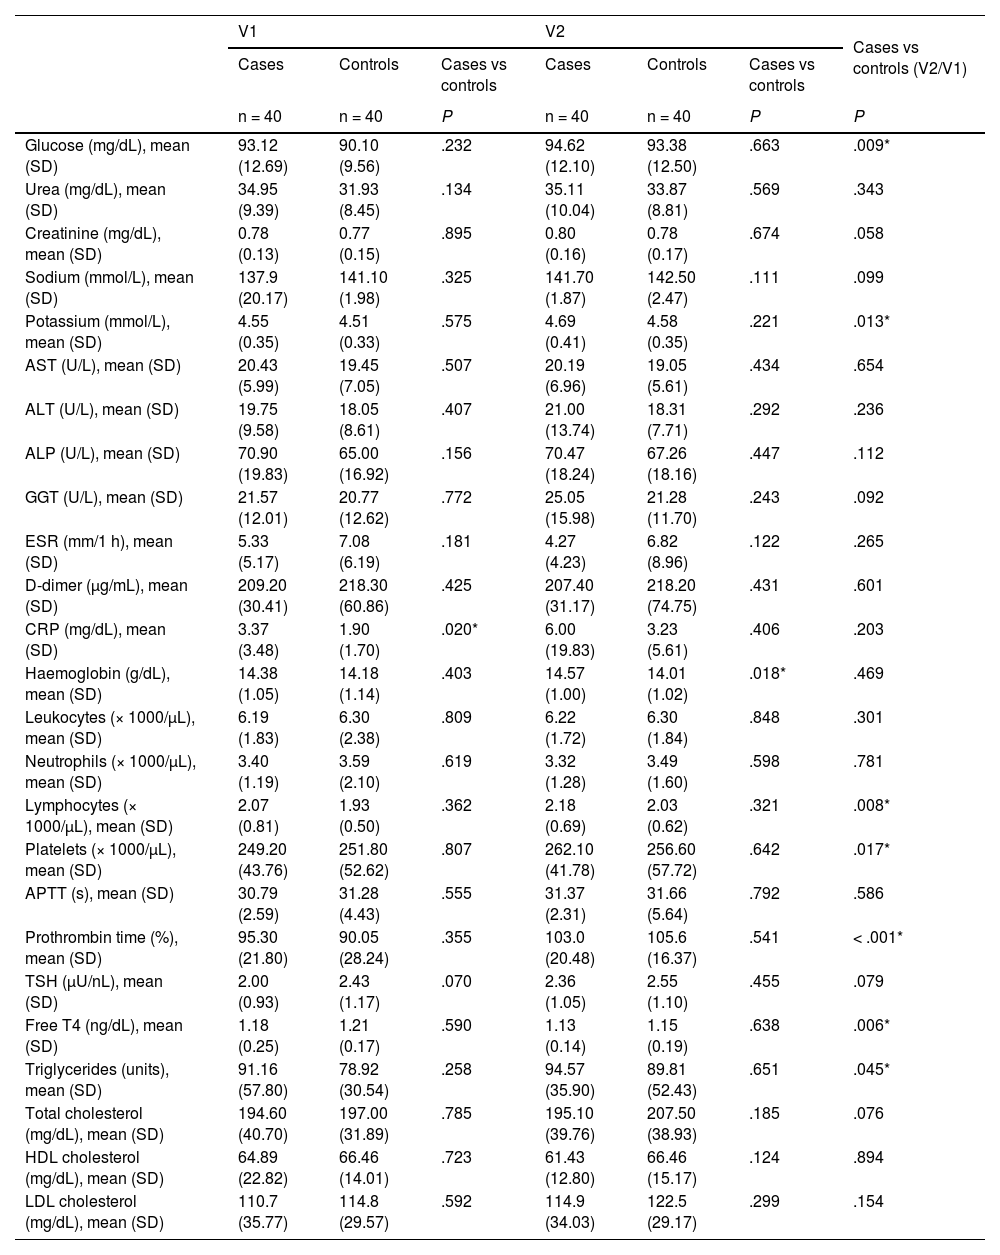
Regarding the laboratory studies, no clinically relevant alterations were observed; we did find statistically significant differences between the groups for C-reactive protein values at visit 1 and for haemoglobin at visit 2, although these were not clinically significant (Table 5). Furthermore, analysis of the difference between groups over time revealed statistically significant differences in glucose and potassium levels, lymphocyte and platelet count, prothrombin time, and free T4 and triglyceride levels; none of these differences were clinically significant. The cytokine study revealed statistically significant differences in TNF-α levels (Table 6). The remaining cytokines did not show statistically significant differences, although we did observe a non-significant trend towards higher levels of the anti-inflammatory cytokine IL-10 in the control group.
Comparison of laboratory findings between groups (paired samples and independently) and between visits.
| V1 | V2 | Cases vs controls (V2/V1) | |||||
|---|---|---|---|---|---|---|---|
| Cases | Controls | Cases vs controls | Cases | Controls | Cases vs controls | ||
| n = 40 | n = 40 | P | n = 40 | n = 40 | P | P | |
| Glucose (mg/dL), mean (SD) | 93.12 (12.69) | 90.10 (9.56) | .232 | 94.62 (12.10) | 93.38 (12.50) | .663 | .009* |
| Urea (mg/dL), mean (SD) | 34.95 (9.39) | 31.93 (8.45) | .134 | 35.11 (10.04) | 33.87 (8.81) | .569 | .343 |
| Creatinine (mg/dL), mean (SD) | 0.78 (0.13) | 0.77 (0.15) | .895 | 0.80 (0.16) | 0.78 (0.17) | .674 | .058 |
| Sodium (mmol/L), mean (SD) | 137.9 (20.17) | 141.10 (1.98) | .325 | 141.70 (1.87) | 142.50 (2.47) | .111 | .099 |
| Potassium (mmol/L), mean (SD) | 4.55 (0.35) | 4.51 (0.33) | .575 | 4.69 (0.41) | 4.58 (0.35) | .221 | .013* |
| AST (U/L), mean (SD) | 20.43 (5.99) | 19.45 (7.05) | .507 | 20.19 (6.96) | 19.05 (5.61) | .434 | .654 |
| ALT (U/L), mean (SD) | 19.75 (9.58) | 18.05 (8.61) | .407 | 21.00 (13.74) | 18.31 (7.71) | .292 | .236 |
| ALP (U/L), mean (SD) | 70.90 (19.83) | 65.00 (16.92) | .156 | 70.47 (18.24) | 67.26 (18.16) | .447 | .112 |
| GGT (U/L), mean (SD) | 21.57 (12.01) | 20.77 (12.62) | .772 | 25.05 (15.98) | 21.28 (11.70) | .243 | .092 |
| ESR (mm/1 h), mean (SD) | 5.33 (5.17) | 7.08 (6.19) | .181 | 4.27 (4.23) | 6.82 (8.96) | .122 | .265 |
| D-dimer (μg/mL), mean (SD) | 209.20 (30.41) | 218.30 (60.86) | .425 | 207.40 (31.17) | 218.20 (74.75) | .431 | .601 |
| CRP (mg/dL), mean (SD) | 3.37 (3.48) | 1.90 (1.70) | .020* | 6.00 (19.83) | 3.23 (5.61) | .406 | .203 |
| Haemoglobin (g/dL), mean (SD) | 14.38 (1.05) | 14.18 (1.14) | .403 | 14.57 (1.00) | 14.01 (1.02) | .018* | .469 |
| Leukocytes (× 1000/μL), mean (SD) | 6.19 (1.83) | 6.30 (2.38) | .809 | 6.22 (1.72) | 6.30 (1.84) | .848 | .301 |
| Neutrophils (× 1000/μL), mean (SD) | 3.40 (1.19) | 3.59 (2.10) | .619 | 3.32 (1.28) | 3.49 (1.60) | .598 | .781 |
| Lymphocytes (× 1000/μL), mean (SD) | 2.07 (0.81) | 1.93 (0.50) | .362 | 2.18 (0.69) | 2.03 (0.62) | .321 | .008* |
| Platelets (× 1000/μL), mean (SD) | 249.20 (43.76) | 251.80 (52.62) | .807 | 262.10 (41.78) | 256.60 (57.72) | .642 | .017* |
| APTT (s), mean (SD) | 30.79 (2.59) | 31.28 (4.43) | .555 | 31.37 (2.31) | 31.66 (5.64) | .792 | .586 |
| Prothrombin time (%), mean (SD) | 95.30 (21.80) | 90.05 (28.24) | .355 | 103.0 (20.48) | 105.6 (16.37) | .541 | < .001* |
| TSH (μU/nL), mean (SD) | 2.00 (0.93) | 2.43 (1.17) | .070 | 2.36 (1.05) | 2.55 (1.10) | .455 | .079 |
| Free T4 (ng/dL), mean (SD) | 1.18 (0.25) | 1.21 (0.17) | .590 | 1.13 (0.14) | 1.15 (0.19) | .638 | .006* |
| Triglycerides (units), mean (SD) | 91.16 (57.80) | 78.92 (30.54) | .258 | 94.57 (35.90) | 89.81 (52.43) | .651 | .045* |
| Total cholesterol (mg/dL), mean (SD) | 194.60 (40.70) | 197.00 (31.89) | .785 | 195.10 (39.76) | 207.50 (38.93) | .185 | .076 |
| HDL cholesterol (mg/dL), mean (SD) | 64.89 (22.82) | 66.46 (14.01) | .723 | 61.43 (12.80) | 66.46 (15.17) | .124 | .894 |
| LDL cholesterol (mg/dL), mean (SD) | 110.7 (35.77) | 114.8 (29.57) | .592 | 114.9 (34.03) | 122.5 (29.17) | .299 | .154 |
ALP: alkaline phosphatase; ALT: alanine transaminase; APTT: activated partial thromboplastin time; AST: aspartate transaminase; CRP: C-reactive protein; ESR: erythrocyte sedimentation rate; GGT: gamma-glutamyl transferase; HDL: high-density lipoprotein; LDL: low-density lipoprotein; SD: standard deviation; TSH: thyroid-stimulating hormone; V1: visit 1; V2: visit 2.
Results of cytokine analysis.
| Cases (V1) | Controls (V1) | Cases (V2) | Controls (V2) | Cases (V2/V1) | Controls (V2/V1) | Cases vs controls (V1) | Cases vs controls (V2) | Cases vs controls (V2/V1) | |
|---|---|---|---|---|---|---|---|---|---|
| n = 40 | n = 40 | n = 40 | n = 40 | P | P | P | P | P | |
| IL-1β (pg/mL), mean (SD) | 1.00 (0.00) | 1.00 (0.00) | 1.00 (0.00) | 1.00 (0.00) | 1.000 | 1.000 | 1.000 | 1.000 | 1.000 |
| IL-6 (pg/mL), mean (SD) | 1.92 (2.50) | 1.12 (1.34) | 2.15 (3.04) | 0.99 (1.16) | .785 | .952 | .233 | .113 | .867 |
| IL-10 (pg/mL), mean (SD) | 4.55 (1.01) | 6.47 (7.88) | 5.17 (1.94) | 6.66 (7.15) | .127 | .479 | .338 | .683 | .126 |
| TNF-α (pg/mL), mean (SD) | 4.03 (0.19) | 4.04 (0.20) | 6.46 (5.35) | 6.33 (4.80) | < .001* | .001* | .628 | .487 | < .001* |
SD: standard deviation; V1: visit 1; V2: visit 2.
Post-COVID syndrome, and specifically the fatigue related to the syndrome, is a new entity that is highly relevant in the light of its high incidence and associated disability. Furthermore, its pathophysiology remains unclear, and further research is needed to better understand the syndrome and potential therapeutic alternatives. This study aims to contribute to the understanding of the condition. Our results show similarities between cases and controls in terms of clinical presentation of COVID-19, age, and sex, with a predominance of women and a mean age of 50 years, similar to the patient characteristics described in other series.32 Most participants had at least secondary education, 70% were in active employment, and the great majority had medium or high socioeconomic level, with no differences between groups.
Symptoms of the acute infection were similar in both groups, although the fatigue group showed a non-significant trend towards higher frequency of coughing, and a significantly higher frequency of dyspnoea; no profile was associated with higher risk of fatigue. These results are consistent with previously published evidence, and with the hypothesis that initial symptoms do not influence or predict the onset of fatigue or other symptoms of post-COVID syndrome.33 Regarding previous comorbidities, obesity was significantly more frequent in the fatigue group. Obesity is a known predisposing factor for greater severity of COVID-19.34 No data are available on the association between post-COVID syndrome and history of obesity. Based on the hypothesis that the pathophysiology of post-COVID syndrome may be explained by persistence of chronic inflammation,35 and given that individuals with obesity present higher levels of chronic inflammatory activity,36 this may be a predisposing factor for the syndrome.
The neurological symptoms most frequently described by patients at the time of the interview were fatigue, headache, dyspnoea, sleep difficulties, sleepiness, memory complaints, depression, anxiety, and myalgia. Statistically significant differences were observed between cases and controls for fatigue, dyspnoea, and headache; other series report similar results.32
The first visits were held in April 2021, in the early days of the mass public vaccination campaign. At visit 1, only 40% of patients were vaccinated, partly because they had recently had COVID-19. At 6 months, 97% of patients (across both groups) had been vaccinated; participants reported no symptom worsening after vaccination; in the absence of other publications confirming this finding, this suggests that vaccination does not worsen symptoms.
Focusing on fatigue, we would underscore that although the prevalence of fatigue decreases over time, its intensity does not, remaining moderate both during the acute infection and at the initial and follow-up visits. Another noteworthy finding is that, despite the mixture of physical and psychological fatigue, a slight improvement in the former was observed in the cases group at 6 months, whereas the latter tended to worsen; this difference was statistically significant. The control group displayed a general worsening in fatigue scores. Clinically, this may be explained by the fact that in order to be included in the control group, an individual was required to present a low score on fatigue scales: a small change in these scores, which may not be clinically significant, may nonetheless be statistically significant, demonstrating the scale’s great sensitivity. Similarly, comparison between both groups over time also showed statistically significant worsening of psychological fatigue; no reasons were identified for this finding, which may represent a new line of research to identify the underlying mechanism explaining this type of fatigue.
We also observed statistically significant differences in scores for sleep difficulties, sleepiness, anxiety, and depression, which were observed more frequently in patients with fatigue than in controls. Anxiety, sleepiness, and quality of life showed significant improvements at 6 months; these differences were also observed in the analysis of both groups over time.
Cognitive impairment did not show differences between groups at either timepoint. This may be due to the high number of participants in both groups (30% of cases and 23% of controls) who presented cognitive symptoms at the baseline visit, according to the assessment instruments used. However, we did observe statistically significant differences in the analysis of progression after 6 months, both in each group individually and in the comparison of the changes observed in each group; this shows that, as occurred with fatigue, cognitive symptoms improved over time.
The results of the correlation analysis were not statistically significant; therefore, we conclude that in our series, there was no association between fatigue and cognitive impairment, and that these symptoms are independent. Cognitive symptoms showed an improvement, and were independent of fatigue. This lack of association between cognition and fatigue is consistent with the results of another recent study,37 and is probably explained by the fact that the underlying pathophysiological mechanisms in fatigue and cognitive impairment among patients with post-COVID syndrome may involve different cognitive areas, which are less comprehensively examined and studied in the tests used. Another possible explanation is that different brain areas and networks are involved; more exhaustive examination with neuroimaging studies would be necessary to locate these. Díez-Cirarda et al.38 recently published a series of 86 patients with post-COVID syndrome, comparing them against 36 healthy controls. The authors observed reduced connectivity between the left and right parahippocampal areas, and orbitofrontal and cerebellar areas in patients, compared to controls.
Fatigue is typically associated with brainstem involvement,39 whereas cognitive impairment is usually associated with alterations in frontal and frontoparietal regions40; however, this is subject to variability, as shown by the published studies on the subject. Delorme et al.41 conducted a study using FDG-PET to evaluate glucose metabolism in patients with COVID-19 and fatigue. They observed frontal hypometabolism and cerebellar hypermetabolism; these findings may be related to fatigue. In a study including 35 patients, Guedj et al.42 also observed cerebral hypometabolism involving the straight/orbital gyrus, the right temporal lobe with extension to the ipsilateral thalamus, the pons, and the cerebellum; involvement of the latter region was associated with cognitive complaints. Finally, Rudroff et al.43 reviewed several articles on PET and post-COVID syndrome, concluding that brain involvement predominantly affects the frontal region, or at least the frontal area of cortico-subcortical networks.
It is also noteworthy that the percentage of patients in the control group whose neuropsychological screening test results indicated cognitive impairment was substantially higher (23%) than the percentage of patients with subjective cognitive complaints (2.5%). This echoes the findings of another article, whose authors conducted a subanalysis to study whether cognitive involvement was more frequent among patients with or without cognitive complaints; the results were negative, that is, as in our study, there were patients in whom the screening test identified cognitive alterations of which the patients were not aware.44 This subjective minimisation of cognitive impairment with respect to other symptoms more closely related to personality traits was reported in a recent article by Delgado-Alonso et al.,45 who describe a personality related to post-COVID syndrome that is characterised by an emphasis on depression and anxiety, but not cognitive complaints.
As mentioned above, our results show that patients with fatigue scored significantly higher on anxiety and depression scales than those in the control group, raising the question of whether these symptoms are aetiologically related to the sensation of fatigue. However, more targeted studies would be needed to demonstrate a causal relationship, as mood disorders may also have been caused by fatigue or by post-COVID syndrome itself. In fact, anxiety improved significantly over time, whereas fatigue did not. Unlike anxiety, depression scores remained stable over time; similar findings are reported by Mazza et al.46 These authors link this observation to the persistent inflammatory state and to the individual characteristics (sex and previous psychiatric history) of the patients included. Might depressive symptoms be related to more psychological fatigue, and anxiety to more physical fatigue? If this is the case, then these results may be related to our own; however, we found no evidence confirming this hypothesis. In another study, Mazza et al.21 evaluated fatigue over time, observing that the condition persists and even increases in intensity over the first year. Depression after COVID-19 was the only factor identified as a predictor of fatigue at 6 and 12 months after symptom onset. The authors suggest that this may form a feedback loop, with the 2 conditions sharing a common pathophysiological basis, such as neuroinflammation.21
Sleep is known to be fundamental in homeostasis and cognitive capacity. Sleep is regulated by the hypothalamus and autonomic nervous system, among other mechanisms.47 Sleep disorders have been reported to cause cardiovascular and cognitive problems, and to provoke a continuous state of low-grade inflammation.48 The SARS-CoV-2 virus is also known to be able to provoke brainstem dysfunction through both direct and indirect action.14 In patients with chronic fatigue syndrome (CFS), whose symptoms resemble those associated with post-COVID syndrome in some respects, correlations have been reported between CFS severity and brainstem dysfunction, specifically involving the ascending reticular system.49 This brainstem dysfunction may explain the sleep disorders, which may in turn cause chronic inflammation that would perpetuate the symptoms.22 The fact that sleep disorders were more severe in the fatigue group may be related to the hypothesis that post-COVID syndrome results from a state of low-grade inflammation.50 We analysed the correlation between inflammatory cytokines and sleep alterations, but were unable to confirm this hypothesis; the lack of significant results may be due to the small sample size.
The pathophysiology of post-COVID syndrome was explored in a recent review article.12 The authors suggested that fatigue may result from cerebral neuroinflammation secondary to SARS-CoV-2 infection or from systemic inflammation secondary to innate immune system activation in the brain through a series of humoural signals or retrograde pathways (vagus nerve); thus, the immune response for SARS-CoV-2 would generate proinflammatory cytokines that could trigger multiple symptoms of post-COVID syndrome. Our analysis of inflammatory and anti-inflammatory cytokines only revealed significant differences in TNF-α values in the analysis comparing both groups over time. However, we did observe a trend towards higher levels of IL-6 (an inflammatory cytokine) in the fatigue group and IL-10 (an anti-inflammatory cytokine) in the control group; these differences persisted at visit 2. These trends are consistent with the pro-inflammatory hypothesis, which should be confirmed by studies with larger patient groups, or using different study designs (comparison against healthy volunteers). Mazza et al.46 analysed neurocognitive symptoms and depression 3 months after SARS-CoV-2 infection, as well as a series of inflammatory parameters (C-reactive protein, neutrophil/lymphocyte ratio, monocyte/lymphocyte ratio) and the immune-inflammatory index (platelets × neutrophils/lymphocytes). The results showed higher levels of these parameters in patients who presented symptoms 3 months later. A meta-analysis16 studying fatigue and cognitive impairment in patients with post-COVID syndrome observed elevated levels of such peripheral markers as C-reactive protein and d-dimer, as well as inflammatory cytokines (IL-17A, IL-1β, IL-6), in the patient group; the authors report an association between elevated levels of inflammatory markers and post-COVID symptoms. The main difference with respect to our own study is that the authors compared patients against healthy volunteers, and do not report progression over time.
Regarding quality of life, patients with fatigue present clearly poorer quality of life than controls, although an improvement was observed at 6 months; studies with longer follow-up periods should seek to confirm whether this difference is time-limited.
Study limitationsThis is an observational study with a limited patient sample. The sample did not include patients who were admitted to the intensive care unit; however, this would have introduced multiple distractors, which might have interfered with the validity of the results.
ConclusionsBased on our data, we may conclude that fatigue in post-COVID syndrome is of moderate severity and affects patients’ quality of life, but shows an improvement at 6 months’ progression. The only previous comorbidity showing a statistically significant association with fatigue was obesity. The neurological symptoms of patients with fatigue also include sleep difficulties and higher scores on depression and anxiety scales; several of these symptoms improve at 6 months: quality of life, anxiety, sleepiness, and cognitive alterations. Significant alterations in TNF-α levels and a non-significant trend towards a proinflammatory state were observed among patients with fatigue.
FundingThis research received funding from the neurology department of Hospital San Pedro.
The authors are grateful to José Ramón Blanco, M. Eugenia Marzo, M. Jesús Chinchetru, María Barrios, and Lourdes Romero. We also wish to thank all the patients who participated in the study.
