


This article analyzes Mexican trade in manufactured goods at the subsector level for the period 1993–2013. The results show that underlying dynamic manufacturing exports is a high dependency on manufacturing imports, particularly of capital and intermediate goods and high technology inputs. This has led to important deficits in the trade balance for important manufacturing sectors. In addition, although the Mexican economy has had trade surpluses with both Canada and the United States, it has shown increasing trade deficits vis-à-vis China, Japan, Korea, and the European Union, particularly in the manufacturing sector.
Este trabajo analiza el comercio exterior manufacturero en el nivel de los subsectores durante el periodo 1993–2013. Los resultados muestran que detrás del gran dinamismo exportador de bienes manufacturados, se mantiene una elevada dependencia de las importaciones manufactureras, particularmente las relacionadas con bienes de capital, intermedios y de alta tecnología. Lo anterior ha generado considerables déficits en la balanza comercial de importantes sectores en la manufactura. Finalmente, se destaca que aunque la economía mexicana ha mostrado un superávit comercial con Estados Unidos y Canadá, también es visible un creciente déficit, sobre todo en el sector manufacturero, con las economías de China, Japón, Corea y la Unión Europea.
The North American Free Trade Agreement (nafta) brought about favorable conditions for the economic growth of Mexico based on manufacturing exports. In particular, the comparatively low wages and proximity to the U.S. market increased the profitability of foreign direct investment (fdi) and exporting firms. It is worth mentioning that the manufacturing sector, and specifically the automobile and electronic subsectors, expanded rapidly during the 1990s.
In spite of the initial rapid growth of manufacturing sector output and exports, several authors have pointed out that there has not been an economic convergence between Mexico and the United States (Blecker, 2003), that liberalization and integration policies applied in Mexico were not accompanied by development policies to encourage investment in research and development (Zepeda, Wise, and Gallagher, 2009), and that sectoral policies for promoting innovation and manufacturing chains have been lacking (Moreno-Brid, Santamaría, Rivas, 2006). Therefore, it has been argued that this surge in exports has not reduced unemployment or resolved the macroeconomic disequilibrium of Mexico (Gracia Hernández, 2010) and that the gains in labor productivity have been rather modest. In fact, Atkin (2012) estimated that the growth of manufacturing exports in Mexico between 1986 and 2000 actually increased the school dropout rate because local expansion in manufacturing exports raised the opportunity cost of schooling for students.
The objective of this article is to analyze the trend and structure of Mexican trade in manufactured goods in the context of nafta, particularly the exports, and discuss the effects of the trade balance on the macroeconomic performance of Mexico’s economy. It is organized as follows: the first section analyzes the expansion of trade in North America and the effect of nafta on the economic integration of the region; the second section describes the characteristics and limitations of the development of Mexican trade in manufactured goods; the third section analyzes the impact of the Chinese economy’s increasing presence both in the United States and Mexico; and, finally, the last section presents concluding remarks about the probable limitations of Mexico’s trade in manufactured goods in the context of nafta.
nafta, Expansion of Trade and The Integration of North AmericaTheoretical Aspects of Economic IntegrationA theoretical basis for opening the Mexican economy and subsequently incorporating it into nafta was the export-led growth hypothesis. This approach pinpoints the export sector as the main determinant of economic growth. Traditional classical economic models have considered that free trade and international specialization encourages the productivity of the nations involved (Bhagwati, 1978, and (Krueger, 1978). Additionally, since the 1980s, new theoretical developments based on the endogenous growth theory have established new models underlining the determinant role of trade for economic growth. Among the pioneer papers, the models of Grossman and Helpman (1991) and Romer (1991) postulate that increased international trade promotes the expansion of specialized inputs. As a result, opening an economy to international trade increases the rate of economic growth in the long run.
A number of empirical studies have been carried out, based on a production function including exports, with the aim of corroborating the externalities of exports and spillover effects to the rest of the economy. The argument given to support this positive relationship is based on the effect of exports on the overall productivity of the economy according to the following considerations:
- a)
Exports contribute to economic growth by increasing capacity utilization and economies of scale, and generating competition that promotes incentives for technological improvements and better management. As a result, marginal productivities are higher in export industries (Feder, 1983).
- b)
Exports are concentrated in efficient economic sectors and, therefore, export expansion increases the overall total productivity of the economy (Balassa, 1985).
Subsequently, a number of empirical papers have published results in favor of exports as an economic growth engine. However, the findings are not homogeneous and the positive impact of exports on growth has not been completely proven by empirical research. To do that, it is necessary to consider the comparative advantages that determine the activities that produce long-term economic growth, such as externalities, technology, etc. (Feenstra, 1990). Therefore, the experiences in Southeast Asia and China have their own particular set of economic conditions that might not be replicable in other countries.
The other literature that has been a basis for promoting free trade in North America is that regarding customs unions and free trade areas. Based on the objective of estimating the degree of maximization of national income (Kowalczyk and Davis, Donald, 1988), several papers have found that the reduction of the highest tariff rate to the next highest level raises global well-being (Hatta and Fukushima, 1979). However, the estimations have also been subject to debate, and other papers have found that the reduction in a single, not very high tariff has an ambiguous effect on world income (Vanek, 1964).
Therefore, as a result of the opposite theoretical views with respect to the effects on the economy of trade expansion and the negative and positive effects of preferential trade agreements on economic dynamics, further empirical research is required. In particular, the economic integration of North America and its effects on Mexican exports needs to be studied, considering the expansion of China’s international trade. China’s trade with North America has transformed North American trade, as well as the structure and development of Mexican exports, particularly in manufacturing.
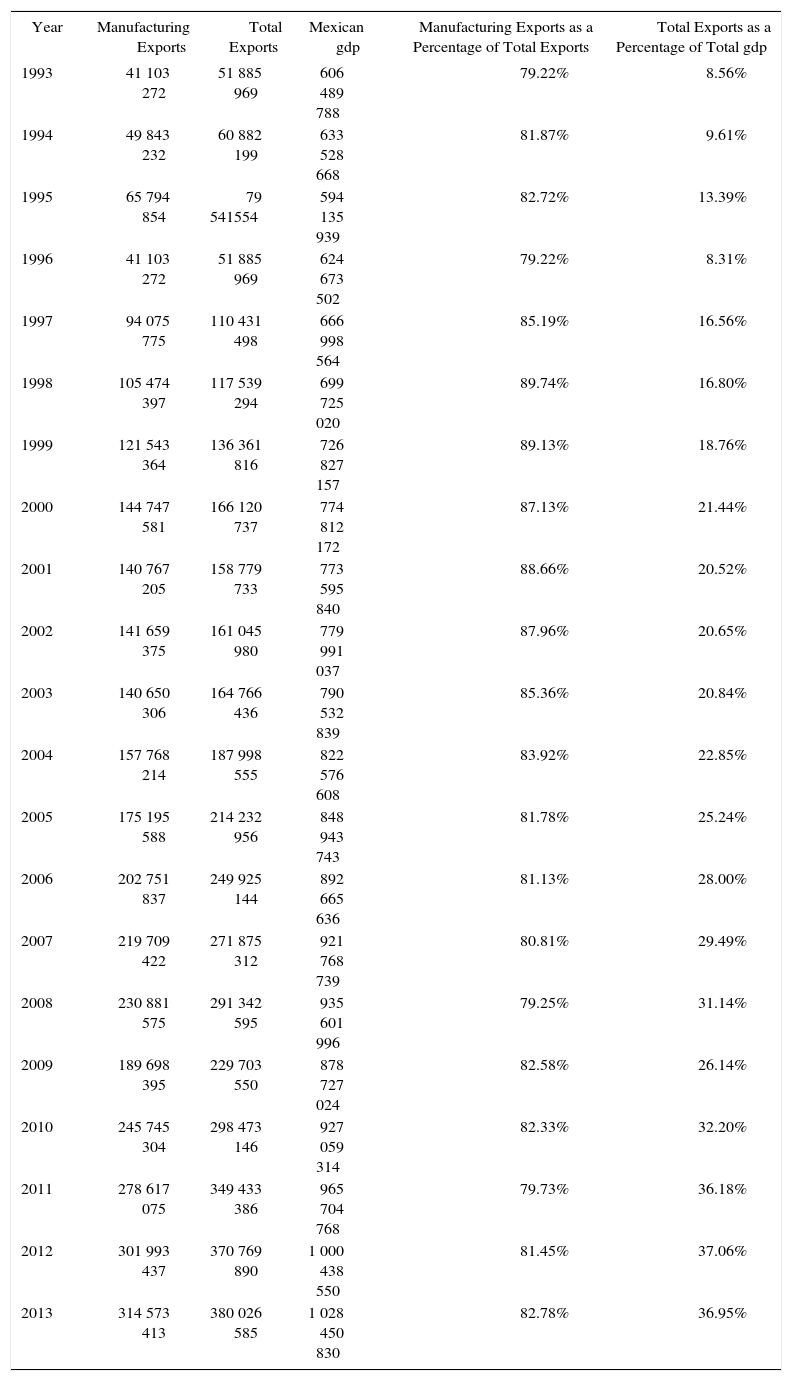
Mexico’s Trade Expansion and Business Integration with the United StatesMexican trade has increased very rapidly since the establishment of nafta (Graph 1). As a result, the share of exports in Mexico’s gdp increased from 8.56 percent in 1993 to 36.95 percent in 2013 (Table 1). Between 1993 and 2013, exports grew 9.96 percent on average annually, while imports grew 8.82 percent. Both Canada and the United States accounted for 94.56 percent of Mexico’s total exports in 1994; in 2013 that share dropped to 91.71 percent (inegi, 2014p). However, even though the share of Mexican exports to both the United States and Canada dropped, the U.S. accounted for 88.66 percent of total trade, while Canada represented only 3.10 percent (Graph 2).
")
Mexico’s Exports, Imports, and Total Trade Balance (Millions of USD)
Mexican Manufacturing Exports (1993–2013, Thousands of USD)
| Year | Manufacturing Exports | Total Exports | Mexican gdp | Manufacturing Exports as a Percentage of Total Exports | Total Exports as a Percentage of Total gdp |
|---|---|---|---|---|---|
| 1993 | 41 103 272 | 51 885 969 | 606 489 788 | 79.22% | 8.56% |
| 1994 | 49 843 232 | 60 882 199 | 633 528 668 | 81.87% | 9.61% |
| 1995 | 65 794 854 | 79 541554 | 594 135 939 | 82.72% | 13.39% |
| 1996 | 41 103 272 | 51 885 969 | 624 673 502 | 79.22% | 8.31% |
| 1997 | 94 075 775 | 110 431 498 | 666 998 564 | 85.19% | 16.56% |
| 1998 | 105 474 397 | 117 539 294 | 699 725 020 | 89.74% | 16.80% |
| 1999 | 121 543 364 | 136 361 816 | 726 827 157 | 89.13% | 18.76% |
| 2000 | 144 747 581 | 166 120 737 | 774 812 172 | 87.13% | 21.44% |
| 2001 | 140 767 205 | 158 779 733 | 773 595 840 | 88.66% | 20.52% |
| 2002 | 141 659 375 | 161 045 980 | 779 991 037 | 87.96% | 20.65% |
| 2003 | 140 650 306 | 164 766 436 | 790 532 839 | 85.36% | 20.84% |
| 2004 | 157 768 214 | 187 998 555 | 822 576 608 | 83.92% | 22.85% |
| 2005 | 175 195 588 | 214 232 956 | 848 943 743 | 81.78% | 25.24% |
| 2006 | 202 751 837 | 249 925 144 | 892 665 636 | 81.13% | 28.00% |
| 2007 | 219 709 422 | 271 875 312 | 921 768 739 | 80.81% | 29.49% |
| 2008 | 230 881 575 | 291 342 595 | 935 601 996 | 79.25% | 31.14% |
| 2009 | 189 698 395 | 229 703 550 | 878 727 024 | 82.58% | 26.14% |
| 2010 | 245 745 304 | 298 473 146 | 927 059 314 | 82.33% | 32.20% |
| 2011 | 278 617 075 | 349 433 386 | 965 704 768 | 79.73% | 36.18% |
| 2012 | 301 993 437 | 370 769 890 | 1 000 438 550 | 81.45% | 37.06% |
| 2013 | 314 573 413 | 380 026 585 | 1 028 450 830 | 82.78% | 36.95% |
")
Mexican Exports to NAFTA Members and Total Exports (1993–2013)
Therefore, we can conclude that before nafta, there was already an important volume of trade between Mexico and the U.S. that had been generated by the opening of the Mexican economy in 1986. Also, the Mexican economy’s liberalization and its integration as a nafta member not only accelerated trade between Mexico and the other nafta countries, but also increased trade and particularly the imports from other economies.
As a result of the expansion of Mexican exports, the trade balance with the U.S. became positive and helped offset to a certain extent the Mexican economy’s large trade deficit (Graph 3). However, it is important to point out that the increasing trade and flows of fdi to Mexico generated a close correlation between Mexican exports and the changes in U.S. economic activity. As shown in Graph 4, the logarithm of the indices of growth for both Mexican exports and the U.S. gdp showed that, with the exception of the years 1995, 1996, and 1997, when the Mexican economy went through an economic recession generated by its own macroeconomic disequilibrium, the growth of Mexican exports and the growth of the U.S. gdp exhibited the same business-cycle trend, with an expansion from 1998 to 2000, a downturn from 2007 to 2009, and an important recovery in 2010 and 2011.
")
Mexico’s Trade Balance, Total and with the U.S. (Millions of USD)

Log of Growth Indices of Mexican Exports and U.S. GDP
As shown in Graph 5, the cyclical component of the logarithm of the Mexico’s gdp and the U.S. gdp began moving in a pro-cyclical fashion after 1995. However, in previous years, particularly between 1984 and 1990, the U.S. economy showed a tendency to rise while the Mexican gdp cyclical component followed a negative trend. Moreover, during the period from 1979 to 1981, the U.S. gdp had a negative cyclical component while Mexico’s was positive. Therefore, it can be concluded that under nafta the trade in manufactured goods between the U.S. and Mexico evolved in a synchronization of the business cycle.
")
Cyclical Component of U.S. and Mexican GDP (1969–2013)
It has been argued that the expansion of manufacturing exports to the U.S. was boosted by the trade liberalization that began before nafta came into effect (Gruben, 2001). In fact, the establishment of the treaty was just the final step in a process that started with the dismantling of the import-substitution period and the reduction of tariffs and non-tariff barriers from 1985 to 1987, when Mexico entered the General Agreement on Tariffs and Trade (gatt). However, as a result of the trade liberalization process, the proximity to one of the larger markets in the world and low U.S. tariffs encouraged Mexican manufacturing of goods destined for export to the U.S. market (Hanson, 1998).
The increase of manufacturing exports after nafta is linked to the combination of the preferential reduction of tariffs and the interaction of fdi and outsourcing in order to develop more specialized production (Fukao, Okubo, and Stern, 2002). As a result, in the case of the Mexican economy, an initial surge of vertical specialization resulted from tariff reductions; this, together with foreign investment liberalization generated by nafta, combined with geographic proximity, encouraged maquiladora activities (assembly of temporarily imported inputs from the U.S.) and transformed the patterns of Mexican trade (Hummels, Ishii, and Yi, 1999).
Total exports as a percentage of gdp rose from 8.56 percent in 1993 to 36.95 percent in 2013, more than a four-fold increase (Table 1). This remarkable expansion revealed the new opportunities for Mexican exports in the U.S. market, under the liberalization of the Mexican economy and the favorable conditions for receiving important flows of foreign direct investment. However, several aspects of the Mexican trade in manufactured goods are important to address because they show limitations to the manufacturing exports model based on the dynamics generated by the economic integration encouraged by nafta.
Success and Limitations of Mexican Trade in Manufactured GoodsOne of the main features of Mexican export expansion under nafta has been the increasing share of manufactured goods within total exports. Therefore, the growing relevance of exports in Mexico’s economic activity is mainly related to the dynamics of manufacturing exports. After nafta came into effect, the share of manufactures in Mexico’s total exports increased from 79.22 percent in 1993 to 88.66 percent in 2001. As a result of the 2008 international recession, that percentage fell to 79.25 percent and then increased again to 82.78 percent in 2013. It is worth mentioning that in that year, the share of total exports within gdp was 36.95 percent, showing the importance of exports for the Mexican economy’s performance (Table 1).
However, beyond the acclaimed success of manufacturing exports (Zabludovsky, 2005), it is important to underline several shortcomings of the economic growth model based on manufacturing exports adopted in the Mexican economy. In the first place, the rapid growth of manufacturing exports has not been able to change the Mexican economy’s uninterrupted manufacturing trade deficit. As seen in Graph 6, the trade balance of the manufacturing sector showed a deficit of US$19.064 billion in 1993, one year before nafta was signed. After 20 years, the manufacturing sector trade balance deficit continues: in 2013 it came to US$12.045 billion.
 (Millions of USD)")
Mexico: Manufacturing Sector Trade Balance (1993–2013) (Millions of USD)
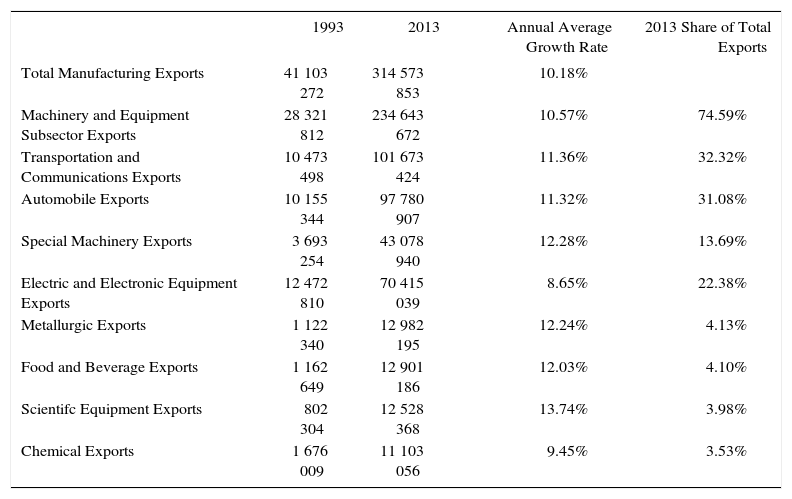
A second aspect of the Mexican trade in manufactured goods has to do with the uneven dynamics of the exports of manufactures. Only a few manufacturing activities account for the bulk of all manufacturing exports. Among those, the machinery and equipment manufacturing sector expanded rapidly between 1993 to 2013, at a 10.57-percent annual average growth rate, representing 74.59 percent of total manufacturing exports in 2013 (Table 2). Specifically, automobile exports represented 31.08 percent of total exports. Another important manufacturing activity that has exhibited accelerated growth has been the electric and electronic equipment, which grew an average of 8.65 percent a year in the same period, with a 22.38-percent share of total exports. Other manufacturing exports that stand out, though to a lesser extent, are metallurgic exports, food and beverages, and chemical products.
Major Mexican Manufacturing Exports (Thousands of USD)
| 1993 | 2013 | Annual Average Growth Rate | 2013 Share of Total Exports | |
|---|---|---|---|---|
| Total Manufacturing Exports | 41 103 272 | 314 573 853 | 10.18% | |
| Machinery and Equipment Subsector Exports | 28 321 812 | 234 643 672 | 10.57% | 74.59% |
| Transportation and Communications Exports | 10 473 498 | 101 673 424 | 11.36% | 32.32% |
| Automobile Exports | 10 155 344 | 97 780 907 | 11.32% | 31.08% |
| Special Machinery Exports | 3 693 254 | 43 078 940 | 12.28% | 13.69% |
| Electric and Electronic Equipment Exports | 12 472 810 | 70 415 039 | 8.65% | 22.38% |
| Metallurgic Exports | 1 122 340 | 12 982 195 | 12.24% | 4.13% |
| Food and Beverage Exports | 1 162 649 | 12 901 186 | 12.03% | 4.10% |
| Scientifc Equipment Exports | 802 304 | 12 528 368 | 13.74% | 3.98% |
| Chemical Exports | 1 676 009 | 11 103 056 | 9.45% | 3.53% |
Therefore, it can be clearly stated that the dynamics of Mexican manufacturing exports are characterized by a strong concentration of exports in a very small number of manufactures. If we consider, as mentioned previously, that Mexican exports mainly go to the U.S., it can be concluded that Mexican manufacturing exports depend on the dynamics of the U.S. economy. This characteristic of Mexican manufacturing reflects this sector’s high dependency on a single foreign market and the lack of diversification that significantly reduces its capacity to handle the recessionary shocks of the U.S. economy, as observed in the last economic recession of 2008 and 2009.
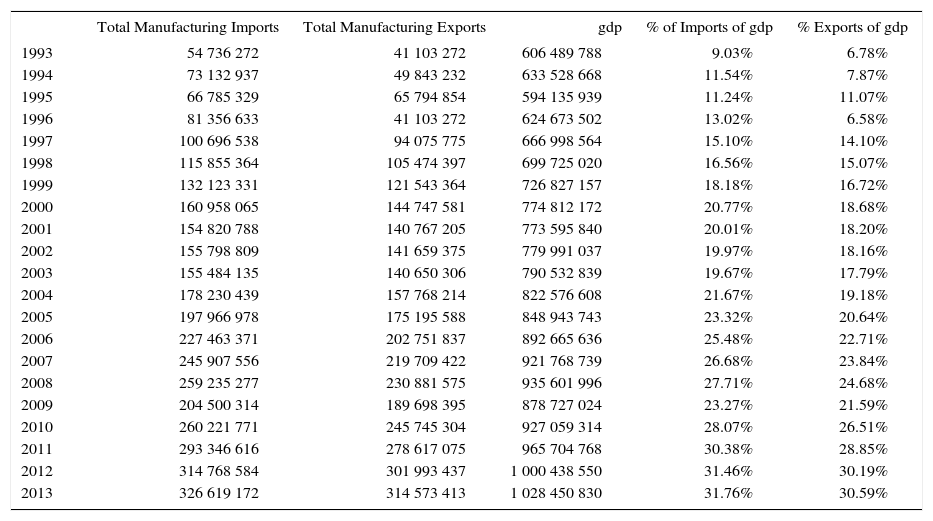
A third characteristic of trade in Mexican manufactures is related to manufacturing imports. The Mexican manufacturing sector has shown steady growth in imports, which has been even more important than the expansion of manufacturing exports. In 1993, manufacturing imports as a share of gdp was 9.03 percent, and by 2013, it had increased to 31.76 percent, which was higher than the 30.59-percent share of exports vis-à-visgdp (Table 3). As a result, throughout the 20 years of nafta, the manufacturing sector has been characterized not only by a rapid expansion of manufacturing exports but also an even greater increase in manufacturing imports.
Mexican Manufacturing Exports and Imports (Thousands of USD)
| Total Manufacturing Imports | Total Manufacturing Exports | gdp | % of Imports of gdp | % Exports of gdp | |
|---|---|---|---|---|---|
| 1993 | 54 736 272 | 41 103 272 | 606 489 788 | 9.03% | 6.78% |
| 1994 | 73 132 937 | 49 843 232 | 633 528 668 | 11.54% | 7.87% |
| 1995 | 66 785 329 | 65 794 854 | 594 135 939 | 11.24% | 11.07% |
| 1996 | 81 356 633 | 41 103 272 | 624 673 502 | 13.02% | 6.58% |
| 1997 | 100 696 538 | 94 075 775 | 666 998 564 | 15.10% | 14.10% |
| 1998 | 115 855 364 | 105 474 397 | 699 725 020 | 16.56% | 15.07% |
| 1999 | 132 123 331 | 121 543 364 | 726 827 157 | 18.18% | 16.72% |
| 2000 | 160 958 065 | 144 747 581 | 774 812 172 | 20.77% | 18.68% |
| 2001 | 154 820 788 | 140 767 205 | 773 595 840 | 20.01% | 18.20% |
| 2002 | 155 798 809 | 141 659 375 | 779 991 037 | 19.97% | 18.16% |
| 2003 | 155 484 135 | 140 650 306 | 790 532 839 | 19.67% | 17.79% |
| 2004 | 178 230 439 | 157 768 214 | 822 576 608 | 21.67% | 19.18% |
| 2005 | 197 966 978 | 175 195 588 | 848 943 743 | 23.32% | 20.64% |
| 2006 | 227 463 371 | 202 751 837 | 892 665 636 | 25.48% | 22.71% |
| 2007 | 245 907 556 | 219 709 422 | 921 768 739 | 26.68% | 23.84% |
| 2008 | 259 235 277 | 230 881 575 | 935 601 996 | 27.71% | 24.68% |
| 2009 | 204 500 314 | 189 698 395 | 878 727 024 | 23.27% | 21.59% |
| 2010 | 260 221 771 | 245 745 304 | 927 059 314 | 28.07% | 26.51% |
| 2011 | 293 346 616 | 278 617 075 | 965 704 768 | 30.38% | 28.85% |
| 2012 | 314 768 584 | 301 993 437 | 1 000 438 550 | 31.46% | 30.19% |
| 2013 | 326 619 172 | 314 573 413 | 1 028 450 830 | 31.76% | 30.59% |
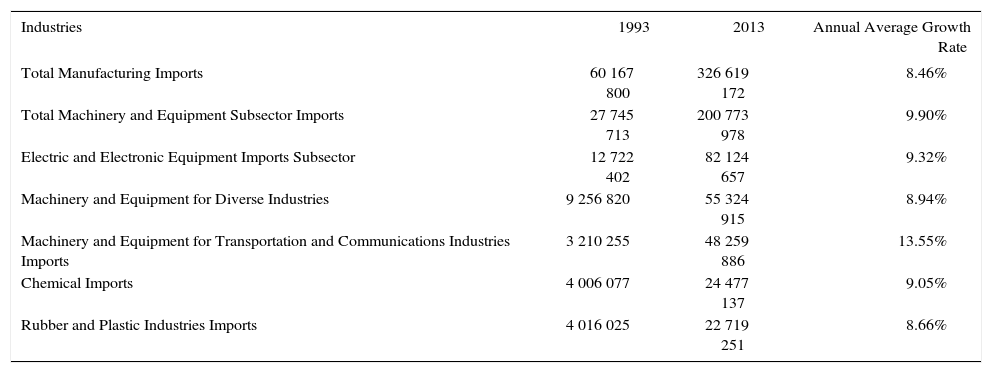
The average rate of growth of Mexican manufacturing imports was 8.46 percent between 1993 and 2013. The import subsector that experienced the highest annual average growth rate was the machinery and equipment, with 9.90 percent. Within this subsector, the manufacturing activities that displayed the highest rates of growth in the period were machinery and equipment for transportation and communications, at 13.55 percent (Table 4). Another industry that showed rapidly increasing imports was that of electric and electronic equipment.
Mexico’s Major Manufacturing Imports (Thousands of USD)
| Industries | 1993 | 2013 | Annual Average Growth Rate |
|---|---|---|---|
| Total Manufacturing Imports | 60 167 800 | 326 619 172 | 8.46% |
| Total Machinery and Equipment Subsector Imports | 27 745 713 | 200 773 978 | 9.90% |
| Electric and Electronic Equipment Imports Subsector | 12 722 402 | 82 124 657 | 9.32% |
| Machinery and Equipment for Diverse Industries | 9 256 820 | 55 324 915 | 8.94% |
| Machinery and Equipment for Transportation and Communications Industries Imports | 3 210 255 | 48 259 886 | 13.55% |
| Chemical Imports | 4 006 077 | 24 477 137 | 9.05% |
| Rubber and Plastic Industries Imports | 4 016 025 | 22 719 251 | 8.66% |
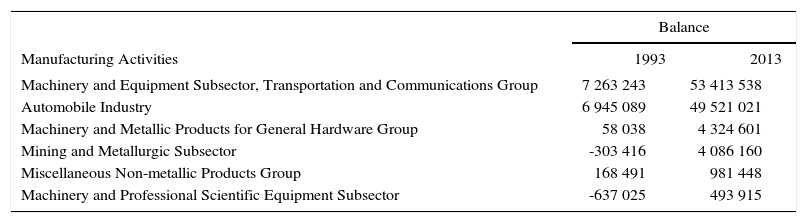
A fourth aspect of Mexican manufacturing trade involves the varying results of the trade balance for the different manufacturing activities. On the one hand, the manufacturing activities with a positive trade balance between 1993 and 2013 were those related to the machinery and equipment subsector. Specifically, the transportation and communications activities experienced an important increase in their trade surplus, from US$7.26 billion in 1993 to US$53.41 billion in 2013. The manufacturing activity that was the driving force behind the accelerated expansion was the automobile industry, which in 2013 had a trade surplus of US$49.52 billion (Table 5).
Main Mexican Manufacturing Activities with Trade Surplus (1993–2003, Thousands of USD)
| Balance | ||
|---|---|---|
| Manufacturing Activities | 1993 | 2013 |
| Machinery and Equipment Subsector, Transportation and Communications Group | 7 263 243 | 53 413 538 |
| Automobile Industry | 6 945 089 | 49 521 021 |
| Machinery and Metallic Products for General Hardware Group | 58 038 | 4 324 601 |
| Mining and Metallurgic Subsector | -303 416 | 4 086 160 |
| Miscellaneous Non-metallic Products Group | 168 491 | 981 448 |
| Machinery and Professional Scientific Equipment Subsector | -637 025 | 493 915 |
Other manufactures that showed a trade surplus, though to a less significant degree, were machinery and metallic products, general hardware products, the mining and metallurgic sector, and machinery and professional and scientific equipment. Therefore, we can conclude that only a few manufacturing activities were successful in increasing their exports more than the amount of imports related to those activities.
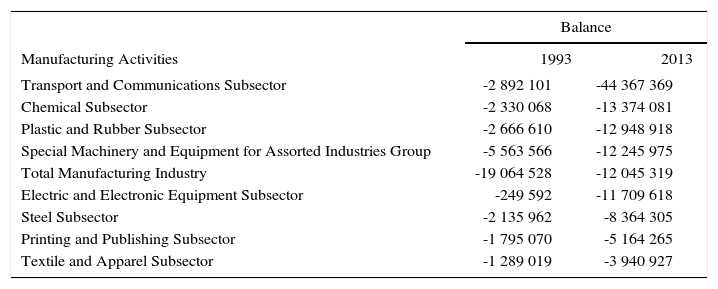
On the other hand, most Mexican manufacturing activities showed a constant and increasing trade deficit from 1993 to 2013. Among the manufacturing activities that exhibited higher trade deficits in that period were the transport and communications subsector, whose trade deficit increased from US$2.89 billion to US$44.37 billion, with an average annual rate of 13.65 percent, and the chemical subsector, which increased from US$23.30 billion to US$13.37 billion (Table 6). Other manufacturing industries that exhibited trade deficits are plastic and rubber, electric and electronic equipment, steel, printing and publishing, and textiles and apparel.
Main Mexican Manufacturing Activities with Trade Deficit (1993–2003, Thousands of USD)
| Balance | ||
|---|---|---|
| Manufacturing Activities | 1993 | 2013 |
| Transport and Communications Subsector | -2 892 101 | -44 367 369 |
| Chemical Subsector | -2 330 068 | -13 374 081 |
| Plastic and Rubber Subsector | -2 666 610 | -12 948 918 |
| Special Machinery and Equipment for Assorted Industries Group | -5 563 566 | -12 245 975 |
| Total Manufacturing Industry | -19 064 528 | -12 045 319 |
| Electric and Electronic Equipment Subsector | -249 592 | -11 709 618 |
| Steel Subsector | -2 135 962 | -8 364 305 |
| Printing and Publishing Subsector | -1 795 070 | -5 164 265 |
| Textile and Apparel Subsector | -1 289 019 | -3 940 927 |
Therefore, we can conclude that, on the positive side, after 20 years of nafta Mexico has succeeded in increasing manufacturing exports, but, on the negative side, they have been concentrated in a few sectors, while manufacturing imports have increased over all manufacturing activities. Therefore, as a whole, Mexico’s manufacturing sector trade deficit reveals its inability to develop more balanced growth expansion as well as to be less dependent on the U.S. market.
Vertical Integration, the Auto Industry, And Mexican Manufacturing ExportsThe expansion of the maquiladora industry during the 1990s has been well documented (Moreno-Brid, Santamaría, and Rivas, 2005). The accelerated growth of Mexican manufactures was linked to the development of supply chains and their importance in the competition in global markets for low-cost intermediate inputs. About 50 percent of the volume of Mexico’s manufacturing exports has been produced by the assembly plants (maquiladoras), which import intermediate inputs from abroad and, then, after assembling intermediate and final goods, export them back to the U.S. (Hanson, 2010).
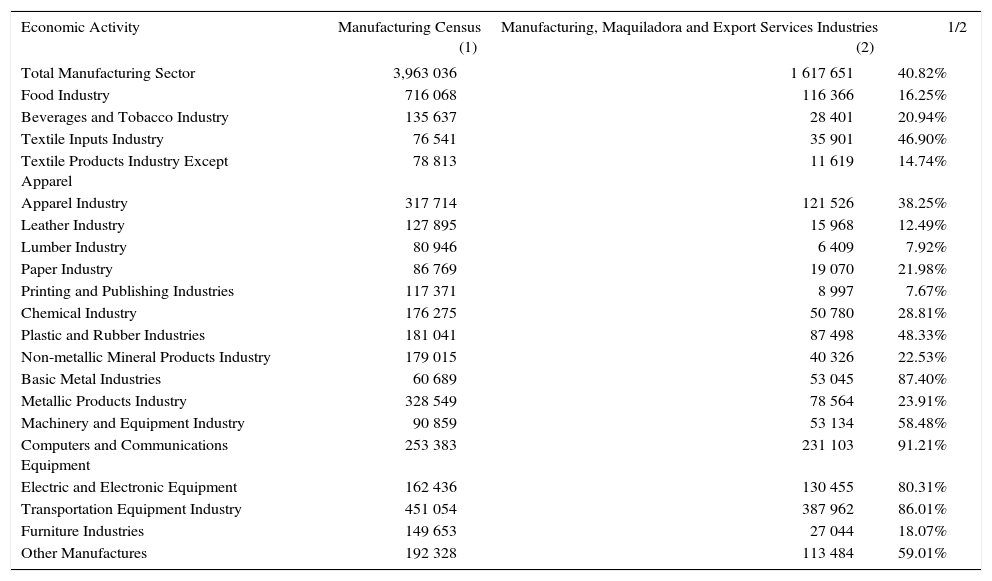
An important share of the trade between Mexico and the U.S. occurs within vertical integration chains, where inputs from the U.S. are transformed in Mexico and re-exported to the U.S. (Kose, Meredith, and Towe, 2004). Therefore, supply chains related to the automobile, electronics, and machinery industries have played a major role in the expansion of Mexican foreign trade ever since the 1990s. Based on information from the Manufacturing Census of 2009 for the manufacturing sector and from statistics of the Manufacturing, Maquiladora and Export Services Industries, I estimated the maquiladora and exporting industries’ share of the total manufacturing. The results showed that employment in maquiladora and exporting industries represented 40.82 percent of all employment in manufacturing (Table 7). Additionally, the estimations for the different manufacturing industries corroborate the importance of vertical integration for Mexico’s manufacturing exports.
Total Employment in the Manufacturing Sector and the Maquiladora Export Industry (2009)
| Economic Activity | Manufacturing Census (1) | Manufacturing, Maquiladora and Export Services Industries (2) | 1/2 |
|---|---|---|---|
| Total Manufacturing Sector | 3,963 036 | 1 617 651 | 40.82% |
| Food Industry | 716 068 | 116 366 | 16.25% |
| Beverages and Tobacco Industry | 135 637 | 28 401 | 20.94% |
| Textile Inputs Industry | 76 541 | 35 901 | 46.90% |
| Textile Products Industry Except Apparel | 78 813 | 11 619 | 14.74% |
| Apparel Industry | 317 714 | 121 526 | 38.25% |
| Leather Industry | 127 895 | 15 968 | 12.49% |
| Lumber Industry | 80 946 | 6 409 | 7.92% |
| Paper Industry | 86 769 | 19 070 | 21.98% |
| Printing and Publishing Industries | 117 371 | 8 997 | 7.67% |
| Chemical Industry | 176 275 | 50 780 | 28.81% |
| Plastic and Rubber Industries | 181 041 | 87 498 | 48.33% |
| Non-metallic Mineral Products Industry | 179 015 | 40 326 | 22.53% |
| Basic Metal Industries | 60 689 | 53 045 | 87.40% |
| Metallic Products Industry | 328 549 | 78 564 | 23.91% |
| Machinery and Equipment Industry | 90 859 | 53 134 | 58.48% |
| Computers and Communications Equipment | 253 383 | 231 103 | 91.21% |
| Electric and Electronic Equipment | 162 436 | 130 455 | 80.31% |
| Transportation Equipment Industry | 451 054 | 387 962 | 86.01% |
| Furniture Industries | 149 653 | 27 044 | 18.07% |
| Other Manufactures | 192 328 | 113 484 | 59.01% |
On one hand, production of manufactures for the domestic market, such as those from the food, beverage, and lumber industries, was carried out in large part in non-exporting plants. Only 7.92 percent, 16.25 percent, and 20.94 percent, respectively, of the labor force was working on exporting activities in the lumber and food and beverage industries. On the other hand, the aforementioned principal manufacturing exporting industries represented a large share of manufacturing industry workers. This is the case of computers and communications equipment, with 91.21 percent of jobs, followed by the basic metal industry with 87.40 percent, transportation and equipment, with 86.01 percent, and electric and electronic equipment, with 80.31 percent. We can conclude that an important proportion of manufacturing activity was concentrated in exporting industries and that the chief export industries were part of the vertical integration strategies of multinational corporations looking to reduce labor and transportation costs.
Additionally, the content of Mexican imports is concentrated in intermediate inputs between 1993 and 2013, increasing slightly to around 75 percent of total imports (Graph 7). The structure of imports reflects the importance of vertical integration to the dynamics of manufacturing exports and defines the characteristics of the expansion of that economic sector in Mexico.
")
Mexican Imports by Type of Goods (1993–2013)
In particular, the establishment of nafta played an important role in the integration of the auto industry in North America which had already started to develop with the initial bilateral trade agreement between Canada and the U.S. in 1987. The gradual elimination of tariffs and non-tariff barriers and the protection of foreign direct investment (fdi) and intellectual property rights allowed faster development of vertical integration, particularly in Mexico’s automobile and auto parts manufacturing industries. Therefore, beginning in 1994, the Mexican government decided to modify its industrial policy for the automotive sector by reducing its commercial protection and deregulating it to promote specialization and exports of automotive manufactures (Vega, 2014). This promotion of the auto industry allowed trade in Mexican manufactured goods to benefit from nafta. Auto industry trade between the U.S. and nafta members over the last 20 years shows that U.S. imports within that sector represents twice the value of its exports (Hufbauer, Cimino, and Moran, 2014).
From the end of the 1980s until 2002, Mexico’s auto industry expanded under the umbrella of the global competition generated by both the foreign and U.S. automotive companies operating north of the border. As a result of the increasing loss of the U.S. auto market, the “Big Three” companies in the U.S. (General Motors, Ford, and Chrysler) launched new strategies by shifting production lines to Mexico and developing new models, such as sport utility vehicles and minivans, which allowed them to compete internationally.
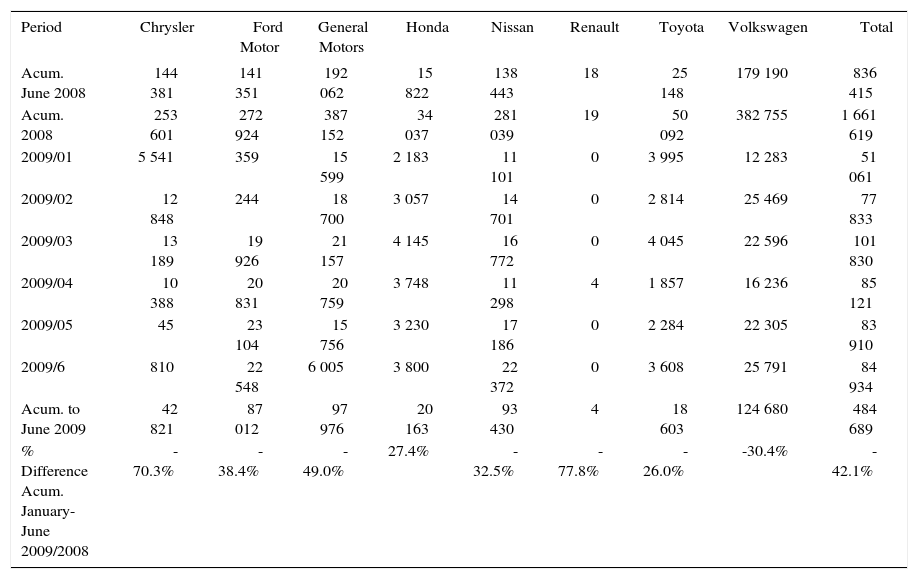
However, beginning in the second half of 2007, automobile imports from Mexico and Canada began to drop, a trend that continued through 2008 and deepened in 2009. The data on automotive exports by firms located in Mexico showed that the U.S. Big Three experienced a sharp decrease in exports. As shown in the Table 8, Chrysler and General Motors plants located in Mexico reflected the bankruptcy and financial restructuring taking place in the company’s U.S. headquarters, both of which exhibited a drastic drop in exports accumulated between June 2008 and June 2009, respectively. These two companies were followed by Ford Motors, with a fall of 38.4 percent and, to a lesser extent, by other companies of different national origins such as Renault, Nissan, Volkswagen, and Honda.
Automobile Exports by Automotive Companies Located in Mexico (2008–2009)
| Period | Chrysler | Ford Motor | General Motors | Honda | Nissan | Renault | Toyota | Volkswagen | Total |
|---|---|---|---|---|---|---|---|---|---|
| Acum. June 2008 | 144 381 | 141 351 | 192 062 | 15 822 | 138 443 | 18 | 25 148 | 179 190 | 836 415 |
| Acum. 2008 | 253 601 | 272 924 | 387 152 | 34 037 | 281 039 | 19 | 50 092 | 382 755 | 1 661 619 |
| 2009/01 | 5 541 | 359 | 15 599 | 2 183 | 11 101 | 0 | 3 995 | 12 283 | 51 061 |
| 2009/02 | 12 848 | 244 | 18 700 | 3 057 | 14 701 | 0 | 2 814 | 25 469 | 77 833 |
| 2009/03 | 13 189 | 19 926 | 21 157 | 4 145 | 16 772 | 0 | 4 045 | 22 596 | 101 830 |
| 2009/04 | 10 388 | 20 831 | 20 759 | 3 748 | 11 298 | 4 | 1 857 | 16 236 | 85 121 |
| 2009/05 | 45 | 23 104 | 15 756 | 3 230 | 17 186 | 0 | 2 284 | 22 305 | 83 910 |
| 2009/6 | 810 | 22 548 | 6 005 | 3 800 | 22 372 | 0 | 3 608 | 25 791 | 84 934 |
| Acum. to June 2009 | 42 821 | 87 012 | 97 976 | 20 163 | 93 430 | 4 | 18 603 | 124 680 | 484 689 |
| % Difference Acum. January- June 2009/2008 | -70.3% | -38.4% | -49.0% | 27.4% | -32.5% | -77.8% | -26.0% | -30.4% | -42.1% |
All of this revealed that, although the crisis of the automotive industry was a problem related to the international economic recession, the U.S. car companies were the ones that experienced the most severe contraction in Mexico, therefore demonstrating the negative side of the integration of the manufacturing sector achieved by nafta.
China, nafta’s Uninvited Guest, And Disequilibrium in Manufacturing TradeThe presence and interaction of China in the North American region has increased considerably since the 1990s. That has impacted all three nafta members’ economies both domestically and in their economic and trade relations. As a result, the increasing trade between China and the U.S. and Mexico has changed the characteristics of the trading patterns developed by nafta. The presence of China has had two important impacts on Mexico’s trade in manufactured goods: the first has to do with China’s growing competition in the U.S. market for manufactured goods, and the second involves the increase in the imports of manufactured goods from China to Mexico.
China and the U.S. Market For Mexican ManufacturesWith respect to the loss of some of the U.S. market share for Mexican manufactures, it is important to consider that the Mexican economy has not been able to evolve from the exporting phase of export assembly manufactures to a phase of original brand production based on the in-country design of outputs. Mexico’s manufacturing sector has developed into an industry that assembles automobiles, auto-parts, and electronics based on labor-intensive processes oriented toward exporting inputs to the U.S. (Hanson, 1998). This has put Mexico in the position of trying to compete with China for the U.S. market for manufacturing imports.
Between 2005 and 2010, total Chinese exports to the world increased at an average of 13.9 percent a year, which posed obstacles for the future growth of Mexican manufacturing exports. In particular, the rapid penetration of the U.S. market by Chinese manufacturing exports had a negative effect on the growth prospects of Mexican manufacturing exports to the U.S. Between 1990 and 2006, the average growth rate for Chinese exports to the U.S. valued in dollars reached 14.4 percent, while Mexican exports increased by 9.6 percent. As a consequence, since the beginning of 2003, exports from China to the U.S. have shown a greater value than the ones from Mexico (U.S. Census Bureau, 2010).
In the year 2000, Chinese exports to the U.S. represented 8.2 percent of total U.S. imports; but by 2012, that share increased to 18.7 percent. On the other hand, Mexican exports, which represented 11.2 percent of total U.S. imports in 2000, barely increased their share to 12.2 percent in 2012 (Graph 8). The types of Chinese products that have gained the advantage over Mexican exports are manufactured goods, such as generators, transformers, electrical equipment, computers, telecommunications, and metallic products (Comtrade, 2015).

China and Mexico’s Share of Total U.S. Imports
On the other hand, Mexican exports that have either maintained or increased their share include passenger vehicles, televisions, and fruits and vegetables. Therefore, we can conclude that Mexican exports have ceased to compete with similar exports from China in certain important manufacturing activities, although they have maintained an important share in the manufacturing activities related to the automobile industry and the agricultural sector, where localization advantages still exist that reduce transportation costs.
China and Mexico’s Trade and Current Account BalancesAs mentioned above, trade relations between China and Mexico have intensified since the 1990s. One of the main features of the trade between these two economies is Mexico’s sustained and increasing trade deficit. Between 1999 and 2012, the trade deficit increased from US$791 million to US$27.52 billion and became the most important source of Mexico’s foreign exchange outflows.
It should be mentioned that the increasing Mexican imports from China have concentrated mainly in manufactured goods. In particular, the Chinese exports that accounted for the highest value were electric and electronic equipment, nuclear reactors, machinery, optical and medical equipment, plastics, and iron and steel. Therefore, the composition of Mexican imports from China provides evidence of that economy’s importance in trade in manufactured goods manufacturing in the nafta region. The Mexican economy’s high dependency on manufactured goods from China, particularly intermediate and final goods, suggests that the functioning of the flows of trade among the nafta economies now also depends on China’s participation.
Additionally, it is important to underline that the Mexican economy shows a surplus trade balance with the U.S., Mexico’s most important trade partner in nafta, as well as with most of the economies in North and South America. In fact, in 2012, the Mexican economy had a US$102.73-billion trade surplus with the U.S., US$11.48 billion with South America, and US$1.42 billion with Central America (Banco de México, 2014). However, on the other hand, the Asian economies also had large trade surpluses with Mexico. In particular, the two Asian economies with the largest trade surplus with Mexico are China and Japan. The Chinese economy had a surplus of US$51.22 billion followed by Japan, with US$15.04 billion.
ConclusionsMexican foreign trade expanded in the 1980s and 1990s as a result of Mexican economic liberalization policies and also due to the positive effect of becoming a member of nafta. The dynamics of Mexican foreign trade are characterized by a large concentration of exports and imports to and from the U.S. and, to much lesser extent, to and from Canada, the other member of the trade agreement.
We can conclude that the most distinctive aspect of this trade expansion was the accelerated growth of manufacturing exports, which allowed a sustained trade surplus vis-à-vis the U.S., Mexico’s main trade partner. Also, as a result of U.S. American fdi growth in Mexico, combined with the trade expansion, a synchronization of the highly volatile Mexican business cycle to that of the U.S. economy has taken place, making the former dependent on the dynamics of the latter.
Additionally, several aspects of Mexico’s economic integration with the United States stand out. In the first place, the Mexican economy has suffered a chronic trade deficit in the manufacturing sector that, despite rapid exports growth, has continued even after the implementation of nafta. Secondly, another characteristic of Mexican trade is that manufacturing exports are concentrated in a few manufactured goods, mainly oriented to the U.S. market: intermediate inputs and final assembled goods from the transportation and electric and electronic manufacturing sectors.
It is also important to consider that not only have manufacturing sector exports increased, but also that manufacturing imports have grown significantly, and at an even faster pace than exports. As a result, the share of total manufacturing imports increased three times from 1993 to 2013, reaching around 30 percent of gdp. Therefore, it is important to be cautious about the successful export expansion. Although the recurrent trade deficit for the Mexican manufacturing sector has dropped, imports are still an important determinant of Mexican trade and current account deficits.
Another relevant feature of Mexican trade in manufactured goods is that only a few manufacturing activities exhibited a trade surplus, most related to transportation and equipment, and mining and metallurgic industries. However, a number of manufacturing activities displayed important trade deficits, particularly plastics and rubber, electric and electronic equipment, printing, and textiles and apparel. These primarily make up the manufacturing industries oriented to producing goods for the domestic market and inputs for the exporting industries.
Under nafta, the manufacturing sector has been successful in increasing production in the automotive industries. Thus, its achievements have been concentrated and have not reduced the trade deficit, while manufacturing imports have broadened to encompass the majority of manufacturing activities. It has been documented that the dynamics of the exporting manufacturing activities respond to multinational corporations’ vertical integration strategies. As a result, the structure of imports for Mexican foreign trade is concentrated in intermediate inputs that have been a factor in the manufacturing sector’s sustained trade deficit.
One of the consequences of the growth pattern of Mexican trade in manufactures has been that the manufacturing activities related to the automotive industries, and therefore to the North American automobile corporations and firms producing intermediate inputs and auto-parts in Mexico, experienced high dependency on the U.S. business cycle. This dependency of Mexico’s most dynamic manufacturing industries demonstrates the fragility and highly volatile behavior of the country’s manufacturing export sector.
The increasing exports of consumer and intermediate manufactured goods and the slowing of Mexican exports to the U.S. market are closely related to the growing presence of the Chinese economy, both in the U.S. and the Mexican manufacturing markets. The emergence of China has brought about two important effects on Mexican trade in manufactured goods. The first impact involves the negative effect of Chinese exports on Mexico’s exports to the U.S. market. In large part, Chinese exports to the U.S. market are characterized by being labor-intensive and with low- or medium-level technology, thus competing with those from Mexico. As a result, Mexican exports have consistently been losing their U.S. market share in goods such as electrical equipment, computers, and telecommunications.
Finally, Chinese exports have also taken an important share of the Mexican market in that Mexican manufacturing imports from China have been increasing. As a result, the most important source of Mexico’s trade deficit is caused by trade with China; so much so that the Chinese economy could be considered an important unofficial member of nafta. For Mexico, these changes have not modified the manufacturing sector’s high reliance on intermediate and capital imports; therefore, perspectives for the Mexican manufacturing sector seem to be relatively stagnant and dependent on the U.S. market, while under constant pressure from Chinese competition. This scenario suggests that the nafta growth model, based on manufacturing exports to the U.S. market, has reached a state of relative exhaustion.
We can therefore conclude that the pattern of trade initially encouraged by nafta, which consisted of Mexican manufactures using low-skilled labor and assembly exports to the U.S. and the importation of capital and intermediate and consumer goods from that economy, has been affected by Chinese exports to North America. Consequently, patterns of trade in manufactured goods in North America have been altered, and a different pattern is emerging, one which limits the possibilities for the expansion of Mexican manufactures, particularly consumer goods oriented to both its domestic and the U.S. markets.