


This study documents the experiences and identities of undocumented Spanish-speaking migrants in Georgia vis-à-vis their counterparts who have legal status. Structured interviews were used to collect data from 127 adults (49 percent undocumented at their time of arrival and 38 percent undocumented at the time of data collection) regarding their experience of discrimination, utilization of services, identity preferences, mental health, and beliefs in five domains: vulnerability, injustice, distrust, superiority, and helplessness. Significant immigration status differences emerged for education, income, utilization of some city services, and a few of the belief scales. However, the documented and undocumented samples were more similar than different.
Este estudio documenta las experiencias e identidades de migrantes indocumentados de habla hispana en Georgia vis-à-vis sus contrapartes que tienen un estatus legal. Se utilizaron entrevistas estructuradas para recopilar información de 127 adultos (el 49 por ciento indocumentados en el momento de su arribo y el 38 por ciento indocumentados a la hora de la recopilación de la información) acerca de su experiencia de discriminación, la utilización de servicios, sus preferencias de identidad, su salud mental y sus opiniones en cinco ámbitos: vulnerabilidad, injusticia, desconfianza, superioridad y desamparo. Resultan diferencias muy significativas para los distintos estatus migratorios en lo que concierne a escolaridad, ingreso, uso de algunos de los servicios públicos de la ciudad y en algunas de las escalas de creencias. Sin embargo, los resultados para aquellas personas con documentos y aquellas sin documentos fueron más similares que diferentes.
On the fiftieth anniversary of Martin Luther King, Jr.'s historic “I Have a Dream” speech, in which he spoke of his desire for a day when all U.S. Americans could peacefully coexist as equals, our society is still in many ways divided, not only by race, the primary focus of King's efforts, but also by immigration. For example, a recent Pew Hispanic Center review (2006) of 10 national surveys examining public opinion on immigration suggests that U.S. Americans are practically evenly divided on whether legal immigration is good or bad for the country and whether it should be kept at its present levels or decreased. Moreover, while the percentage of U.S. Americans who see immigration as a major problem has waxed and waned over the last decade (Jones, 2012), public opinion appears to be split across the usual political lines, with 19 percent of Republicans citing immigration as the single most important problem facing the nation (Suro and Escobar, 2006; Ceobanu and Escandell, 2010).
In this context, it is not surprising that undocumented immigration, a “lighting rod” issue in the United States since before the Civil Rights Movement, is by all accounts more controversial than ever. In addition to long-standing concerns about undercut wages and educational costs, many U.S. Americans are now also worried about the potential deleterious impact on public health and national security (Camarota, 2009; Chavez, 2008). Most of the debate, however, continues to center on the economic implications of undocumented migration, with many believing that reducing the numbers of undocumented residents would lower unemployment, increase wages, and lower taxes, while others argue that the labor performed by undocumented migrants, often in undesirable and low-paying jobs, is vital to the health of the U.S. economy (Van Hook, Bean, and Passel, 2005). Altogether, the public opinion polls indicate that 50 to 60 percent of U.S. Americans consider undocumented immigration to be a “very serious” problem and another 30 percent, a “somewhat serious” one (Pew Hispanic Center, 2006).
Notably, economists tend to not share the public's concern. For example, in the mid-1980s, when immigration reform was widely debated and when the U.S. government granted legal status to large numbers of undocumented workers, public opinion polls showed that 84 percent of the public expressed concern about the number of illegal aliens in the country, and 79 percent supported penalties against businesses that hire illegal aliens (Harwood, 1986). In contrast, 74 percent of economists surveyed in 1985 believed that illegal immigration had a positive impact on the economy (Moore, 1986). In line with these findings, studies during that period showed that negative views about immigration generally decreased with higher income and education, suggesting that those who are less threatened economically and have greater expertise regarding immigration tend to have more favorable views about immigration's consequences (Moore, 1986).
That said, the contemporary demographic reality is vastly different from that of the mid-1980s in two important ways. For one, the undocumented population has increased from approximately 3.5 million in 1990, to 8.4 million in 2000, to over 11 million in 2011 (Passel and Cohn, 2011; Batalova and Lee, 2012). Secondly, whereas in 1990 nearly half of all unauthorized migrants lived in California and 80 percent lived in one of four traditional immigrant destinations (California, Texas, New York, and Florida), by the early 2000s those percentages dropped to 25 percent and 54 percent, respectively, with “new destination” states such as Georgia, North Carolina, Tennessee, and Arkansas all showing five– to six-fold growth since the 1990s (Massey, 2008; Lippard and Gallagher, 2011; Van Hook, Bean, and Passel, 2005). As a result, dozens of counties and many more municipalities are now for the first time grappling with the challenges of absorbing and integrating an immigrant community they view as culturally different and unfamiliar (Massey, 2008; Lippard and Gallagher, 2011; Odem and Lacy, 2009).
This is particularly evident in Georgia, where the percentage of foreign-born has increased almost 550 percent since 1990. According to the U.S. Census Bureau and recent reports, almost 400 000 immigrants entered the state of Georgia since 2000, and in 2011, 942 921 immigrants resided in Georgia, up from fewer than 175 000 in 1990 (Migration Policy Institute, 2011). Of this number, the majority (54 percent) arrived from Latin America, primarily from Mexico (29 percent). While the geographic origin of Georgia's foreign-born population mirrors that of the United States, what is notable about the migration to Georgia is that most of its immigrants are relatively recent arrivals, with 31 percent entering the country during the 1990s and an additional 43 percent arriving since 2000 (Migration Policy Institute, 2011). It is also noteworthy that, with an estimated 440 000, Georgia now ranks seventh among all states in the number of undocumented immigrants (Redmon, 2012; Associated Press, 2012). This number comprises approximately 45 percent of the state's foreign-born population, a percentage significantly higher than the 28-percent national average (Passel and Cohn, 2011; Immigration Policy Center, 2011).
Despite their relatively recent arrival (and disproportionate percentage with undocumented status), citizenship rates and English language fluency among immigrants in Georgia are generally comparable to national data. Specifically, just under 40 percent of Georgia's immigrants report having citizenship status compared with 42 percent of the foreign-born nationally, and 47 percent report having limited English proficiency, compared to 51 percent nationally (Migration Policy Institute, 2011). Furthermore, according to the American Community Survey, 29 percent of all Spanish-speaking households in Georgia are linguistically isolated, meaning that all persons age 14 and over in the household have limited English proficiency (Migration Policy Institute, 2011).
Notably, neither the lack of English fluency nor other obstacles to employment (for example, documentation) seem to be keeping Spanish-speaking migrants in Georgia out of the workforce. According to the Migration Policy Institute's 2011 report, 76 percent of those in Georgia who speak Spanish at home (this includes both native and foreign-born) are in the labor force, compared to 64 percent of those who speak only English and 70 percent of those who speak an Asian and Pacific Island language. While the exact percentage of undocumented residents who are employed is difficult to determine, most are assumed to be in the workforce, which, according to Pew estimates, is 5 percent undocumented (Immigration Policy Center, 2011).
Though probably employed at comparable rates, documented and undocumented immigrants still differ on a number of social and economic indicators. For example, the March 2004 Current Population Survey shows that undocumented immigrants are more likely to have less education, be employed in low-wage, low-skill jobs, and have a significantly lower average family income (US$27 400 in 2003) (Coffey, 2005; Passel and Cohn, 2009). More specifically, after controlling for education and type of occupation, Hall, Greenman, and Farkas (2010) found a 17-percent wage disparity between documented and undocumented Mexican immigrant men and a 9-percent disparity between documented and undocumented women. Moreover, even when they are able to overcome the legal and financial obstacles to higher education, undocumented Mexican immigrants have lower returns on education in comparison to their documented cohort (Martínez-Calderón, 2009).
Undocumented immigrants, like all citizens, are required to pay income tax, and numerous studies have shown a compliance rate from 50 to 70 percent for this population (Congress of the United States, 2007), which is estimated to contribute US$7 billion per year just into social security (Porter, 2005). Undocumented immigrants also pay sales and state income taxes. In Georgia, the average undocumented family contributes approximately US$2,400 in state and local sales, income, and property taxes, yielding US$215.6 million to US$252.5 million for Georgia's state and local coffers (Coffey, 2005; West, 2010). Also, unlike their documented counterparts, undocumented immigrants are restricted by federal law from the majority of services, including food stamps, social security, supplemental security income (ssi), full-scope Medicaid, Medicare Part A, and hud Public Housing and Section 8 programs. Generally, the only federal benefits authorized for undocumented immigrants are emergency medical care and elementary and secondary public education (Lipman, 2006). Overall, though the conclusions are disputed by anti-immigration groups such as the Center for Immigration Studies (see, for example, Camarota, 2004), the preponderance of empirical data indicate that “undocumented [immigrants] actually contribute more to public coffers in taxes than they cost is social services” (Lipman, 2006: 2).Data regarding the cost of these services in Georgia are not available, but, as in the nation as a whole, there is a common public perception that the costs far exceed the tax revenue generated by this population (Coffey, 2005).
Another difference between documented and undocumented immigrants has been their relative treatment in U.S. society. As suggested in public polls, undocumented Mexican immigrants are often the target of anti-immigrant sentiment (Chavez, 2008; Jaret, 1999). Lippard and Spann (forthcoming) found that undocumented Mexican immigrants reported facing higher rates of discrimination than documented immigrants in most Western North Carolina institutions, including public schools and health agencies. Undocumented respondents also reported more blatant and violent episodes of discrimination than their documented cohort. Similar findings have been reported in multiple other southern institutions and contexts (see Ansley and Shefner, 2009; Lippard and Gallagher, 2011; Massey, 2008; Odem and Lacy, 2009; Smith and Furuseth, 2006), as well as in national studies (Pew Hispanic Center, 2007). Notably, Wampler, Chávez, and Pedraza (2009) found that high levels of discrimination impacted the decisions of undocumented and documented to remain permanently in the United States, sometimes more so than actual documentation status.
Finally, levels of acculturative stress were different for documented and undocumented immigrants. As defined by Arbona et al. (2010: 364), acculturative stress refers to “the emotional reaction triggered by the individual's appraisal of specific events and circumstances in their lives” as associated to working and living in another country. Alba and Nee (2003) and Chavez (2008) noted that undocumented immigrants struggled more with assimilating into the U.S. mainstream than documented immigrants due to their inability to access programs and even the U.S. public sphere due to restrictive anti-immigrant laws. Arbona et al. (2010) found that undocumented immigrants reported higher levels of acculturative stress due to the separation of family, “traditionality,” and language difficulties in comparison to documented immigrants. However, notably the two groups reported similar levels of fear concerning deportation and government decisions about immigration policy.
Even though much of the above would suggest that foreign-born migrants, regardless of immigration status, are attempting to acculturate and positively contribute to U.S. society, anti-immigrant sentiment continues to grow in new destinations, particularly in the state of Georgia (Lippard and Gallagher, 2011). For example, a 2001 statewide survey in Georgia found that 25 percent equated rising crime rates in Georgia with immigration, almost 75 percent asserted that immigrants get too much public assistance, and large numbers clearly viewed undocumented Mexican immigrants as the culprits of resource shortages in public education and health (Neal and Bohon, 2003).
Not surprisingly, these public perceptions have had a meaningful influence on policy. In 2006, Georgia state Senator Chip Rogers introduced Senate Bill 529 in an effort to curtail illegal immigration in Georgia. Although there was staunch opposition to the bill, it passed in a “watered-down” version that encouraged police partnerships with Immigration and Customs Enforcement (Lippard and Gallagher, 2011). Five years later, in 2011, Georgia passed another immigration bill that mirrored Arizona's Senate Bill 1070, encouraging all Georgia law enforcement and public services to check the immigration status of people who they suspected as being undocumented.
Though economic fears were clearly salient in the context of the 2008 recession, it is doubtful that all of the tension around undocumented migration is based exclusively on perceived economic impact. Especially in the post 9/11 zeitgeist, questions of group identity and group loyalty (i.e., patriotism) weigh heavily on people's minds and make up a substantial portion of the anti-immigration –not to mention anti-undocumented migration– discourse (Chavez, 2008; Jacoby, 2004; Jaret, 1999). For instance, Bohon and Parrott (2011) found that the most circulated newspaper in Georgia, the Atlanta Journal-Constitution, grossly over-estimated the numbers of undocumented immigrants and ran several emotionally-charged anti-immigrant pieces. Moreover, the journalists for this paper used several rhetorical phrases (“anchor babies”) and biased word choices (“illegals”) to socially construct undocumented immigrants as a “social problem” in Georgia.
In this context, this study presents a comparison of the lived experiences of 127 undocumented (49 percent) and documented (51 percent) Spanish-speaking migrants in Georgia. Coming from an interdisciplinary standpoint utilizing psychology, political science, and sociology, we were particularly interested in determining the areas of convergence and divergence between documented and undocumented Spanish-speaking migrants within five areas of public interest: 1) demographic and immigration statuses (for example, education, income, reason for migration); 2) experiences of discrimination; 3) utilization of city services; 4) mental health; and 5) group identity, acculturation, and group-level beliefs. We engaged in this work in the hope that a better understanding of the subtle similarities and differences between these two groups may help native-born U.S. Americans in general and Georgians in particular bridge the chasm of distrust and alleviate some of the misperceptions that currently exist both in the new destination communities where these migrants reside and in the country as a whole.
Five Belief Domains: A Theoretical FrameworkEidelson and Eidelson (2003) identified five key belief domains that span the personal and group contexts because they are simultaneously fundamental to the daily and existential pursuits of individuals and pivotal to the central concerns and shared narratives of groups. These five domains revolve around issues of vulnerability, injustice, distrust, superiority, and helplessness. Each belief has been described in detail elsewhere (Eidelson and Eidelson, 2003), so here we offer only a brief description of its particular relevance for Spanish-speaking migrants in the United States today.
Vulnerability. The vulnerability belief, whether applied to one's personal world or to the circumstances of one's group, is characterized by the conviction that the world is a dangerous and risky place, where safety and security are difficult to obtain and catastrophic loss lurks on the horizon (for example, Beck, Emery, and Greenberg, 1985). Vulnerability-related concerns have been a centerpiece of the post-9/11 environment in the United States, finding expression in heightened perceptions of both personal and national threat (for example, Eidelson and Plummer, 2005; Huddy et al., 2002). At the same time, threat perception also likely plays a key role in the context of perceived group competition between immigrants and native-born U.S. Americans over employment and educational opportunities. From a different vulnerability perspective, worries about assimilation and the loss of group distinctiveness (for example, Brewer, 1991) also appear as important features of the contemporary immigrant narrative.
Injustice. The injustice belief is based on the individual's perceptions of being personally victimized and mistreated by others or the view that ingroup members receive undeserved, substandard, and unjust outcomes, perhaps due to a biased or rigged system created by a more powerful outgroup (for example, Horowitz, 1985). This injustice mindset is also frequently linked to a historical perspective that emphasizes past episodes or periods of abuse and exploitation at the hands of others, which certainly characterizes the history of Mexican migrants in the United States. Experiences and perceptions of mistreatment persist for many (Johnson, 1996; Hing, 2002).
Distrust. The distrust belief focuses on the presumed hostility and malicious intent of other individuals or other groups. In reference to the personal world, this mindset may range from a predisposition toward suspicion and anticipated deceit to, in the extreme, outright paranoia. At the group level, the conviction that outsiders harbor malevolent designs toward the ingroup is sufficiently widespread that “dishonest” and “untrustworthy” are considered central elements in the universal stereotype of outgroups (Campbell, 1967; LeVine and Campbell, 1972). In the U.S., heightened suspicion of non-U.S.-Americans has characterized the immediate post-9/11 environment. Similarly, many Mexican-Americans also view mainstream institutions with suspicion, including law enforcement and the judicial system (Correia, 2010; Marrow, 2011).
Superiority. The superiority belief revolves around the conviction that the individual or the ingroup is morally superior, chosen, entitled, or destined for greatness, and the corresponding view that others are contemptible, immoral, and inferior (for example, LeVine and Campbell, 1972). This belief has been used to explain, legitimize, and ruthlessly enforce ingroup status advantages (for example, Sidanius, 1993), often via political entrepreneurs' selective recounting of the ingroup's history and embellished narratives of accomplishments (for example, Brown, 1997). For the United States, the 9/11 terrorist attacks brought to the fore a national narrative describing a battle of “good versus evil” (for example, Eidelson and Plummer, 2005). At the racial level, this belief domain was central to the historical institution of slavery, built in part upon assumptions of white superiority and black inferiority. More recent decades have witnessed movements to overcome still-prevalent negative stereotypes, even as many “non-prejudiced” whites continue to endorse the belief that poverty and other forms of racial inequity exist in large part due to Mexican-Americans' cultural inferiority (Larsen et al., 2009; McClain et al., 2009).
Helplessness. Finally, the helplessness belief (for example, Abramson, Seligman, and Teasdale, 1978; Buchanan and Seligman, 1995) refers to the conviction that the individual or the ingroup is unable to favorably influence or control events and outcomes. This belief plays a prominent role in different types of group mobilization. Since an effective social movement is inherently risky and depends upon the promise of some reasonable likelihood of success (for example, Brewer and Brown, 1998; Gamson, 1992; Homer-Dixon, 1999), organized political mobilization is severely hampered –while extremist activity may be simultaneously facilitated– when group members perceive their ingroup as helpless to improve circumstances by working within the system. The nation's retaliatory military action in Afghanistan in response to the 9/11 attacks was viewed in part as a demonstration that the United States was not and would never be a helpless target (for example, Eidelson and Plummer, 2005). At the same time, helplessness may indeed be salient at the racial level for many undocumented immigrants, given that efforts to achieve legal status have faced significant obstacles (Hicks, 2012; Higgins, 2012).
Study HypothesesFocusing on the previously described areas of convergence and divergence between documented and undocumented Spanish-speaking migrants, the hypotheses of how this theoretical perspective may impact each of the five areas of interest are listed below.
Demographics and status. Based on previous research with undocumented migrants (for example, Coffey, 2005), we expected legal immigrants to have significantly higher education and income but otherwise be virtually indistinguishable from their undocumented counterparts in terms of their reason for leaving their country of origin, reason for migrating to Georgia, length of time in the United States, and religiosity.
Experiences of discrimination. Because we are relying on subjective perceptions of discrimination that might be operationalized differently based on immigration status, it was difficult to predict which immigration status would be associated with greater discrimination. For example, a question from an employer regarding immigration status may be perceived as unfair (and, therefore, discriminatory) by a U.S. citizen but not by an undocumented migrant who expects to have to provide such documentation. Nevertheless, because immigration status is not readily apparent from one's appearance, we predicted that there would be few immigration status differences regarding perceived discrimination overall, but that such differences would emerge in particular domains such as when seeking employment.
Service utilization. Based on federal law banning undocumented migrants from having access to many services, including non-emergency healthcare, we expected significant immigration status differences across a wide range of social and medical services, including a much greater reluctance on the part of undocumented migrants to call the police and paramedics.
Mental health. The relationship between migration and acculturative stress is well documented (see, for example, Berry et al., 1987), as is the role of stress in the etiology of many psychological disorders, including depression and suicidality (Hovey and King, 1996; Salgado de Snyder, 1987). On the basis of this research, we expected both legal and undocumented migrants to have elevated levels of psychological symptoms, but given the various extra stressors associated with undocumented status, we expected undocumented migrants to report higher levels of mental health symptoms than those with legal status.
Group identity, acculturation, and group-level beliefs. Although research on social comparison and the person-group discrepancy effect (for example, Festinger, 1954; Postmes et al., 1999) suggests that group differences based on personal identity might be muted (if legal and undocumented respondents evaluated their circumstances primarily in comparison to their own fellow ingroup members), given the precarious nature of their social status and the need to avoid contact with authorities, we expected undocumented respondents to report significant higher levels of personal vulnerability, injustice, distrust, and helplessness, as well as lower life satisfaction, in comparison to their counterparts with legal status. However, because beliefs regarding one's ethnic group are generally associated with the strength of ethnic identity, which we did not expect to vary as a function of immigration status, we expected few, if any, differences to emerge on any of the respondents' beliefs regarding their ethnic group. Similarly, since we did not expect strength of U.S. American identity to vary as a function of immigration status, we expected few immigration status differences to emerge on the beliefs regarding the United States, after controlling for the length of time in the country.
MethodsParticipants and ProcedureResearch participants were recruited during fall 2007 and spring 2008 from three communities in Georgia known for hosting industries that attracted immigrant labor (for example, carpet, poultry). All adult (over age 18) migrants born in a Latin American country were eligible to participate. Participants were recruited by Spanish-speaking social workers employed by Catholic Charities to provide services to this migrant group, which included both documented and undocumented residents. The social workers explicitly stated that this research project was in no way connected to any services rendered in the past and that future services would not be impacted or disrupted in any way on the basis of their participation or lack of participation.
Surveys were translated into Spanish and administered in interview format, generally lasting 30 to 45 minutes. All interviews were conducted by the same social workers who recruited the participants into the study and with whom the participants already had a trusting relationship. Because of the nature of this relationship, the migrants' immigration status was already known to the social workers, making inquiry into their status less threatening. All surveys were collected anonymously without any identifying information, preventing the researchers from having any knowledge about who participated. As compensation for participating, respondents received a US$5 gift certificate to Target.
Of the 127 participants, 47 percent were male and 53 percent were female. The age of respondents ranged from 18 to 60, with an average age of 31.8 years (SD=10.4). Over half of the respondents (55 percent) were married, while approximately 34 percent reported being single (never married). The remainder was either divorced (5 percent), widowed (2 percent) or separated from their partner (4 percent). The vast majority (82 percent) of the respondents were Catholic.
With the exception of two respondents, the entire sample was foreign-born. The length of time living in the United States since migration ranged from 3 months to 36 years, with an average length of 10.0 years (SD=7.7). The most common main reason respondents gave for immigrating to the United States was to stay with or rejoin family members (32 percent). Other common primary reasons for migration included better economic opportunity for self/spouse (23 percent) and to send money to family members in their country of origin (15 percent). Only three respondents reported push factors (that is, political instability in their country of origin) as a contributing factor in their decision to migrate to the United States. For a large portion, this decision is seen as temporary, with almost half (45 percent) reporting that they intended to remain in the United States no more than five years.
The respondents migrated primarily from Mexico (75 percent of those who reported their country of origin), with the remaining 25 percent came from eight other Central and South American countries, including Colombia, Costa Rica, Honduras, and Venezuela. The majority (67 percent) migrated directly from their country of origin, while 33 percent reported living in a different U.S. state prior to moving to Georgia. Respondents' primary reasons for migrating to Georgia were employment opportunities (40 percent) and to stay with or join family members (37 percent), although 9 percent also reported that prejudice in their previous place of residence factored in their decision. As was the case regarding intentions to remain in the country, 45 percent of respondents reported that they intended to remain in Georgia no more than five years. The very high correlation (r=.69) between these two variables (both assessed using an open-ended question) suggests that the migrants currently residing in Georgia generally do not have any intention of relocating to another U.S. state.
Almost half of the respondents (49 percent) reported being undocumented at the time of their arrival in the United States. Of the remainder, 18 percent had permanent resident status, 16 percent had a temporary work visa, and 9 percent a temporary student visa. At the time of the survey, 19 percent had gained citizenship and 26 percent were permanent residents. However, 38 percent were still undocumented. Of the undocumented portion of the sample, 42 percent reported having taken some steps to receive documentation. The undocumented portion of the sample (both at time of arrival and at time of data collection) did not significantly differ from their documented counterparts in gender, age, or time in the United States (all ps>.05). Education and income are discussed in the “Results” section.
MeasuresDemographics. The administered questionnaire included a series of demographic questions. Single-item questions asked the respondents about their age, gender, level of formal education (on a six-point scale from “no formal education” to “graduate work/advanced degree”), family income (on an six-point scale from “less than [US]$10 000” to “[US]$40 000 or more”), level of religiosity (on a five-point scale ranging from “Not at all religious” to “Extremely religious”), length of time in the United States, primary and secondary reasons for migration (both to the U.S. and to Georgia), and a series of questions about living arrangements (for example, number of rooms, who lives in the household).
Identity. A variety of different approaches were used to measure identity. These included having respondents rank-order their ethnic, pan-ethnic (that is, Latino), and U.S. American identities, having them select from a list of choices what each of these identities means to them (for example, “For me to be ‘Mexican’ means primarily to … a] share the group's culture, b] live in Mexico, c] belong to the Mexican people, or d] Speak Spanish”), and measuring their strength of identification with both their ethnic group and as U.S. “Americans.”
Strength of group identification was measured using six items (with five-point Likert-type scales ranging from Strongly Disagree to Strongly Agree) adapted from Brown et al. (1986). For the ethnic group identification scale these items read, “I identify with other members of my ethnic group,” “My ethnic group is important to my identity,” “I think of myself as a member of my ethnic group,” “I feel close to other members of my ethnic group,” “When someone criticizes my ethnic group, it feels like a personal insult,” and “When I talk about members of my ethnic group, I usually say ‘we’ rather than ‘they.’” For the U.S. “American” group identification scale, the phrase “ethnic group” was replaced by “American” in each item. Previous studies using these exact items have shown good internal reliability (alpha =.85) and predictive validity (Eidelson, 2009).
Acculturation. Several different scales were used to measure various aspects of the acculturation process. Language use, media language preference, and social network preference was measured with the 12-item Short Acculturation Scale for Hispanics (Marin et al., 1987). The first five questions were “language use” questions. The next three were “media preference” questions and the remaining four questions were “social network” questions. Scoring was done on a 5-point Likert scale, with one indicating an exclusively Latino acculturative style (for example, “only Spanish” or “only Latino”) and five indicating an exclusively English or Anglo use/preference. The Cronbach's alpha of the total scale was .92, with alphas of .90, .86, and .78 for the language items, the media preference items, and the social network items, respectively (Marin et al., 1987).
The Marginality Scale (scale 2) of the Acculturation Rating Scale for Mexican-Americans (arsma)-II (Cuellar, Arnold, and Maldonado, 1995) was used to measure respondents’ levels of marginalization from three different cultural groups: the ethnic group (for example, Mexicans), the ethnic-American group (for example, Mexican-Americans), and the host cultural group (for example, U.S. Americans). More specifically, the marginality scale allows participants to indicate how difficult it is to accept ideas, attitudes, customs, and behaviors associated with these three cultural groups. The marginality scale can be administered, scored, and interpreted independent of the rest of the arsma-II (Cuellar, Arnold, and Maldonado, 1995). The overall marginality scale has high internal consistency (alpha =.87) and one week test-retest reliability of .78 (Cuellar, Arnold, and Maldonado, 1995).
Discrimination. Discrimination frequency was measured using a single 7-point Likert item (0=“never”, 6=“several times per day”), in which respondents were asked to report how frequently they experienced discrimination as a result of their ethnic or racial status. Specific discriminatory situations were then assessed by using a series of 11 possible domains in which discrimination could take place (for example, looking for a job, being stopped by police) and asking respondents to check every domain in which they have experienced discrimination.
Service Utilization. Respondents' utilization of services was assessed with 25 separate questions regarding which of 10 different services (for example, general medical, dental, psychological, esl, banking) were used, how often they were used, how easy/difficult it was to obtain each service, how sympathetic/helpful the service providers were in each domain, and which service providers required which types of documentation.
Mental Health. The Center for Epidemiological Studies Depression Scale (ces-d) (Radloff, 1977) was developed to measure depression in community populations. Its 20 items were adapted from several widely used depression scales, including the Zung Self Depression Scale (Zung sds), the Beck Depression Inventory (bdi), the Raskin Scale, and the Minnesota Personality Inventory Depression Scale (mmpi-d) (Radloff and Locke, 1986). Respondents were asked to self-report how often they felt each item during the previous week on a scale from 0 to 3, in which 0=rarely or none of the time (less than 1 day), 1=some or a little of the time (1–2 days), 2=occasionally or a moderate amount of time (3–4 days), and 4=most or all of the time (5–7 days). Items include all of the principle components of depression, including depressed mood, feelings of worthlessness, feelings of hopelessness, loss of appetite, sleep problems, anhedonia, psychomotor agitation or retardation, and guilt. A factor analysis of the 20 items typically produces four factors: depressed affect, positive affect, somatic-retarded activity, and interpersonal (Radloff, 1977). Total scale ces-d scores range from 0 to 60 with higher scores indicating more severe depressive symptoms. Total severity is calculated by reversing scores for items 4, 8, 12, and 16 (the items that control for response bias), then summing all of the scores. A score of 16 or higher was identified in early studies as identifying subjects with depressive illness (Radloff and Locke, 1986).
The ces-d has been translated into several languages, including Spanish, and its reliability and validity have been documented in a variety of cultural groups, including Mexican-Americans. According to Radloff and Locke (1986), the internal consistency (as measured by Chronbach's alpha) of the ces-d is typically about .85 in community samples. Similarly high reliabilities are reported in studies of Spanish-speaking immigrants. For example, a study of 272 Spanish-speaking participants reported an internal consistency of .90 and a two-week test-retest reliability (n=25) of .93 (Gonzalez et al., 1995). Unlike general population studies, studies with elderly and minority populations indicate that the four factors may not be applicable and that higher cutoffs may be more appropriate for these populations (for example, Furner et al., 2006; Love and Love, 2006). More specifically, a recent study of 554 Spanish-speaking adults aged 18 to 34 found that a cutoff of 26 was most suitable, producing a sensitivity of .906 and a specificity of .918 (Vasquez, Blanco, and Lopez, 2006).
Individual and Group Beliefs. The Individual-Group Belief Inventory (igbi) (Eidelson, 2002) was used to measure respondents’ personal beliefs about their personal worlds, their racial group, and their national group with regard to issues of vulnerability, injustice, distrust, superiority, and helplessness. The complete igbi is designed to measure each of these five belief domains at three levels of analysis: 1) beliefs about the personal world (for example, “Other people are often unfair to me.”); 2) beliefs about the ingroup (for example, “I believe other groups are often unfair to my group.”); and 3) perceptions of the ingroup's collective worldviews (for example, “My group believes that other groups are often unfair to it.”). At each level, each belief is measured by three items endorsed on a 5-point Likert-type scale ranging from Strongly Disagree (1) to Strongly Agree (5). The respondent's score for each belief scale is the arithmetic sum of the three items measuring that belief.
In this study, we did not include the third-level items (that is, perceptions of collective worldviews). In addition to the personal world items, we included two versions of the personal beliefs about the ingroup items –one set for the ethnic group (for example, Mexicans or Mexican-Americans), and one set for the U.S. mainstream group (that is, “Americans”). Sample items from each three-item igbi scale measuring respondent beliefs about the personal world are “My safety and security are uncertain” (Vulnerability); “Other people criticize me more than they should” (Injustice); “Other people will try to deceive me if given the chance” (Distrust); “I am superior to other people in many ways” (Superiority); and “I have very little control over my future” (Helplessness). Parallel igbi items measuring beliefs about the ethnic group and the U.S. national group are “I believe my (ethnic or “American”) group's safety and security are uncertain” (Vulnerability); “I believe my (ethnic or “American”) group is criticized by other groups more than it should be” (Injustice); “I believe that other groups will try to deceive my (ethnic or “American”) group if given the chance” (Distrust); “I believe that my (ethnic or “American”) group is superior to other groups in many ways” (Superiority); and “I believe that my (ethnic or “American”) group has very little control over its future” (Helplessness).
Empirical research using the igbi has provided substantial data regarding the instrument's validity and reliability. For example, in an unrelated survey of U.S. Americans six months after 9/11, Eidelson (2002) found that respondents who scored higher on the igbi scales measuring personal beliefs about national group vulnerability, injustice, distrust, and superiority were a) more likely to adopt an “us-versus-them” mindset, b) acknowledge greater concerns about homeland security, and c) report greater support for military action by the U.S., while those who saw their U.S. American national group as more helpless tended to express less support for the military action. A confirmatory factor analysis on this sample also demonstrated that a five-factor belief model with correlated factors provided a better fit to the data than alternative models with fewer factors, and the Cronbach alphas for the scales were also adequate. Evidence for predictive validity is also evident from a study showing that Israeli-Jewish respondents with stronger personal beliefs about ingroup vulnerability, injustice, distrust, and superiority tended to support more extreme and less compromising policies for resolving the Israeli-Palestinian conflict (Maoz and Eidelson, 2007). Preliminary evidence of the instrument's cultural validity with ethnic minority populations has also been demonstrated (Lyubansky and Eidelson, 2005).
The survey measures used in this study were structured into five sections in the following way. The first section consisted of the demographic questions; the second section dealt with identity and acculturation questions. This was followed by the section containing discrimination questions (section 3) and the questions assessing service utilization (section 4). The final and fifth section consisted of the mental health scale and the three igbi scales, such that the first igbi scale measured respondents’ beliefs about their personal world, the second measured their beliefs about their ethnic group, and the third measured their beliefs about their “American” group.
ResultsDemographicsAs reported in the section on methods, the undocumented portion of the sample did not significantly differ from their documented counterparts in gender, age, or time in the United States (all ps>.05).
Education, Income, and Financial StabilityRespondents reported an average of 11.6 years (sd=4.5) of formal education (including primary school). The distribution on highest educational level attained was 7 percent, graduate work; 12 percent, bachelor's degree; 22 percent, associate degree; 18 percent, high school graduate; 28 percent, some high school; and 13 percent with an eighth grade education or less. Just under 82 percent of the sample had received most of their education in their country of origin, while 16 percent reported being educated primarily in the United States. About 53 percent of the sample reported working full time, and another 25 percent working part time. Almost all the rest of the remaining 22 percent were unemployed and looking for work (less than 1 percent was retired).
The personal annual income of respondents was well below the Georgia median (US$40 741 for men and US$31 580 for women), with 36 percent of respondents reporting earning less than US$10 000; 17 percent, between US$10 000 and US$15 000; 16 percent, between US$15 000 and US$20 000; 17 percent, between US$20 000 and US$30 000; 7 percent, between US$30 000 and US$40 000; and 7 percent, more than US$40 000. Despite these modest earnings, over 73 percent reported that their current income was “somewhat higher” or “much higher” than what they earned in their country of origin, prior to migration. On the other hand, only 57 percent reported that their current occupation was “somewhat higher” or “much higher” status than in their country of origin, with 16 percent reporting equal status and 26 percent reporting “somewhat lower” or “much lower” status.
The study participants reported living in homes that were generally modest in size, with 80 percent of respondents living in a dwelling with four or fewer rooms (all rooms were counted except bathrooms). Over 95 percent of respondents said they had at least one financial dependent. About 48 percent lived with their spouse; 54 percent lived with one or more children; 16 percent lived with at least one parent; 19 percent lived with one or more other relatives; and 4 percent lived with one or more friends. Respondents reported financially supporting an average of 2.4 (sd=1.6) people, including themselves. Approximately 35 percent of respondents said they did not have a savings or checking account in the United States. Even so, 52 percent reported sending money abroad, with an average amount of US$261/month.
Undocumented respondents reported significantly lower education (t [107]=−3.338, p=.001) and personal income (t [104]=−3.214, p=.001), as well as poorer English fluency (t [97]=−4.46, p<.001). In addition, undocumented respondents were more likely to live with one or more children (t [116]=3.58, p=.001) or with coworkers (t [115]=2.71, p=.038), and were less likely have a bank account (t [114]=4.84, p<.001). They also were significantly more likely to report difficulty in meeting the family's basic needs, such as feeding and clothing children (t [95]=3.41, p=.001).
DiscriminationAlmost three-quarters (74 percent) of the respondents reported at least one discriminatory event in the previous month, with more than half (n=49) reporting just a single incident during that time. On the other hand, 22 percent of the total sample (n=27) reported experiencing discrimination at least once a week, with 13 percent reporting discrimination on a daily basis. No significant differences in discrimination frequency emerged for immigration status (t [115]=.884, p=.379) or gender (t [122]=−.244, p=.823). Similarly, correlation analyses failed to reveal differences in discrimination frequency based on age, education, income, or time in the U.S. (all rs>.05).
To further examine respondents’ experience with discrimination, we inquired about discrimination in 11 different situations/domains. These 11 items were coded dichotomously (Yes or No) and compared based on immigration status (documented vs. undocumented) using Chi-Square analyses. The results, reported in Table 1, show a general trend of undocumented respondents reporting more discrimination, particularly in seeking employment (χ2[1]=5.97, p=.015), obtaining credit/loan, (χ2[1]=7.33, p=.009), and purchasing home/property (χ2[1]=4.44, p=.044).
Percent of Respondents Reporting Discrimination
| Discrimination Domain | Undocumented (%) | Documented (%) | Total (%) |
|---|---|---|---|
| Seeking employment | 59 a | 36 b | 45 |
| Getting a promotion | 9 a | 10 a | 10 |
| Receiving service from business | 32 a | 17 a | 23 |
| Watched while in store | 32 a | 24 a | 27 |
| Renting apartment/house | 23 a | 13 a | 17 |
| Residence maintenance | 7 a | 3 a | 5 |
| Obtaining credit or loan | 34 a | 13 b | 21 |
| Purchasing house or property | 21 a | 7 b | 12 |
| Treated by police | 46 a | 37 a | 40 |
| Treated by education system | 14 a | 17 a | 16 |
| Treated by social service provider | 27 a | 28 a | 28 |
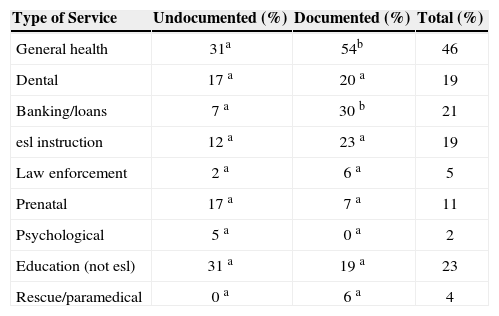
Respondents reported difficulties accessing a wide range of services, but 38 percent said that accessing general health services was the most difficult, followed by law enforcement services (21 percent), and dental services (17 percent). Even when some access to general health services was available, respondents often remained unsatisfied with their experience, with 24 percent rating general health service providers as being least sympathetic or helpful of the 10 different service providers listed in the survey (fewer than half [46 percent] actually reported having used general health services in the previous year). Similarly, 19 percent of respondents reported law enforcement services (for example, police) to be the least sympathetic or helpful, with just 5 percent reporting using police services in the previous year. On the other hand, 20 percent of respondents reported that of all services, general health services were the least difficult to access, and 23 percent reported general health providers to be more sympathetic and helpful than any other service providers.
Since immigration status legally determines access to many services, including non-emergency health care, Chi-Square analyses were used to compare accessibility, utilization, and satisfaction with 10 different types of public services. Table 2 shows the percent of respondents utilizing each service, separated by immigration status. General health (46 percent) was the most widely utilized service, but respondents with documentation were significantly more likely (54 percent to 31 percent) to report using it (χ2[1]=5.76, p=.019). A significant immigration status difference also emerged on banking/loans, with 30 percent of documented respondents reporting using banks, compared to just 7 percent of undocumented migrants’ utilization (χ2[1]=8.15, p=.004). Notably, 25.6 percent of undocumented respondents reported that bank service providers were least sympathetic or helpful, compared to 9.4 percent of documented respondents (χ2[1]=5.06, p=.025).
Percent of Respondents using Services in Past Year for Each Status
| Type of Service | Undocumented (%) | Documented (%) | Total (%) |
|---|---|---|---|
| General health | 31a | 54b | 46 |
| Dental | 17 a | 20 a | 19 |
| Banking/loans | 7 a | 30 b | 21 |
| esl instruction | 12 a | 23 a | 19 |
| Law enforcement | 2 a | 6 a | 5 |
| Prenatal | 17 a | 7 a | 11 |
| Psychological | 5 a | 0 a | 2 |
| Education (not esl) | 31 a | 19 a | 23 |
| Rescue/paramedical | 0 a | 6 a | 4 |
Although the relationship was not statistically significant, the data did show a trend in which respondents without documentation reported higher depression. It should be noted that the cutoff for depression is 16, so the data indicate that depression scores are generally high for the entire sample. More precisely, 34 percent of our total sample scored in the depressed range, including 41 percent of those who are currently undocumented, and 31 percent of the respondents who are currently in the United States legally.
Immigration status at time of arrival did predict respondents' sense of personal vulnerability (for example, “My safety and security are uncertain.”) (t [97]=3.250, p=.002), injustice (for example, “Other people are often unfair to me.”) (t [98]=2.087, p=.039), and distrust (for example, “Other people will try to deceive me if given the chance.”) (t [100]=4.129, p<.001), with undocumented respondents being significantly higher on all three scales (possible range=3–15) Interestingly, this did not translate to significant group differences in personal life satisfaction (for example, “The conditions of my life are excellent.”) (p=.249).
When current immigration status was used to examine the same variables, vulnerability remained significant (t [102]=2.733, p=.009), but injustice and distrust did not (ps>.05). For current immigration status, however, helplessness emerged as a significant effect (t [104]=2.039, p=.044), as did personal life satisfaction (t [104]=−3.000, p=.004), with undocumented respondents reporting significantly more personal helplessness and significantly less life satisfaction.
Identity and AcculturationWe were interested in determining to what extent Spanish-speaking migrants in Georgia identified with their ethnic group, as Latinos, and as Americans, and which social identity was more important to them. Our survey indicated that the vast majority (77 percent) of respondents considered their primary identity to be that of their specific ethnic group (for example, Mexican), compared to Latino (12 percent) and American (11 percent). Pearson correlational analysis indicated that the only demographic variable significantly associated with primary identity is time in the U.S., with respondents living in the United States for a longer period of time being more likely to have a primary identity of “American.”
In addition, respondents were also asked what membership in each group (that is, Mexican/Latino/American) meant to them to by selecting the most important meaning from four options: 1) share group's culture, 2) live in group's country, 3) belong to group's people, and 4) speak group's language. Culture was the dominant meaning assigned by respondents to their ethnic (57 percent), Latino (51 percent), and American (50 percent) identities, with the remaining options being about equally endorsed (by 15–20 percent) for each identity category. Notably, 75 percent of respondents reported wanting to become part American and part culture of origin, with the remaining 25 percent being evenly split between those who reported wanting to retain as much of their ethnicity of origin as possible and those who said they wanted to become as American as possible.
Over 81 percent of respondents said that their Spanish-language fluency was “very good” (the highest option), with not a single respondent reporting that their Spanish fluency was “poor.” In contrast, 14 percent reported that their English language fluency was “poor” and only 24 percent said that it was “very good.”
In terms of social affiliation, 32 percent reported that all of their friends were Latino/Hispanic, and 98 percent said that at least half of their friends fell into this category. However, respondents wanted their children to have a more integrated social network, with only 8 percent stating a preference for an entirely Latino/Hispanic set of friends for their children and 69 percent hoping for an even split. The work environment was a little different, with 27 percent reporting that all of their colleagues were Latino/Hispanic, but 34 percent saying that they were surrounded by more Anglos than Spanish-speakers.
It is notable, however, that there were no significant group differences in terms of immigration status on any of the identity or acculturation variables. That is, the two groups did not significantly differ in the strength of their ethnic, racial, or “American” identity, or in their acculturation goals for the future (for example, to become more assimilated into U.S. culture)
No significant immigration status differences (at arrival or current) emerged on any of the beliefs regarding either the ethnic group or the national group (all ps>.05), though respondents who were undocumented at the time of arrival to the United States reported a significantly higher satisfaction with the status of the United States (t [101]=2.01, p=.047).
DiscussionAltogether, our findings point to relative similarities across immigration status, but also some important differences. More specifically, though matched on age, gender, and time in the United States, undocumented migrants reported significantly less education, lower income, and less access to health and other services, which is consistent with past research documenting these inequities (for example, Coffey, 2005; Passel and Cohn, 2009). Undocumented migrants in our sample were also less likely than their documented counterparts to have a bank account and more likely to have trouble meeting basic family needs, such as feeding and clothing children.
While no significant differences emerged for frequency of reported discrimination, our findings also showed significant structural barriers for those with undocumented status, including in the percent of respondents reporting discrimination when seeking employment, when trying to obtain a loan, and when purchasing a home. Because of the subjective nature of self-reports of discrimination (that is, apart from individual differences, the same behavior may be perceived as discriminatory by some groups and not by others), these findings should be interpreted with caution and care. However, they do suggest that those with undocumented status are more likely to face considerable obstacles in these domains, likely due to both legal barriers and prejudice. In this regard, it is worth emphasizing that, despite the widespread belief that low-skilled immigrants depress wages and increase unemployment, as in the 1980s, economists have found that not only does immigration generally have a small but positive effect to increase the wages of even low-skilled native-born workers (Shierholz, 2010), but that the legalization of undocumented workers' status did not affect the wages of native workers, regardless of whether they were white or of Mexican origin (Sorensen and Bean, 1994). These new data are so compelling that a recent New York Times article concluded that “nearly all economists, of all political persuasions, agree that immigrants –those here legally or not–benefit the overall economy” (Davidson, 2013).
Similarly, respondents with undocumented status also report having less access to health and banking services and more negative experiences with these services when they are utilized. Since all non-emergency health services are legally denied to those with undocumented status, these differences in utilization of health services are unsurprising. They are, however, still noteworthy, since preventive prenatal and dental care are not only both associated with better infant and adult health but also likely with considerable long-term cost savings. Considering that, as we stated earlier, an average undocumented family in Georgia is estimated to contribute approximately US$2 400 in state and local sales, income, and property taxes (Coffey, 2005; West, 2010), the economic viability of making limited non-emergency health services available for those without documentation should be studied and considered.
The reluctance of our respondents to access law enforcement services is understandable but is also a cause for concern in community public safety. Needs for police services will only increase as Spanish-speaking populations grow in the various neighborhoods. If community policing is to be viable –a philosophical approach that we endorse–, then local public policy will need to find ways to incorporate immigrants and build trust in immigrant communities.
In spite of state laws such as the 2006 Georgia Security and Immigration Compliance Act, which represented the toughest state law against unauthorized immigrants to curb unauthorized migration up to that point (Lippard and Gallagher, 2011), high birth rates and continued migration from Latin America mean that the number of immigrants making Georgia their destination is likely to continue. “The U.S. is in tough economic times, but Mexico is in worse economic times. There are areas of deep, deep poverty in Mexico,” notes University of Georgia demographer Doug Bachtel. “Migrants are looking for a better life for their kids. They are really go-getters, willing to work long hours, and they take jobs a lot of [U.S.] Americans don't want” (cited in Witman, 2013).
Legal questions aside, this study also provides some perspective on the ongoing debate regarding the existential situation of undocumented immigrants. Specifically, activists on both sides of the debate have described this group as “living in the shadows.” As befitting their image, the shadows are complex and ambiguous places. To the progressives, they are where the undocumented are harassed by overzealous law enforcement officers, exploited by unethical employers, and denied access to not only government services but also to U.S. American institutions and identities. Political conservatives use the same image to describe places where the undocumented sneakily use public services to which they are not entitled and engage in a variety of illicit activities and crimes (Skerry, 2013).
While we did not collect data on illegal activity, our findings suggest, much as Skerry did, that the truth is somewhere in the middle. Undocumented immigrants, like their documented counterparts, often live with family members who have documentation. They avoid law enforcement when possible, use emergency health services when necessary, and contribute to the workforce, often doing unskilled labor. At the same time, they understandably under-utilize health and banking services and are more likely to experience difficulty in obtaining employment, qualifying for a loan, and purchasing a home. Despite this, the vast majority orient themselves toward becoming either a hyphenated [U.S.] American or as [U.S.] American as possible. While some intend to return to their country of origin and retain a shadowy existence in the meantime, others, like their documented counterparts, have embraced the U.S. American dream and live relatively openly and with at least some meaningful contact with U.S. institutions and culture.
In conclusion, we contend that even though U.S. Americans in general and Georgian citizens in particular have socially constructed a difference between documented and undocumented immigrants, stigmatizing the undocumented as a culturally alien group uninterested in acculturation, our findings suggest that there are few real differences in their backgrounds, desires, identities, and even experiences with discrimination following migration. Moreover, as discussed earlier, the data fail to support the popular belief that undocumented immigrants either exert a downward pressure on wages or are a net drain on tax revenues (Lipman, 2006). These findings have important policy implications, especially with immigration reform a likely focus of the current presidential administration. On the basis of these findings and the broad literature base, lawmakers should feel confident that neither the U.S. economy nor the nation's social fabric would be harmed by amnesty for undocumented individuals currently in the United States. To the contrary, the data suggest that immigrants, including the undocumented, comprise an essential part of U.S. families, workplaces, and communities and are likely to continue to do so in the foreseeable future (Immigration Policy Center, 2011).