To test the psychometric properties of a newly designed instrument to describe the REpresentations and Practices About REtirement (the PREPARE instrument).
MethodsParticipants were nurses and doctors working in the two public hospitals of Porto, aged 55–65 years, in 2011. Among the 367 eligible participants, 231 (65.9%) participated in the study. The PREPARE instrument consists of four sections: 9, 5 and 12, respectively. A principal component analysis was performed to evaluate the scale's dimensionality, followed by a confirmatory factor analysis to test the fit using different indexes (TLI – Tucker–Lewis Index and CFI – Confirmatory fit index).
ResultsPrincipal confirmatory analysis and confirmatory factor analysis identified 3, 1 and 2 factors for section 1, 2 and 3. All confirmatory factor analysis models had a value of CFI and TLI higher than 0.9. Section 1 showed a first factor related with items about the importance of personal competences, a second factor related with items about the importance of relationships with patients, and third factor related with items about the importance of following ethical and directive rules; section 2 showed a general factor about the features you valued most in the other health professional group; and, finally, in section 3, the first factor was related with items about satisfaction with the work environment and the second factor with items about satisfaction with professional career.
ConclusionThe PREPARE instrument has the basic requirements of a valid and reliable measurement of a scale to describe medical doctors and nurses representations and practices about the decision regarding retirement.
The number of persons needing health care is expected to substantially increase in the coming years considering the estimated demographic trend in Portugal,1 implying of the need for additional healthcare professionals.
Several studies have shown that the work capacity of health professionals declines with increasing age.2 Also, many health professionals over 55 years of age are planning to retire early due to a lack of job satisfaction, an excessive workload and increasing bureaucracy.3 Studies have found approximately one-third to half of health professionals plan to retire before the official retirement age.4 The intention to retire has been found to predict actual retirement.5 All these factors combined lead to an increased risk of losing a valuable group of health professional, thereby jeopardizing the health of communities.
In an effort to respond to this prediction of a shortage of experienced health professionals, target interventions could focus on increasing their job satisfaction and decreasing bureaucracy. An study in Netherlands showed that occupational health intervention program prevented early retirement.6 However, the success of these interventions needs to consider underlying reasons for job satisfaction and also the decision-making process in the representations of retirement of healthcare professionals faced with the number years of employment. Thus, it is important to know why they extend their employment time or, on the contrary, terminate it through retirement. McMullin said that after qualifying as medical doctor he “became less inclined to sit and listen” however once he retired “things changed again. Suddenly my financial worries were over …Most of my children had left …I had time once more” to practice.7
In our study we focused on two major areas that can influence the decision of retirement: job satisfaction and the most value competencies by the medical doctors and nurses.
Previously developed questionnaires have focused on job satisfaction in 10 sub-domains and 3 general domains.8 Autonomy, personal time, relationships with patients, patient care issues, relationships with colleagues, relationships with staff, relationships with community, income, administrative support, and resources and general domains of satisfaction with current job, career and specialty.8 In our work we centered on two of the general domains of job satisfaction (current job and career) that can influence the decision of retirement.
The Accreditation Council for Graduate Medical Education defined six general competencies of graduate medical education (GME): patient care; medical knowledge; practice-based learning and improvement; professionalism; interpersonal skills and communication; and systems-based practice.9 In our work we centered in three competencies (patient care, healthcare knowledge and professionalism) that can influence the decision of retirement, the general domains of job satisfaction can measure indirectly interpersonal skills.
This study aims to test the psychometric properties of the new instrument to describe medical doctors and nurses REpresentations and Practices About REtirement (the PREPARE instrument) in a Portuguese sample of health professionals.
Until now there has been a lack of effective screening instruments to measure the medical doctors and nurses representations and practices about retirement that will make easier the offer of early interventions for health professionals.
MethodsParticipantsEligible participants were health professionals, both nurses and doctors, who work in the two main public hospitals in Porto (São João Hospital (HSJ) and Santo António Hospital (HSA)), aged between 55 and 65 years old.
Health professionals self-completed the questionnaires in Portuguese (including items on socio-demographic characteristics, compliance with government action in regard to the general policy of pensions and the PREPARE instrument). The questionnaires were delivered to the head of the department (doctor) and the respective head of the nurses that were responsible for the distribution to the health professionals. It was established that completed questionnaires would be collected in eight days.
Data collectionPREPARE scale developmentA pilot-study was conducted using semi-structured interviews in order to know the perception of health professionals, doctors and nurses aged between 55 and 65 and from the analysis of the interview we created the PREPARE instrument.
From this pilot-study the PREPARE instrument was designed with 3 main areas: dealing with the most important competences the participant identifies in his/her health professional group (9 items), the features valued most in the other health professional group (5 items) and job satisfaction scale for health professionals (12 items).
The “dealing with the most important competences the participant identifies in his/her health professional group” domain had three sub-domains: “healthcare knowledge competences” (PAV1), “patient care competences” (PAV2), and “professionalism competences”.
The “job satisfaction” domain had two sub-domains: “satisfaction with the work environment” (WSC1) and “satisfaction with professional career” (WSC2).
All items have a 4-points Likert scale going from not important to very important (section 1 and 2) and from very unsatisfied to very satisfied (section 3).
Statistical analysisThe nurses and medical doctors’ characteristics were compared using association Chi-square test and the Mann–Whitney test for the categorical and continuous variables, respectively.
A principal components analysis (PCA) was performed to understand the underlying structure of the different scales of the instrument. Principal components analysis was performed using the Oblimin rotation (since we expected theoretical a correlations between domains). Principal components were selected if their eigenvalue was higher than one or considering the scree plot. The items with absolute factor loading of 0.4 or higher were interpreted as having strong correlation with the principal correlation.
This analysis was followed by confirmatory factor analysis (CFA) to test the fit of the factor structure obtained from the PCA. The CFA models was assessed using different indexes: (i) the Tucker–Lewis Index (TLI), (ii) the Comparative fit index (CFI) (Bentler, 1990), (iii) the Route mean square error of approximation (RMSEA), and (iv) the Standardized root mean square residual (SRMR). The CFI and TLI indexes range from 0 to 1, with higher values indicating a better model fit. The RMSEA and SRMR indexes range from 0 to 1, with lower values indicating a better model fit. A good model fit is indicated by a CFI and TLI values of 0.90 or higher and values of RMSEA and SRMR close to 0.06.10
The internal reliability of the scale was tested using the Cronbach's alpha coefficient.
To test the construct validity of the instrument we estimated the Pearson correlation between all domains of all subscales, and the mean values of each subscale were also compared according to several positions concerning the decision to retire by using the two independent sample t-test.
The score of each subscale was calculated by adding all items of that subscale.
The research protocol was approved by the two local ethical committee (Ethical committee of HSJ and HSA) and the study procedures complied with the Helsinki Declaration. All participants signed an informed consent form to participate in the study.
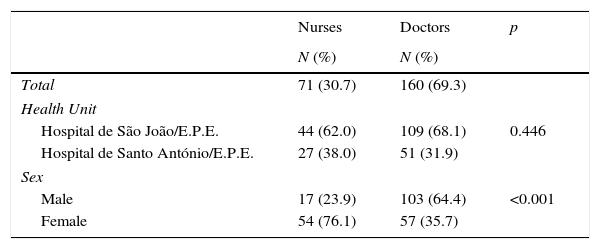
ResultsAmong the 367 health professionals identified as in the eligible age range in 2011, 231 (65.9%) participated in our study. Of the 231 professionals who responded to the survey the majority were physicians (69.3%). The responders of the two health professional groups (nurses versus doctors) had statistically significant differences in terms of sex (76.1% men versus 35.7% women), level of education (0% versus 22.9% completed PhD), parents’ education, median age (56 versus 58 years) and contractual relationship. There were no differences with respect to the hospital (62% HSA versus 68.1% HSJ) (Table 1).
Description of participants by occupational group.
| Nurses | Doctors | p | |
|---|---|---|---|
| N (%) | N (%) | ||
| Total | 71 (30.7) | 160 (69.3) | |
| Health Unit | |||
| Hospital de São João/E.P.E. | 44 (62.0) | 109 (68.1) | 0.446 |
| Hospital de Santo António/E.P.E. | 27 (38.0) | 51 (31.9) | |
| Sex | |||
| Male | 17 (23.9) | 103 (64.4) | <0.001 |
| Female | 54 (76.1) | 57 (35.7) | |
| Median (IQR) | Median (IQQ) | ||
|---|---|---|---|
| Age | 56 (2) | 58 (4) | <0.001 |
| PhD | N (%) | N (%) | |
| No | 63 (100) | 123 (77.4) | <0.001 |
| Yes | 0 (0) | 36 (22.9) | |
| Father's education level (years completed) | |||
| ≤9 years | 46 (78.0) | 59 (39.9) | <0.001 |
| 9–12 years | 7 (11.9) | 27 (18.2) | |
| >12 years | 6 (10.2) | 62 (41.9) | |
| Mother's education level | |||
| ≤9 years | 49 (84.5) | 83 (56.5) | <0.001 |
| 9–12 years | 8 (13.8) | 38 (25.9) | |
| >12 years | 1 (1.7) | 26 (17.7) | |
| Contract | |||
| Exclusive and full time | 9 (12.9) | 53 (33.5) | <0.001 |
| Full time | 61 (87.1) | 74 (46.8) | |
| Part-time | 0 (0.0) | 31 (19.6) | |
| Cumulative regime | |||
| Yes | 19 (27.1) | 113 (70.6) | <0.001 |
| No | 51 (72.9) | 47 (29.4) | |
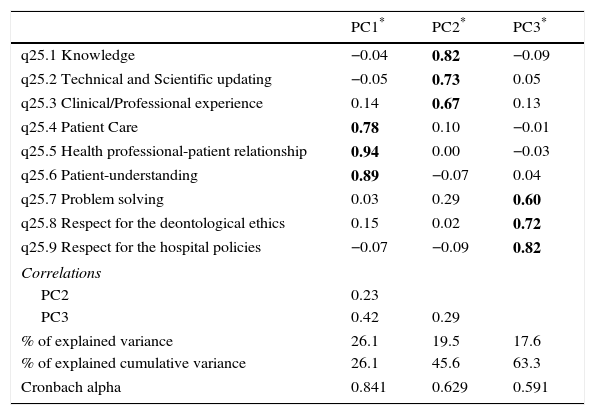
The scree plot indicated that a three-component solution was the most appropriate. The principal components analysis revealed a three-component solution, explaining approximately 63.3% of the total variance. The first component was strongly associated with items 4, 5 and 6, the second component was strongly associated with the items 1, 2 and 3, and finally the third component was strongly associated with item 8 and 9 with moderately item 7. It was found that the 1st and 3rd component moderately correlated with each other (Table 2).
Principal component analysis with oblimin rotation of the items on most important competences for you in your health professional group.
| PC1* | PC2* | PC3* | |
|---|---|---|---|
| q25.1 Knowledge | −0.04 | 0.82 | −0.09 |
| q25.2 Technical and Scientific updating | −0.05 | 0.73 | 0.05 |
| q25.3 Clinical/Professional experience | 0.14 | 0.67 | 0.13 |
| q25.4 Patient Care | 0.78 | 0.10 | −0.01 |
| q25.5 Health professional-patient relationship | 0.94 | 0.00 | −0.03 |
| q25.6 Patient-understanding | 0.89 | −0.07 | 0.04 |
| q25.7 Problem solving | 0.03 | 0.29 | 0.60 |
| q25.8 Respect for the deontological ethics | 0.15 | 0.02 | 0.72 |
| q25.9 Respect for the hospital policies | −0.07 | −0.09 | 0.82 |
| Correlations | |||
| PC2 | 0.23 | ||
| PC3 | 0.42 | 0.29 | |
| % of explained variance | 26.1 | 19.5 | 17.6 |
| % of explained cumulative variance | 26.1 | 45.6 | 63.3 |
| Cronbach alpha | 0.841 | 0.629 | 0.591 |
The internal reliability coefficients from the three subscales were calculated. The overall Cronbach's alpha values ranged between 0.59 and 0.84, indicating that this section has good reliability (Table 2).
Considering the 3 components identified we decided to fit a 3-factor confirmatory analysis. The first factor was related with items about the “healthcare knowledge competences” (PAV1), the second factor with items about “patient care competences” (PAV2), and third factor with items about “professional competences” (PAV3). The confirmatory factor analysis (Fig. 1) showed a good fit.
Confirmatory factor analysis for the three-factor model of most important competences for you in your health professional group scale. Chi square=44.7, Df=24, Pr(>Chi sq)=0.006, Goodness-of-fit index=0.960, RMSEA index=0.061 90% CI: (0.032, 0.088), Tucker–Lewis NNFI=0.952 and Bentler CFI=0.968.
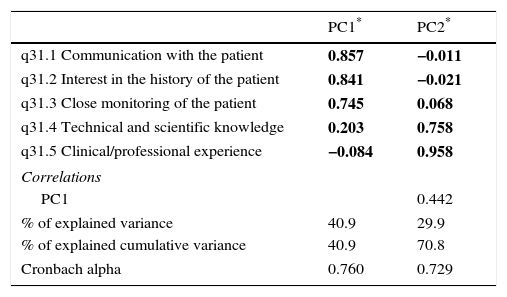
The scree plot indicated that a two-component solution was the most appropriate. The principal components analysis revealed a two-component solution, explaining approximately 70.8% of the total variance. The first component was strongly associated with items 1, 2 and 3 and the second component was strongly associated with items 4 and 5. It was found that the 1st and 2nd component moderately correlated with each other (Table 3).
Principal components analysis with oblimin rotation of the items on the features you valued most in the other health professional group in the study.
| PC1* | PC2* | |
|---|---|---|
| q31.1 Communication with the patient | 0.857 | −0.011 |
| q31.2 Interest in the history of the patient | 0.841 | −0.021 |
| q31.3 Close monitoring of the patient | 0.745 | 0.068 |
| q31.4 Technical and scientific knowledge | 0.203 | 0.758 |
| q31.5 Clinical/professional experience | −0.084 | 0.958 |
| Correlations | ||
| PC1 | 0.442 | |
| % of explained variance | 40.9 | 29.9 |
| % of explained cumulative variance | 40.9 | 70.8 |
| Cronbach alpha | 0.760 | 0.729 |
The internal reliability coefficients from the three subscales were calculated. The overall Cronbach's alpha values ranged between 0.73 and 0.76, indicating that this section has good reliability (Table 3).
Considering that PC1 and PC2 were correlated with each other, we decided to fit a one-factor confirmatory analysis with residual correlation between items 4 and 5. The confirmatory factor analysis (Fig. 2) showed a good fit.
Confirmatory factor analysis for the one-factor model of the features you valued most in the other health professional group scale (PAVO). Chi square=9.29, Df=4, Pr(>Chi sq)=0.054, Goodness-of-fit index=0.984, RMSEA index=0.076 90% CI: (0.00, 0.14), Tucker–Lewis NNFI=0.961 and Bentler CFI=0.984.
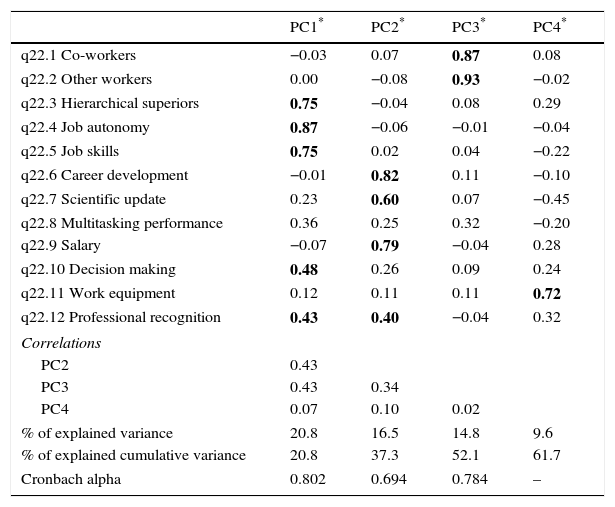
The scree plot indicated that a four-component solution was the most appropriate. The principal components analysis revealed a four-component solution, explaining approximately 61.7% of the total variance. The first component was strongly associated with items 3, 4 and 5 items and moderately with 10 and 12 items; the second component was strongly associated with the items 6, 7 and 9; the third component was strongly associated with item 1 and 2, and finally the fourth dimension with item 11. It was found that the 1st, 2nd and 3rd principal component correlated moderately with each other.
The internal reliability coefficients from the four subscales were calculated. The overall Cronbach's alpha values ranged from 0.70 to 0.80, indicating that this section has good reliability (Table 4).
Principal components analysis with oblimin rotation of the items on job satisfaction scale.
| PC1* | PC2* | PC3* | PC4* | |
|---|---|---|---|---|
| q22.1 Co-workers | −0.03 | 0.07 | 0.87 | 0.08 |
| q22.2 Other workers | 0.00 | −0.08 | 0.93 | −0.02 |
| q22.3 Hierarchical superiors | 0.75 | −0.04 | 0.08 | 0.29 |
| q22.4 Job autonomy | 0.87 | −0.06 | −0.01 | −0.04 |
| q22.5 Job skills | 0.75 | 0.02 | 0.04 | −0.22 |
| q22.6 Career development | −0.01 | 0.82 | 0.11 | −0.10 |
| q22.7 Scientific update | 0.23 | 0.60 | 0.07 | −0.45 |
| q22.8 Multitasking performance | 0.36 | 0.25 | 0.32 | −0.20 |
| q22.9 Salary | −0.07 | 0.79 | −0.04 | 0.28 |
| q22.10 Decision making | 0.48 | 0.26 | 0.09 | 0.24 |
| q22.11 Work equipment | 0.12 | 0.11 | 0.11 | 0.72 |
| q22.12 Professional recognition | 0.43 | 0.40 | −0.04 | 0.32 |
| Correlations | ||||
| PC2 | 0.43 | |||
| PC3 | 0.43 | 0.34 | ||
| PC4 | 0.07 | 0.10 | 0.02 | |
| % of explained variance | 20.8 | 16.5 | 14.8 | 9.6 |
| % of explained cumulative variance | 20.8 | 37.3 | 52.1 | 61.7 |
| Cronbach alpha | 0.802 | 0.694 | 0.784 | – |
Considering that CP1, CP3 were correlated with each other and CP4 contained only one item that did not relate with any of the other components, we decided to fit a two-factor confirmatory analysis. The first factor was related with items about the “satisfaction with the work environment” (WSC1) and the second factor with items about the “satisfaction with professional career” (WSC2), and items 1 and 2 had related residuals. The confirmatory factor analysis (Fig. 3) showed a good fit.
Construct validityThe items about “satisfaction with professional career” (WSC2) showed only a statistical significant correlation with items about “satisfaction with the work environment” (WSC1) (r=0.58, p<0.001). “satisfaction with the work environment” was related with “healthcare knowledge competences” (PAV1) (r=0.15, p<0.05), “patient care competences” (PAV2) (0.25, p<0.001), “professional competences” (PAV3) (0.27, p<0.001). “healthcare knowledge competences” (PAV1) was related with “patient care competences” (PAV2) (0.27, p<0.001), “professional competences” (PAV3) (0.38, p<0.001) and the “features you valued most in the other health professional group” scale (PAVO) (0.38, p<0.001). “Patient care competences” (PAV2) was related with “professional competences” (PAV3) (0.45, p<0.001) and “the features you valued most in the other health professional group” scale (PAVO) (0.26, p<0.001). “Professional competences” (PAV3) was related with “the features you valued most in the other health professional group” scale (PAVO) (0.28, p<0.001).
The domains of the scale most important competences for you in your health professional group and the “features you valued most in the other health professional group” showed a significant correlation with each other.
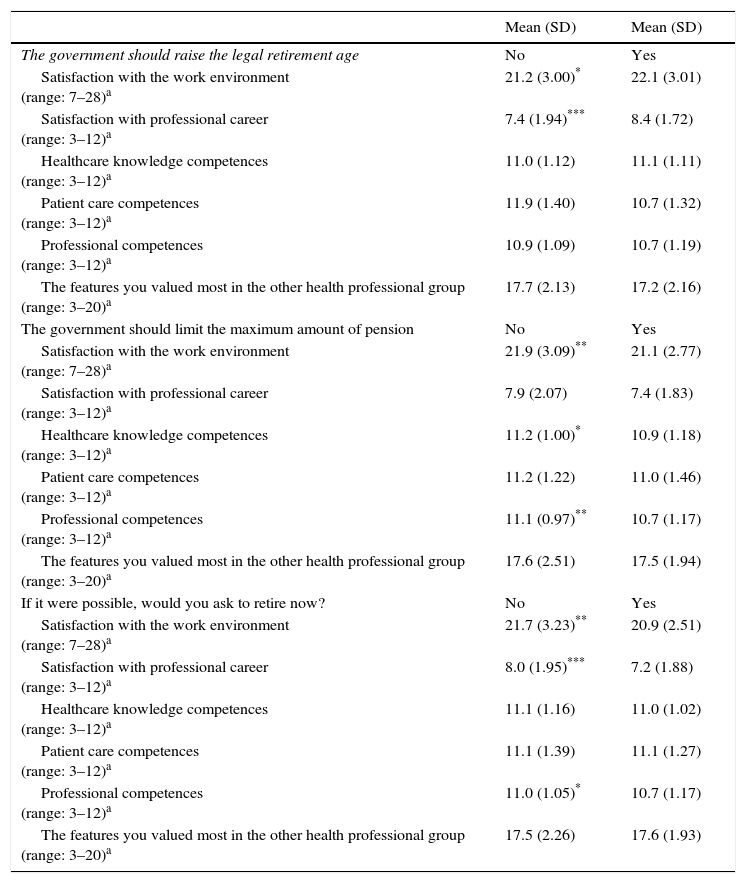
The health professionals that would like to retire showed lower levels of satisfaction (WSC1 and WSC2) and considered that following “professionalism competencies” as less important (Table 5).
The distribution of the each score domain according to several positions about general political pensions and the decision to retire.
| Mean (SD) | Mean (SD) | |
|---|---|---|
| The government should raise the legal retirement age | No | Yes |
| Satisfaction with the work environment (range: 7–28)a | 21.2 (3.00)* | 22.1 (3.01) |
| Satisfaction with professional career (range: 3–12)a | 7.4 (1.94)*** | 8.4 (1.72) |
| Healthcare knowledge competences (range: 3–12)a | 11.0 (1.12) | 11.1 (1.11) |
| Patient care competences (range: 3–12)a | 11.9 (1.40) | 10.7 (1.32) |
| Professional competences (range: 3–12)a | 10.9 (1.09) | 10.7 (1.19) |
| The features you valued most in the other health professional group (range: 3–20)a | 17.7 (2.13) | 17.2 (2.16) |
| The government should limit the maximum amount of pension | No | Yes |
| Satisfaction with the work environment (range: 7–28)a | 21.9 (3.09)** | 21.1 (2.77) |
| Satisfaction with professional career (range: 3–12)a | 7.9 (2.07) | 7.4 (1.83) |
| Healthcare knowledge competences (range: 3–12)a | 11.2 (1.00)* | 10.9 (1.18) |
| Patient care competences (range: 3–12)a | 11.2 (1.22) | 11.0 (1.46) |
| Professional competences (range: 3–12)a | 11.1 (0.97)** | 10.7 (1.17) |
| The features you valued most in the other health professional group (range: 3–20)a | 17.6 (2.51) | 17.5 (1.94) |
| If it were possible, would you ask to retire now? | No | Yes |
| Satisfaction with the work environment (range: 7–28)a | 21.7 (3.23)** | 20.9 (2.51) |
| Satisfaction with professional career (range: 3–12)a | 8.0 (1.95)*** | 7.2 (1.88) |
| Healthcare knowledge competences (range: 3–12)a | 11.1 (1.16) | 11.0 (1.02) |
| Patient care competences (range: 3–12)a | 11.1 (1.39) | 11.1 (1.27) |
| Professional competences (range: 3–12)a | 11.0 (1.05)* | 10.7 (1.17) |
| The features you valued most in the other health professional group (range: 3–20)a | 17.5 (2.26) | 17.6 (1.93) |
In the present study, we aimed to describe the development and validation process of the PREPARE instrument to address the lack of instruments to assess medical doctors and nurses REpresentations and Practices About Retirement.
Considering that our efforts were the representations of retirement we focused on 3 sub-domains: (i) patient care; (ii) medical knowledge and (iii) professionalism. The confirmatory analysis showed this structure (healthcare knowledge, patient care competences and professional competences). In the case of domain features you valued most in the other health professional group we decided to study only two sub-domains: (i) patient care and (ii) medical knowledge. Confirmatory factor analysis revealed only one-factor structure for this domain, not identifying these two sub-domains.
In this study, the theoretical hypotheses defined in previous studies on job satisfaction referred in the introduction were confirmed. We expected that sub-domain satisfaction with the work environment would be strongly related with satisfaction with professional career and moderately related with most important competences for you in your health professional group, also we expected the domains of the scale most important competences for you in your health professional group scale and the features you valued most in the other health professional group would be moderately related with each other. This study also showed as expected that the domain satisfaction with professional career was associated with contract type being the exclusive and full-time work the more rewarded (data not shown).
Previous work has shown that working hours, burnout and work-related sleep issues, followed by job satisfaction, psychological distress, health, general work ability and mental and physical work ability are determinants of the retirement intentions in GPs3 and we found similar result.
So, we expected that the job satisfaction scores would be the main predictor of complying with government action in regard to general political of pensions and ask to retire now; and this was confirmed. However, we observed that following sub-domain Professional competences is less important, however is also a predictor.
The major limitation of the questionnaire is that this questionnaire was not created with back up theory, it was created having in account the analysis of the interview, however 3 of the 6 general competencies of graduate medical education are evaluated and we believe that the evaluated are the most important in this context of retirement.
In conclusion the PREPARE instrument has the basic requirements of a valid and reliable measurement of a scale to describe medical doctors and nurses’ representations and practices concerning the decision to retirement.
In future this instrument could be used to establish and implement more effective policies that do in fact promote the extension of professional practice after the minimum age for retirement.
Conflicts of interestThe authors declare no conflicts of interest.


