


Law 9.991/2000, which provides about investments in research and development (R&D) to the electric sector in Brazil, prioritizes innovations that provide advances to the sector. In the electricity distribution segment, the focus is on improving the overall efficiency of companies. Therefore, this paper aims to verify the correlation between the focus on innovation and relative economic efficiency. The survey was conducted in 2014 covering data from 2010 to 2013 of 20 exclusive electricity distribution companies listed on BM&FBovespa. This research is applied and descriptive, with a quantitative approach. In the data collection, the documentary strategy was used, with a technique of content analysis, collecting data in available documents. From the literature consulted, a scale was proposed to quantify the focus on innovation. To quantify the efficiency scores, Data Envelopment Analysis was used through Frontier Analyst software, based on accounting data. The main results with the scale of innovation indicate low focus on innovation in the companies surveyed. When there is no significant correlation between the innovation scores and the economic efficiency scores, other existing studies point out that, in Brazil, innovation efforts, in addition to being incipient, seek to comply with the relevant legislation rather than the benefits of innovation.
According to Agustoni and Maretti (2012), the use of energy and the tecnological progress involving electrical energy influences the whole organization of society. Among the problems are environmental impacts generated by the activity and supply deficiency and quality of the distributed energy. As mechanisms to solve such issues, there are movements on sector regulation and investments in technological innovation to improve the efficiency of the system. In Brazil, the1990 were a milestone in the development of the sector. Daza (2014) explains that, in order to improve the quality of energy without compromising companies development, some laws have regulated the concession of public services, and among them, Law 9.427/96 established the National Electric Energy Agency (known in Brazil as ANEEL). For Rocha Pinto and Maisonnave (2012), this movement in the 90s resulted in regulations for compulsory investments in R&D instituted by Law 9991/2000 and amended by Law 12,212/2010. But such actions did not have positive effects. Between 2001 and 2002 Brazil had problems, facing rationing in the energy supply. Nevertheless, Pinheiro (2012) reports that in 2009, 2010 and 2011, Brazil again suffered interruptions in energy supply.
On the other hand, when a private company operates a business, it seeks to obtain a return on the investments made, in order to guarantee its sustainability. Thus, when society needs quality energy and investors aim returns on investments, a trade-off between investing in innovation and being efficient is perceived. Therefore, the research problem is whether the focus on innovation in this segment is related to the economic efficiency of companies. To answer this question, this study aims to verify the relationship between innovation and efficiency.
This research contributes to the academic environment by seeking to understand if efforts in innovation are related to improvement in business efficiency. It also provides insights to reinforce or refute relationships between innovative and efficient strategies, whether for incompatibility (Mintzberg, 1979; Porter, 1980) or compatibility (Claver-Cortés, Pertusa-Ortega, & Molina-Azorín, 2012; Liu & Leitner, 2012; Miles, Snow, Meyer, & Coleman Junior, 1978; Tushman & O’Rreillt, 1996). Professionally, it adds new perspectives for managers and investors to evaluate the effectiveness of their innovative actions. Investors can use as a guide to identify companies that are better able to integrate innovation and efficiency.
This paper is set up in five sections. This first introduces the subject, showing contextualization and objectives. In the second, the literature review is brought, treating about innovation and efficiency. The third presents the methodology used. In section four, the results are presented, as well as discussions of the evidences found. Section five concludes. Finally, the references are listed.
Theoretical backgroundInnovationSchumpeter (1928) initially addressed the theme of innovation in explaining it as the cause of the economic instability of the capitalist system, which is constantly transformed by adapting to the disruptions in society. Schumpeter (1928) also classified it in primary and secondary. Other authors (Andriopoulos & Lewis, 2009; Liu & Leitner, 2012) classify them as radicals or incremental. While primary or radical innovations are breakthrough innovations in a system, such as Christensen (2002) adduces the term “disruptive innovation,” secondary or incremental innovations are improvements in things that already exist.
Whether for Schumpeter (1928) innovation is when an invention is accepted by the users, for Sawney, Wolcott, and Arroniz (2006) it is only valid if it creates value for someone: the organization, its customers or the society. Turning to the concept of demand, Stefano, Gambardella, and Verona (2012) point to the relevance of the requirements of the demand on creation of innovations; however, there is no use of high technology if there is no demand, as there is no point in having demand if the technological developments were not made.
The technological innovation is considered a conductor of economic development (Archibugi & Coco, 2004; Baumol, Litan, & Schramm, 2007). It occurs essentially when, from the development of new technologies, firms develop new products or processes for the market (Winter, 1988). The probability of firms creating technological advance is according to technological levels previously reached by them (Dosi, 1988).
Schumpeter (1928) also pointed the risks of the innovative process. If an innovation does not generate benefits for users, it would be no more than an invention, which, without utility, would cause losses. Thus, Kotler (1964) associated two risks of the innovative process: (1) reach a point of the project's development where technical unfeasibility is perceived; and (2) once completed, the project is not accepted by the consumer market as expected.
In order to increase the probability of success in innovation, some authors works with models that encompass departments organized with human, financial, and management tools (Christensen, 2002; Carvalho, Santos, & Barros Neto, 2013). However, Eggink (2012) and Santos, Basso, and Kimura (2014) argue that there are no better or worse models. The reasons are the lack of a unique concept about innovation, heterogeneous characteristics, difficulty to define and measure variables and lack of statistical clarity of the impacts that innovations can cause. For Frezatti, Bido, Cruz, and Machado (2014), evaluating innovation management with more than financial indicators is fundamental, since perspectives expressed in other dimensions such as clients, processes and learning can show relevant performance information in the long run over the short term. The evaluation of business efficiency may be an evidence of how good its management is. Hence, innovation's logic must be tied into a concept of organizational efficiency, which is a topic discussed below.
EfficiencyEfficiency represents the number of outputs that a system can get from a particular combination of inputs. The relationships involving inputs and outputs are called the production function (Farrell, 1957). Pindyck and Rubinfeld (2010) explain the production function showing possible variations of two inputs in relation to production: q=F (K, L). The amount produced (q) varies in function (F) of the inputs capital (K) and labor (L). Charnes, Cooper, and Rhodes (1978), based on the work of Farrell (1957), developed the Data Envelopment Analysis (DEA) methodology. The DEA indicates that the efficiency of a Decision Making Unit (DMU) is the ratio between all weighted sum of the outputs divided by the weighted sum of the inputs, and the result cannot be greater than one (100%).

The weights express each variable's importance (output or input), none of which will be considered irrelevant. DMUs located at efficiency's border are considered efficient and have score one (or 100%). DMUs with scores lower than one (<100%) are considered inefficient and are outside efficiency's border (Charnes et al., 1978). This indicator expresses the technical efficiency when inputs and outputs are physical measures or economic efficiency when inputs and outputs are financial measures. The CCR model (Charnes et al., 1978) provides constant returns in which changes in input's amount causes proportional changes in production. The BCC model (Banker, Charnes, & Cooper, 1984) provides variable returns in which changes in inputs can disproportionately change the quantity produced.
Farrell (1957) indicated that companies located on the efficiency's border were productivity benchmarks. Companies below the border can compare their production levels with companies located on the border. All of this in order to evaluate managerial aspects of production aimed to improvement, which was later called benchmarking. Inefficient firms can seek input or output improvements. The first suggests producing the same amount with fewer resources. The second suggests producing more with the same resources (Pinheiro, 2012).
In regarding to the management of economic efficiency, the focus is on reducing expenses that are related to the revenues. This presupposes on, not necessarily, reducing costs, but also leveraging revenues, which could come from investments in innovation. Therefore, there are administrative theories putting innovation and efficiency as trade-offs.
Innovation versus efficiencyThe strategic typologies presented in Fig. 1 make sense when compared in the focus dimension, that is, vertically. When horizontally compared (making the differentiation between the types of focus), strategies for innovation become incompatible with strategies focused on efficiency.

While prospecting companies focused on exclusivity/differentiation aim to create innovations and offer products/services with higher added value allowing the charge of higher prices, defending companies focus on standardization in order to improve their margins of profitability with cost reductions. Contradicting Mintzberg (1979) and Porter (1980), who argue that innovative strategies are incompatible with effective strategies, Miles et al. (1978) suggest the Analyst typology, where the organization manages to bring together characteristics of defenders and prospectors. While for Miles et al. (1978) analysts can achieve efficiency and innovation, for Porter (1980), this means “middle ground” positioning that can lead to loss of profitability. Other studies advocate “ambidextrous” strategies (Andriopoulos & Lewis, 2009; Liu & Leitner, 2012; Tushman & O’Rreillt, 1996) or “hybrids” (Claver-Cortés et al., 2012). These authors agree with Miles et al. (1978), because the ambidextrous strategy allows gains in innovation and in efficiency at the same time.
Innovation and efficiency on the electric sectorIn Brazil, there are some disincentives to innovation practices in the electricity sector. As for the distribution segment, Aneel's regulation causes a monopoly market, which does not induce risks of commercial competitiveness to the concessionaires/permit holders – at first. As for the production chain there is the fact that these companies are consumers of technologies. Hence, the interest in the development of R&D gets on the electric equipment manufacturers, which are generally large non-Brazilian multinationals (Oliveria, 2011).
Consequently, as Cunha, Silva, Dias, and Girardi (2008) affirm, while in Brazil investments in research and development of innovation in the electric sector are based on the concern to attend the legislation, in the United States managers seek to find sustainable alternatives to improve the Performance of companies. Several studies such as Fernandino and Oliveira (2010), Ziviani and Ferreira (2013) and Carvalho et al. (2013) confirm the Brazilian case by associating the sector's innovation system with law 9.991/2000 that regulates minimum investments in R&D. This can be explained by statements such as the ones proposed by Barros, Claro, and Chaddad (2009) that associate this law as the only incentive to innovation in the sector in Brazil.
Therefore, this explains, at least partially, why 25% of R&D projects between 2000 and 2007 in Brazil referred to strategic research, since in the respective manual this includes generic subjects (Guedes, 2010). In addition, the results of R&D have been mostly methodology proposes and managements processes software's that, according to the understanding of innovation, are considered incremental innovations (Oliveria, 2011).
Table 1 resumes some studies that help the understanding of the environment that guides the management of innovation and efficiency in electricity distribution companies. The search for international works was carried out in scientific databases such as Ebscohost, Science Direct, Emerald and Jstor. National works were selected with searching engines such as Scielo and Google Scholar.
Related studies.
| Authors | Objective and methodology | Main contributions |
|---|---|---|
| Jasmab and Pollitt (2008) | It examines the decline of investments in R&D area, following the regulation of the UK electricity sector. | - Regulation is one of the causes, given the new rules of competition, separation of ownership of companies, pressures to improve profitability in short term. |
| Barros et al. (2009) | Multiple case study. Compares public innovation policies in the IT sector in the Manaus free zone and in the Brazilian electricity sector. | - Law 9.991/2000 is the only incentive for innovation to the electric sector in Brazil. - Excessive bureaucracy and regulatory instability stall the progress of projects. - Little external disclosure of results. |
| Fernandino and Oliveira (2010) | Multiple case studies in 2007 in four companies in the Brazilian electrical sector to identify organizational architectures adopted to manage R&D programs. | - Difficulties on internalization and practical application of products resulting from R&D, indicating management failures. - Lack of structure in processes to manage the stages of R&D projects, which is a bottleneck for companies. - There is a lack of personal incentives for the creation of a culture focused on innovation, which does not attract the staff. |
| Pinheiro (2012) | Documentary study between 2007 and 2010 with 48 electric power distributors to determine the relationship between economic efficiency and quality of energy supplied. | - The efficiency of the companies including variables of quality and only variables of costs were verified. There was no correlation between companies that were more efficient in the economic model and companies that were more efficient in the model with quality variables. |
| Rocha Pinto and Maisonnave (2012) | In 2007, interviews with R&D managers from seven companies in the Brazilian electricity sector to investigate the influence of innovation on R&D projects in the sector. | - There is no agreement on the meanings of innovation. - The dynamics of the regulation of the sector and the lack of interest of the employees causes isolation of the R&D area. - The mismatch between external technological supply and company interests prejudice R&D projects. - Lack of alignment of interests between companies and ANEEL. |
| Ziviani and Ferreira (2013) | Survey with 120 managers of the R&D area of companies of the Brazilian electrical sector to verify difficulties of innovation management. | - Internally, the main obstacle is organizational culture. The resistance to changes and low qualification of human resources. - Externally, the economic risks inherent in the infeasibility of R&D projects. |
| Carvalho et al. (2013) | Action-research between 2007 and 2010 at Companhia Energética de Brasília to verify the effectiveness and efficiency of the company's R&D management. | - Disorganization and lack of involvement of top management and innovative culture by employees pressures for misalignment and R&D projects without effective results. - Sectoral laws hamper the management of R&D and innovations. - Imposition of ideas of external agents without applicability to the actual operations of the company. |
| Martins (2014) | Documentary survey to analyze the relative economic efficiency of Brazilian electricity distributors in 2012. | - The human development index, the size of the grant area, the size of the network and the population density are not explanatory factors of efficiency. - Total active and net revenues define efficiency. The inefficient companies need to reduce fixed assets and improve their results for the period. |
| Pfitzner et al. (2014) | Documentary research in base years 2000, 2008 and 2012 to investigate the R&D dynamics of four Brazilian electric companies. | - The minimum guarantee of return on investment dictated by ANEEL and the lack of competition discourage innovation. - Companies’ investments in R&D have grown, but patents have declined in the last five years. - There is no evidence of a correlation between investments in R&D and improvement in the performance of the Brazilian electricity system. |
It should be noted that R&D projects are not confused with energy efficiency projects, which refers to social programs that encourage different classes of consumers to use electricity in more rational and economic ways, not relating to the business efficiency subject.
MethodologyThe technical procedure used to raise the data was documentary research since the data were collected in Accounting Statements and Administration Reports (RAs) (Gil, 2008). The descriptive objective sought interpretations to report the relationship between innovation and efficiency of the selected companies. The problem was addressed quantitatively, once the statistical method was used (Gray, 2012) – in this case, correlation.
To select the population, BM & FBovespa data from the end of 2013 indicated 66 companies in this segment. As the DEA methodology requires the homogeneity of the DMUs and the input and output variables (Charnes et al., 1978), were kept also the companies that were exclusive of distribution – 20 of them (Table 2).
Energy distribution companies.
| Initials | Company |
|---|---|
| AESsul | AES Sul Distribuidora Gaúcha de Energia S.A. |
| Ampla | Ampla Energia e Serviços S.A. |
| CEEE-D | Cia Estadual de Distribuição de Energia Elétrica |
| Celpa | Centrais Elétricas do Para S.A. |
| Celpe | Cia Energética de Pernambuco |
| Cemar | Cia Energética do Maranhão |
| Cemat | Centrais Elétricas Mato-grossenses S.A. |
| Cemig | Cemig Distribuição S.A. |
| Coelba | Cia de Eletricidade Estadual da Bahia |
| Cosern | Cia Energética do Rio Grande do Norte |
| Coelce | Cia Energética do Ceara |
| CPFL | Cia Paulista de Forca e Luz |
| EBE | Bandeirante Energia S.A. |
| Elektro | Elektro Eletricidade e Serviços S.A. |
| Eletropaulo | Eletropaulo Metropolitana Eletricidade de São Paulo S.A. |
| Enersul | Empresa Energética de Mato Grosso do Sul S.A. |
| Escelsa | Espirito Santo Centrais Elétricas S.A. |
| Light | Light Serviços de Eletricidade S.A. |
| Piratininga | Cia Piratininga de Forca e Luz – CPFL Piratininga |
| RGE | Rio Grande Energia S.A. |
The scale of innovation used stems from the need to assign a note to the level of innovation of companies. Other studies have used different sources of evidence – not available for this research (Cavalcante & De Negri, 2013; Saunila & Ukko, 2012; Sawney et al., 2006). The solution was based on the formulation of research questions based on the innovation literature. By formulating the questions, discrete scores were set from 0 to 2 for each question: 0 is when there is no information; 1 when there is subjective evidence or no evidence goes beyond, and 2, when there is more than one evidence or there, is detailed evidence that answers the question. The result is a scale of innovation grade indicators for each company/year (DMU). Of the values invested in R&D, a traditional indicator of innovation declined due to lack of information in several RAs, which made comparison impossible (Table 3).
Innovation scale forming questions.
| Questions | Source |
|---|---|
| I. Are there specific topics to report practices or investments in R&D/innovation? | Brasil (2014) |
| II. Are there any reports of innovations that have significantly changed the operation of the segment? | Schumpeter (1928), Andriopoulos and Lewis (2009), Liu and Leitner (2012) |
| III. Outside of R&D section, are there other reports of investments or innovation practices? | All |
| IV. Is there disclosure of investments or personnel training practices? | Christensen (2002), Santos et al. (2012) |
| V. Is there disclosure of people allocated in innovation and their respective formations? | Cavalcante & De Negri (2013), Christensen (2002), Santos et al. (2012) |
| VI. Are there reports of joint efforts in innovation/R&D? | Badiola-Sanchez and Coto-Millán (2013), Tidd (2014), Santos et al. (2012) |
| VII. Are there reports of patent registration or incremental revenue? | Eggink (2012) |
As for the indicators that formed the efficiency variable, the dissertations of Pinheiro (2012) and Martins (2014) were used as the basis. Other efficiency variables were discarded because they either represent an indicator, such as Ebitda (Martins, 2014) or represent technical indicators, such as a number of consumer units (Pinheiro, 2012). The active financial indicator of the concession was grouped with fixed assets because it had a high correlation (0.97) with total assets. Financial costs and revenues were discarded as they made some inefficient DMUs and not related to the operational aspects of the companies (Table 4).
Efficiency indicators.
| Dimension | Specific indicators | Groundwork | Authors |
|---|---|---|---|
| Inputs | Total active | Total application of resources | Pinheiro (2012), Martins (2014) |
| Operational costs | Operational costs incurred | Pinheiro (2012) | |
| Operational expenses | Operational expenses incurred | Pinheiro (2012) | |
| Outputs | Net revenue | Billing capability | Pinheiro (2012), Martins (2014) |
Regarding innovation data, these were obtained by reading and by the content analysis of the RAs that resulted from Empresas.net software. In this content analysis, terminologies that indicated advantages for the company, clients, employees, and society were analyzed, as well as if the new actions were radical or incremental. Thus, variations of the searched terms referred to improve, automation, modernization, technology, improvement, implantation, creation, innovation, investments, projects, launches, adoption, institute, R&D, research, and development.
Efficiency variables’ data were collected from the accounting statements but were also made available by Empresas.net. Efficiency data were handled using the DEA method with the Frontier Analyst software from which the scores were obtained. DEA model was chosen because of arguments such as the ones like Celen (2013) and Pinheiro (2012). According to Celen (2013), the DEA model plus the Stochastic Frontier Analysis (SFA) model are the most popular to practice benchmarking of production performance between analysis units. However, while the DEA model has the advantage of not requiring any limitation on the production function, the SFA model requires high correlation in the efficiency border. Pinheiro (2012) supports that the advantage of the DEA model is the possibility of comparing inefficient firms with efficient companies, even if their application is restricted to companies of the same segment that have equal activities and have equal input and output variables.
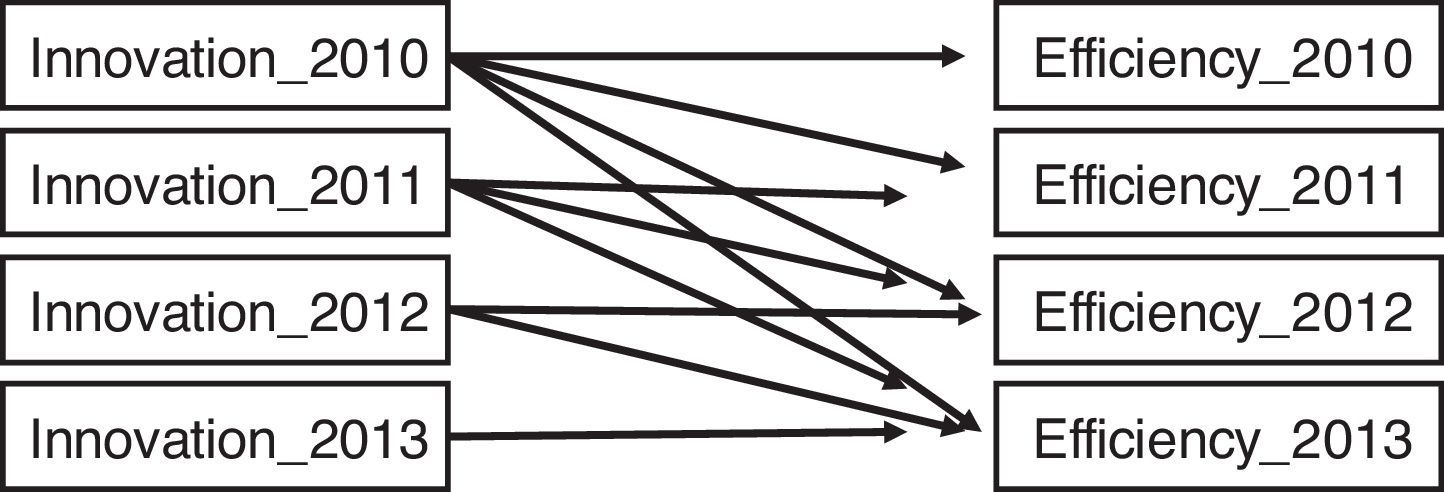
Finally, having the scale of innovation and the efficiency scores, Eviews was used to estimate the correlations (Fig. 2).

This statistical process of repeated cross-sections was chosen from regression techniques for the following reasons: (1) Simple or multiple regression techniques do not support analysis of observations that regard integrated time series with series of individuals; (2) Considering the previous argument, it should be used panel data regression, however, this supposes the use of independent variables to explain the dependent variable (OCDE, 2005), which does not apply for the purpose of this study.
Also, the relations between innovation and quality indicators were analyzed, and, among them, the ECD (Equivalent Continuity Duration) and ECF (Equivalent Continuity Frequency). The first one registers the number of annual hours the consumer was without electricity and the second how many times those lack occurred (Rempel, 2013).
DiscussionsEfforts in innovationThe found evidences reinforce national authors (Carvalho et al., 2013; Cunha et al., 2008; Fernandino & Oliveira, 2010; Ziviani & Ferreira, 2013) who support that innovation investments (or R&D) in Brazil are focused on legal services (Law 9991/2000) faced with the search for the benefits provided by innovation.
This is due to the fact that only one company (Cemig) of the 20 analyzed uses the term “innovation” in the title of the RA section that deals with R&D; The other companies, by not making a proper association, point to the understanding that investing in innovation is only important to comply with the laws.
Another explanation is the low number of reports that characterize innovations. From the total of 560 questions asked (seven questions for 80 DMUs), 392 zeros (70%), 81 1 (14%), and 87 2 (16%) occurred. Only seven DMUs (8.75%) scored seven, or 50% of the 14 possible points to obtain. Although no DMU has scored on three of the seven questions, which contributes to overall low scores, it is also possible to perceive parity between subjective discourses (score 1) in relation to the detailed discourses (score 2). This reinforces Eggink (2012), who says that there is no worse or better model for managing and evaluating innovation. These numbers may indicate a lack of clarity of the meaning of innovation. Next, the questions of scale are analyzed.
Question I – Are there specific topics to report practices or investments in R&D/innovation? Although Law 9991/2000 makes it compulsory for companies in the electric sector to invest a minimum percentage of revenue in R&D programs, which is associated with research and implementation of innovation projects, companies are free to disclose such information (Fipecafi, 2013). The result shows companies not bothering to push innovation or R&D efforts, as only 45% or 36 DMUs have opened specific topics in RAs. Only 14 of these (18%) report specifically projects or actions related to innovations. If for Silva and Rodrigues (2010) RA is an important informational mechanism, and if companies are underestimating their use, then these numbers may indicate that the findings of Barros et al. (2009), that companies do not bother to disclose their efforts in innovation to society.
Question II – Are there any reports of innovations that have significantly altered the operation of the segment? Having only equal answers zero, then Merton (2013) corroborates that the idealizers of the innovative process must consider the structural conditions of the business environment since it has no point to offering a new way to distribute electricity if the conditions are strictly tied to the national system of electrical networks. What Christensen (2002) advocates as key-success-factors to leverage the innovative process, becomes, for the electric distribution segment, only partially true, since, being the only distribution form (electrical networks) and the grant areas being regulated, it becomes difficult for a company to develop destabilizing innovations in the market and to change business conditions. Hence, companies in this segment need to leverage their capabilities around secondary (Schumpeter, 1928) or incremental (Andriopoulos & Lewis, 2009; Liu & Leitner, 2012) innovations.
Question III – VIII Outside of R&D section, are there other reports of investments or innovation practices? The answers indicate that 75 (94%) DMUs report innovative practices. There is only evidence of incremental innovations, in this case, as (a) in administrative processes (mainly customer service and personnel management), and (b) in technical processes (mainly investments in more technological equipment). On the other hand, five DMUs restrict the disclosure of RA to technical accounting information and other few management information. As Jiménez-Jiménez and Sanz-Valle (2011) discuss, the companies under analysis have actions in innovative practices, both technical and administrative, even at a low level. Then, considering the typologies suggested by Harrington and Voehl (2013), they include innovations of productive processes (the technical activity of distribution of energy), managerial and of the market, but do not include innovations of products/services.
Question IV – IX Is there disclosure of investments or personnel training practices? The results indicate a low level because 41 DMUs (51%) do not report training practices and educational advancement. In 14 of them (18%) there are subjective or generalist reports. In only 25 (31%) there are reports of such practices with specifications of which correspond or aggregate to the company.
Question V – Is there disclosure of people allocated in innovation and their respective formations? No company in any of the periods analyzed disclosed information about staff composition and professional skills indicating that the information is not relevant to stakeholders. The low index of answers of questions IV and V reinforce findings of Fernandino and Oliveira (2010), Rocha Pinto and Maisonnave (2012), Ziviani and Ferreira (2013), and Carvalho et al. (2013) that companies in the electricity sector lack organizational culture and personal incentives to overcome the obstacles of resistance to changes caused by innovation; as well as internal norms to manage it (Hogan & Coote, 2014).
Question VI – Are there reports of joint efforts in innovation/R&D? Of the analyzed DMUs, 62 (78%) don’t report practices of joint efforts with other institutions for the development of innovations. This may indicate that, in making their RAs, managers do so to comply with accounting and legal standards. Thus, either they ignore the importance on RA, defended by Silva and Rodrigues (2010), or do not actually joint efforts in innovation, contrary to what the researches of Badiola-Sanchez and Coto-Millán (2013) and Tidd (2014) revealed about the benefits of joint efforts. This can be explained by the lack of coordination between external technological supply and corporate interests in R&D (Rocha Pinto & Maisonnave, 2012), as well as the imposition by external agents of ideas without practical operationalization to the real operations of the companies (Carvalho et al., 2013).
Question VII – Are there reports of patent registration or incremental revenue? This is another information that is not available, and the answer corroborates with Pfitzner, Salles-Filho, and Brittes (2014) that the amount of patent registration in the Brazilian electric segment has declined in recent years.
It is to be expected that any innovation brings benefits to a company. More than being patented and worked to generate economic and financial returns, they should be disclosed by the companies that own/implement the mentioned innovation. However, considering the low level of evidence reporting that characterizes innovations, as verified by the proposed scale, the findings reinforce other arguments that indicate that innovation efforts in this segment are not being effective in the operational improvement of companies (Barros et al., 2009; Carvalho et al., 2013; Rocha Pinto & Maisonnave, 2012; Ziviani & Ferreira, 2013). But has such a relationship had any effect on the economic efficiency of companies?
Efficiency analysisThe results (Table 5) reflect the level of efficiency or inefficiency and reveal that seven of the 80 DMUs reached 100% score. The other 73 DMUs have proved to be inefficient and need to improve their input/output relationships.
Efficiency scores.
| DMUs efficients | DMUs inefficients | ||||||
|---|---|---|---|---|---|---|---|
| 1° Tertile | 2° Tertile | 3° Tertile | |||||
| DMUs | Scores | DMUs | Scores | DMUs | Scores | DMUs | Scores |
| CPFL_2010 | 100.00 | Coelba_2011 | 99.91 | Ampla_2013 | 92.61 | AESsul_2012 | 87.31 |
| Cemar_2010 | 100.00 | Coelce_2010 | 99.81 | Cemat_2011 | 92.49 | RGE_2013 | 87.05 |
| Coelba_2010 | 100.00 | Elektro_2010 | 99.63 | Ampla_2012 | 92.15 | Cemig_2010 | 86.67 |
| Elektro_2011 | 100.00 | Piratininga_2011 | 99.44 | Celpe_2011 | 91.70 | Enersul_2013 | 86.11 |
| Eletropaulo_2010 | 100.00 | Piratininga_2010 | 99.22 | RGE_2011 | 91.47 | Celpe_2013 | 86.03 |
| Eletropaulo_2011 | 100.00 | Cosern_2010 | 98.71 | Light_2010 | 90.94 | Light_2013 | 85.95 |
| Eletropaulo_2012 | 100.00 | Coelce_2011 | 98.52 | Ampla_2011 | 90.84 | Light_2011 | 85.70 |
| Cemar_2013 | 98.33 | RGE_2010 | 90.57 | Light_2012 | 85.66 | ||
| Cosern_2011 | 97.56 | RGE_2012 | 90.56 | AESsul_2010 | 85.61 | ||
| EBE_2011 | 97.11 | CPFL_2012 | 90.28 | Escelsa_2011 | 85.34 | ||
| Cemar_2011 | 96.54 | Piratininga_2012 | 89.86 | Coelce_2013 | 84.96 | ||
| EBE_2012 | 94.92 | Cosern_2013 | 89.82 | Cemig_2013 | 84.65 | ||
| CPFL_2011 | 94.91 | Celpe_2012 | 88.96 | Cemat_2010 | 84.11 | ||
| Cemar_2012 | 94.71 | Cemig_2011 | 88.96 | Cemig_2012 | 82.55 | ||
| Enersul_2011 | 94.64 | Piratininga_2013 | 88.92 | Celpa_2010 | 82.09 | ||
| Coelba_2012 | 94.53 | Elektro_2012 | 88.81 | Cemat_2012 | 81.30 | ||
| Celpe_2010 | 94.06 | Coelba_2013 | 88.81 | Cemat_2013 | 80.36 | ||
| EBE_2013 | 93.98 | Escelsa_2010 | 88.54 | Celpa_2011 | 77.90 | ||
| AESsul_2011 | 93.44 | Elektro_2013 | 88.04 | AESsul_2013 | 76.62 | ||
| Cosern_2012 | 93.26 | Escelsa_2012 | 88.00 | CEEE_2011 | 74.60 | ||
| Eletropaulo_2013 | 93.08 | Enersul_2010 | 87.94 | Celpa_2013 | 74.29 | ||
| EBE_2010 | 93.02 | Escelsa_2013 | 87.72 | CEEE_2012 | 73.18 | ||
| Coelce_2012 | 92.99 | Enersul_2012 | 87.65 | Celpa_2012 | 70.92 | ||
| CPFL_2013 | 92.69 | Ampla_2010 | 87.45 | CEEE_2013 | 70.75 | ||
| CEEE_2010 | 70.17 | ||||||
Only seven DMUs have achieved efficiency: Eletropaulo was efficient in 2010, 2011 and 2012, but has left the border in 2013, though (Table 5). Among the DMUs with lower levels, CEEE obtained bad indicators in the four years and Celpa had bad indicators in three. Comparing efficient and inefficient DMUs allows to analyze percentages of improvements that each company needs to make in order to get closer to the DMUs that each firm refers to (Table 6).
Efforts toward improvements to which DMUs are submitted to, in order to achieve efficiency, refer to the reduction of inputs – to spend and apply less economic resources (Table 7). The same does not apply to the increment of the revenue output since the DEA model used is oriented to input, which implies looking to produce the same with less.
Correlation between efficiency scores and input improvement percentages.
| Score_Efficiency | Total_Active | Operational_Costs | Operational Expenses | |
|---|---|---|---|---|
| % Total active's improvement | −0.863 | 1.000 | ||
| % Operational Costs’ improvement | −0.977 | 0.836 | 1.000 | |
| % Operational expenses’ improvement | −0.598 | 0.431 | 0.571 | 1.000 |
Considering that Gray (2012) ponders a high correlation for indicators above 0.5, it is perceived that there is an inverted correlation between efficiency scores and the need to the improvement of inputs. Of the three inputs considered, expenditures with operating expenses are the resource most likely to suffer average reduction (18.16%) by inefficient companies compared to their benchmarks, total assets being the second (11.96%) and operational costs the third (10.42%).
Inversely, the inputs that most need improvement are the ones that less contribution has to explain efficiency scores. The contributions are 4.88% (operating expenses), 23.20% (total assets) and 71.92% (operating costs). Complementarily, the efficiency scores are compared with the data obtained from the demographic census (Table 8).
Correlation between efficiency scores and demographic census.
| Efficiency | Consumer_Units | Energy sold (GWh) | Concession area_km2 | Network km | |
|---|---|---|---|---|---|
| Efficiency | 1.000 | ||||
| Consumer Units | 0.206 | 1.000 | |||
| Energy Sold GWh | 0.273 | 0.794 | 1.000 | ||
| Concession area km2 | −0.369 | 0.054 | −0.250 | 1.000 | |
| Network km | −0.094 | 0.652 | 0.162 | 0.469 | 1.000 |
Analyzing the previous correlation indicators, efficiency scores with low correlation with the amount of energy sold (0.273) and the number of consuming units can be perceived. The correlation with the size of the concession area is negatively in the average (−0.369). Additionally, it is expected that companies with a greater number of consumers sell more energy (correlation of 0.794). Therefore, concessionaires with more customers that sell more energy and, at the same time, have smaller concession areas; have lows for medium correlations with efficiency scores. Even though these correlations are not high, they are not statistically non-existent.
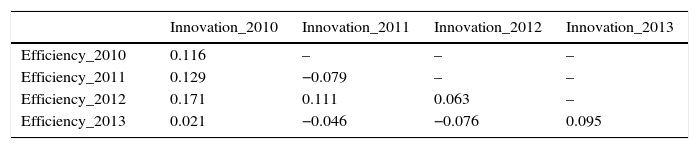
Analysis of the relation between innovation and efficiencyTable 9 shows that there are low correlations between level of innovation and companies efficiency. Therefore, the result that responds to the objective studied is that there was no significant relationship between the variables Innovation and Efficiency in electricity distribution companies in Brazil.
Thus, it can be affirmed that companies that spend more focus on reporting practices and innovative investments in their ARs do not necessarily present better levels of economic efficiency. This reinforces the assertions of Cunha et al. (2008), Fernandino and Oliveira (2010), Ziviani and Ferreira (2013) and Carvalho et al. (2013), that investments in innovation in Brazil are guided by the compliance with the legislation facing the search for the benefits provided by it. In this context, some explanations found in the literature can be associated:
- (1)
In the national context, Barros et al. (2009) found that bureaucratic barriers and instability of legislation and the regulatory body are obstacles to the successful development of innovation activities, although Kimura, Kayo, Pereira, and Kerr (2012) have found no influence of levels of bureaucracy on organizational performance.
- (2)
Fernandino and Oliveira (2010) associate the lack of managerial structure of R&D departments with the inefficiency of innovation actions. For Hogan and Coote (2014), rather than structure and incentive for innovation, companies need to create internal behavioral norms that inspire organizational culture requirements for performance improvement. The low innovation index measured for the research population, especially in issues IV and V of the scale indicates that structural and cultural innovation issues are not points of attention for the companies investigated.
- (3)
Ziviani and Ferreira (2013) highlight the economic risks of the infeasibility of R&D projects. For Carvalho et al. (2013) and Pfitzner et al. (2014), these risks derive from ANEEL standards that discourage innovation, due to excessive rules and minimum guarantees.
- (4)
In the international context, similarly to Brazil, Jasmab and Pollitt (2008) argue that the regulation put pressure on companies in the electric segment for performance improvements and short-term profitability, which according to Frezatti et al. (2014) is discouraging innovation efforts.
These arguments summarized above are plausible explanations for the sector's lack of interest in innovations, since there is a lack of attractive results to the economic performance of companies, especially in the short term.
Regarding the comparisons of innovation scores with DEC (Equivalent Duration of Interruption per Consuming Unit) and FEC (Equivalent Frequency of Interruption per Consumer Unit) quality indicators, Table 10 is presented. The results indicate that 75 of the 80 DMUs studied invests in the distribution system with the application of equipment with greater technological advancement (point III of the innovation scale). The explanation for this almost null correlation would be the ineffectiveness of the result expected by the practice.
Correlation between innovation scale and quality indicators.
| Innovation_2010 | Innovation_2011 | Innovation_2012 | Innovation_2013 | |
|---|---|---|---|---|
| DEC_2010 | 0.017 | – | – | – |
| DEC_2011 | −0.012 | 0.025 | – | – |
| DEC_2012 | −0.023 | 0.014 | −0.075 | – |
| DEC_2013 | −0.016 | 0.056 | −0.050 | 0.018 |
| FEC_2010 | −0.065 | – | – | – |
| FEC_2011 | −0.061 | −0.032 | – | – |
| FEC_2012 | −0.068 | −0.034 | −0.119 | – |
| FEC_2013 | −0.074 | −0.012 | −0.107 | −0.084 |
The correlations between efficiency and quality indicators are negatively averages for highs (Table 11). The relation that is presented when the data is former is that the efficiency of a given year has a negative correlation with quality indicators of the following years.
Correlation between efficiency and quality indicators.
| Efficiency_2010 | Efficiency_2011 | Efficiency_2012 | Efficiency_2013 | |
|---|---|---|---|---|
| DEC_2010 | −0.401 | – | – | – |
| DEC_2011 | −0.375 | −0.524 | – | – |
| DEC_2012 | −0.401 | −0.546 | −0.655 | – |
| DEC_2013 | −0.463 | −0.594 | −0.678 | −0.538 |
| FEC_2010 | −0.473 | – | – | – |
| FEC_2011 | −0.445 | −0.553 | – | – |
| FEC_2012 | −0.472 | −0.563 | −0.702 | – |
| FEC_2013 | −0.548 | −0.604 | −0.737 | −0.588 |
These correlations (Table 11) can be explained by the fact that smaller DEC and FEC correspond to lower sales losses and lower costs in solving technical problems. This contradicts Pinheiro (2012), who argues that there is no correlation between the level of energy quality distributed with the economic efficiency of the companies.
Other than DEC and FEC indicators, the efficiency scores presented relevant correlations with performance indicators (Table 12). This evidence of a correlation between efficiency scores and performance evaluation indicators reinforces the understanding that companies that are more efficient with the DEA methodology are the most profitable ones, and also the ones that achieve greater cash generation (Ebitda). This is logical from the economic point of view, because greater efficiency means better use of resources, reducing costs, increasing revenues, or both, improving profitability.
Correlation between efficiency scores and performance indicators.
| Efficiency_2010 | Efficiency_2011 | Efficiency_2012 | Efficiency_2013 | |
|---|---|---|---|---|
| Profitability_2010 | 0.898 | – | – | – |
| Profitability_2011 | 0.784 | 0.909 | – | – |
| Profitability_2012 | 0.646 | 0.700 | 0.793 | – |
| Profitability_2013 | 0.686 | 0.514 | 0.714 | 0.765 |
| Rentability_2010 | 0.926 | – | – | – |
| Ratability_2011 | 0.836 | 0.942 | – | – |
| Ratability_2012 | 0.680 | 0.706 | 0.779 | – |
| Ratability_2013 | 0.703 | 0.532 | 0.711 | 0.768 |
| Final_Result_2010 | 0.705 | – | – | – |
| Final_Result_2011 | 0.614 | 0.639 | – | – |
| Final_Result_2012 | 0.592 | 0.615 | 0.706 | – |
| Final_Result_2013 | 0.567 | 0.394 | 0.551 | 0.652 |
| Ebtida_2010 | 0.531 | – | – | – |
| Ebtida_2011 | 0.444 | 0.414 | – | – |
| Ebtida_2012 | 0.473 | 0.405 | 0.506 | – |
| Ebtida_2013 | 0.440 | 0.258 | 0.363 | 0.525 |
However, like the DEC and FEC indicators, the innovation variable did not correlate significantly with economic-financial performance indicators (Table 13). Although there are low and medium correlations, they are isolated. There is also no evolution of correlations over time.
Correlation between innovation scale and performance indicators.
| Innovation_2010 | Innovation_2011 | Innovation_2012 | Innovation_2013 | |
|---|---|---|---|---|
| Profitability_2010 | 0.301 | – | – | – |
| Profitability_2011 | 0.144 | 0.021 | – | – |
| Profitability_2012 | −0.002 | −0.052 | 0.036 | – |
| Profitability_2013 | 0.113 | 0.029 | 0.084 | 0.145 |
| Rentability_2010 | 0.279 | – | – | – |
| Ratability_2011 | 0.138 | −0.060 | – | – |
| Ratability_2012 | 0.012 | −0.070 | 0.026 | – |
| Ratability_2013 | 0.133 | 0.015 | 0.086 | 0.139 |
| Final_Result_2010 | 0.243 | – | – | – |
| Final_Result_2011 | 0.164 | 0.041 | – | – |
| Final_Result_2012 | −0.100 | −0.166 | −0.095 | – |
| Final_Result_2013 | −0.015 | −0.120 | −0.046 | −0.052 |
| Ebtida_2010 | 0.088 | – | – | – |
| Ebtida_2011 | 0.076 | −0.027 | – | – |
| Ebtida_2012 | −0.164 | −0.242 | −0.162 | – |
| Ebtida_2013 | −0.143 | −0.248 | −0.160 | −0.156 |
There are no significant correlations between innovation focus and performance indicators, except for low and medium correlations, reinforcing the findings of Santos, Basso, et al. (2014) about the heterogeneity and inequality of investments in the innovation of Brazilian companies indicate a negative impact on financial performance. Other studies (Brito, Brito, & Morganti, 2009; Quintella, 2012; Santos, Góis, & Rebouças, 2014) found no positive effects of the innovative effort on the financial performance of companies, even though there is a temporal lag relationship, according to the OECD (2005).
These results are related to the findings of Frezatti et al. (2014), because if managers only gave importance to short-term financial indicators to evaluate innovative performance, then there would be no point in focusing on innovative practices that have no effect on the economic performance of companies. Santos, Góis, et al. (2014) support this argument. For them, innovation is not necessarily beneficial to organizations in the short term.
This low correlation between efforts in innovation and economic performance also indicates that the findings of Barros et al. (2009), for whom innovation projects have often not workability in Brazil, remains valid. This gives more evidences to reinforce the arguments of Cunha et al. (2008), Fernandino and Oliveira (2010), Ziviani and Ferreira (2013) and Carvalho et al. (2013) that the investments in innovation (or R&D) in Brazil are guided by compliance with legislation in the search for the benefits provided by it.
ConclusionsThe findings were that there are low correlations between efforts expended on innovation and the achievement of improvement of efficiency scores in the electricity distribution segment. This was evidenced due to the innovation efforts of the companies studied being incipient and receiving low internal attention. Regarding efficiency, the explanation lies in the correlation between the DEC/FEC quality indicators and the economic efficiency of the companies. Companies with lower frequencies and times of interruption of energy have lower losses of revenues and savings in expenses to solve problems, which in this case are reduced.
Even with the limitations on the use of innovation in scale, the obtainment of only documentary data and the use of correlation that does not guarantee absolute affirmations, this work contributed to the academic environment to reinforce discoveries already pointed out by other studies (Barros et al., 2009; Carvalho et al., 2013; Fernandino & Oliveira, 2010; Frezatti et al., 2014; Pfitzner et al., 2014; Rocha Pinto & Maisonnave, 2012; Ziviani & Ferreira, 2013) as well as to disprove others (Pinheiro, 2012), as well as to disprove others (Pinheiro, 2012).
This research also contributes with managers and investors in the evaluation of companies about their ability to integrate innovative investments and improve efficiency. In this case, not having significant correlations between innovation and efficiency, it is stated that the Brazilian companies in the segment studied have not been able to adhere the ambidextrous strategy (Andriopoulos & Lewis, 2009; Liu & Leitner, 2012; Tushman & O’Rreillt, 1996), corroborating with Miles et al. (1978) about the difficulty of implanting the Analyst positioning.
It also contributes in the social perspective by alerting society, government and regulators that public policies for innovation in the sector are not having an effect on the quality of distributed energy or on the efficiency of companies, indicating that investments in R&D are undertaken only because of legislation.
The contributions are not fully generalizable since the research was limited to the Brazilian electricity distribution segment in the period of 2010/2013. Therefore, the results obtained are subject to such restrictions. In addition, because the DEA is a non-parametric technique, it is restricted to the companies and periods that were studied. Another limitation is related to the fact that it has been evaluated the relative efficiency, not the absolute – which does not allow to affirm that the level obtained by efficient companies is optimal.
For further studies, it would be interesting to make replications of the comparison between efficiency and innovation in companies from other segments. It is also proposed to compare efficiency and other variables, such as level of governance and organizational climate. In addition, the proposition of new data collection procedures to validate the proposed innovation scale would represent a gain on this subject. In this case, if appears a change in scores obtained in innovation, the results can either reinforce or refute the results of this research. Finally, it is proposed the use of other statistical techniques such as multiple regression analysis or panel data. Such techniques would compare the behavior of one variable under the influence of another over time under different perspectives so that new evidence would contribute to the continuity of the understanding of the relationship between innovation and efficiency.
Conflicts of interestThe authors declare no conflicts of interest.
Responses from the Innovation Scale.
| Companies | I. Are there specific topics to report practices or investments in R&D/innovation? | |||||||
|---|---|---|---|---|---|---|---|---|
| II. Are there any reports of innovations that have significantly altered the operation of the segment? | ||||||||
| III. Outside of R&D section, are there other reports of investments or innovation practices? | ||||||||
| IV. Is there disclosure of investments or personnel training practices? | ||||||||
| V. Is there disclosure of people allocated in innovation and their respective formations? | ||||||||
| VI. Are there reports of joint efforts in innovation/R&D? | ||||||||
| VII. Are there reports of patent registration or incremental revenue? | ||||||||
| Grade | ||||||||
| AESsul_2010 | 1 | 0 | 2 | 2 | 0 | 0 | 0 | 5 |
| AESsul_2011 | 1 | 0 | 2 | 2 | 0 | 0 | 0 | 5 |
| AESsul_2012 | 1 | 0 | 2 | 2 | 0 | 0 | 0 | 5 |
| AESsul_2013 | 1 | 0 | 2 | 2 | 0 | 0 | 0 | 5 |
| Ampla_2010 | 0 | 0 | 0 | 0 | 0 | 0 | 0 | 0 |
| Ampla_2011 | 0 | 0 | 2 | 0 | 0 | 0 | 0 | 2 |
| Ampla_2012 | 0 | 0 | 0 | 0 | 0 | 0 | 0 | 0 |
| Ampla_2013 | 0 | 0 | 0 | 0 | 0 | 0 | 0 | 0 |
| CEEE_2010 | 1 | 0 | 2 | 1 | 0 | 0 | 0 | 4 |
| CEEE_2011 | 2 | 0 | 2 | 1 | 0 | 0 | 0 | 5 |
| CEEE_2012 | 1 | 0 | 2 | 1 | 0 | 0 | 0 | 4 |
| CEEE_2013 | 0 | 0 | 0 | 0 | 0 | 0 | 0 | 0 |
| Celpa_2010 | 0 | 0 | 2 | 1 | 0 | 0 | 0 | 3 |
| Celpa_2011 | 0 | 0 | 2 | 1 | 0 | 0 | 0 | 3 |
| Celpa_2012 | 0 | 0 | 1 | 1 | 0 | 0 | 0 | 2 |
| Celpa_2013 | 0 | 0 | 2 | 1 | 0 | 0 | 0 | 3 |
| Celpe_2010 | 2 | 0 | 2 | 2 | 0 | 0 | 0 | 6 |
| Celpe_2011 | 2 | 0 | 2 | 2 | 0 | 1 | 0 | 7 |
| Celpe_2012 | 2 | 0 | 2 | 2 | 0 | 1 | 0 | 7 |
| Celpe_2013 | 2 | 0 | 2 | 2 | 0 | 1 | 0 | 7 |
| Cemar_2010 | 0 | 0 | 1 | 2 | 0 | 0 | 0 | 3 |
| Cemar_2011 | 0 | 0 | 2 | 2 | 0 | 0 | 0 | 4 |
| Cemar_2012 | 0 | 0 | 1 | 2 | 0 | 0 | 0 | 3 |
| Cemar_2013 | 0 | 0 | 1 | 2 | 0 | 0 | 0 | 3 |
| Cemat_2010 | 1 | 0 | 1 | 0 | 0 | 0 | 0 | 2 |
| Cemat_2011 | 0 | 0 | 2 | 0 | 0 | 0 | 0 | 2 |
| Cemat_2012 | 0 | 0 | 2 | 0 | 0 | 0 | 0 | 2 |
| Cemat_2013 | 0 | 0 | 1 | 0 | 0 | 0 | 0 | 1 |
| Cemig_2010 | 1 | 0 | 1 | 0 | 0 | 1 | 0 | 3 |
| Cemig_2011 | 1 | 0 | 1 | 0 | 0 | 1 | 0 | 3 |
| Cemig_2012 | 2 | 0 | 2 | 0 | 0 | 1 | 0 | 5 |
| Cemig_2013 | 1 | 0 | 1 | 0 | 0 | 0 | 0 | 2 |
| Coelba_2010 | 2 | 0 | 2 | 2 | 0 | 1 | 0 | 7 |
| Coelba_2011 | 1 | 0 | 2 | 2 | 0 | 1 | 0 | 6 |
| Coelba_2012 | 1 | 0 | 2 | 2 | 0 | 1 | 0 | 6 |
| Coelba_2013 | 0 | 0 | 2 | 2 | 0 | 1 | 0 | 5 |
| Coelce_2010 | 0 | 0 | 0 | 0 | 0 | 0 | 0 | 0 |
| Coelce_2011 | 0 | 0 | 1 | 0 | 0 | 0 | 0 | 1 |
| Coelce_2012 | 0 | 0 | 1 | 0 | 0 | 0 | 0 | 1 |
| Coelce_2013 | 0 | 0 | 1 | 0 | 0 | 0 | 0 | 1 |
| Cosern_2010 | 2 | 0 | 2 | 2 | 0 | 1 | 0 | 7 |
| Cosern_2011 | 1 | 0 | 2 | 2 | 0 | 1 | 0 | 6 |
| Cosern_2012 | 2 | 0 | 2 | 2 | 0 | 1 | 0 | 7 |
| Cosern_2013 | 2 | 0 | 2 | 2 | 0 | 1 | 0 | 7 |
| CPFL_2010 | 0 | 0 | 2 | 0 | 0 | 0 | 0 | 2 |
| CPFL_2011 | 0 | 0 | 1 | 0 | 0 | 0 | 0 | 1 |
| CPFL_2012 | 0 | 0 | 1 | 0 | 0 | 0 | 0 | 1 |
| CPFL_2013 | 0 | 0 | 1 | 0 | 0 | 0 | 0 | 1 |
| EBE_2010 | 1 | 0 | 2 | 2 | 0 | 1 | 0 | 6 |
| EBE_2011 | 1 | 0 | 2 | 2 | 0 | 0 | 0 | 5 |
| EBE_2012 | 1 | 0 | 2 | 2 | 0 | 0 | 0 | 5 |
| EBE_2013 | 1 | 0 | 2 | 0 | 0 | 0 | 0 | 3 |
| Elektro_2010 | 0 | 0 | 1 | 2 | 0 | 0 | 0 | 3 |
| Elektro_2011 | 0 | 0 | 1 | 0 | 0 | 0 | 0 | 1 |
| Elektro_2012 | 0 | 0 | 1 | 0 | 0 | 0 | 0 | 1 |
| Elektro_2013 | 0 | 0 | 1 | 0 | 0 | 0 | 0 | 1 |
| Eletropaulo_2010 | 2 | 0 | 2 | 1 | 0 | 0 | 0 | 5 |
| Eletropaulo_2011 | 2 | 0 | 2 | 1 | 0 | 0 | 0 | 5 |
| Eletropaulo_2012 | 1 | 0 | 2 | 0 | 0 | 0 | 0 | 3 |
| Eletropaulo_2013 | 1 | 0 | 2 | 1 | 0 | 0 | 0 | 4 |
| Enersul_2010 | 0 | 0 | 2 | 0 | 0 | 0 | 0 | 2 |
| Enersul_2011 | 0 | 0 | 2 | 1 | 0 | 0 | 0 | 3 |
| Enersul_2012 | 0 | 0 | 2 | 1 | 0 | 0 | 0 | 3 |
| Enersul_2013 | 2 | 0 | 2 | 1 | 0 | 1 | 0 | 6 |
| Escelsa_2010 | 1 | 0 | 2 | 0 | 0 | 1 | 0 | 4 |
| Escelsa_2011 | 1 | 0 | 2 | 1 | 0 | 1 | 0 | 5 |
| Escelsa_2012 | 1 | 0 | 2 | 2 | 0 | 0 | 0 | 5 |
| Escelsa_2013 | 2 | 0 | 1 | 0 | 0 | 0 | 0 | 3 |
| Light_2010 | 0 | 0 | 2 | 0 | 0 | 0 | 0 | 2 |
| Light_2011 | 0 | 0 | 2 | 0 | 0 | 0 | 0 | 2 |
| Light_2012 | 0 | 0 | 2 | 0 | 0 | 0 | 0 | 2 |
| Light_2013 | 0 | 0 | 2 | 0 | 0 | 0 | 0 | 2 |
| Piratininga_2010 | 0 | 0 | 2 | 0 | 0 | 0 | 0 | 2 |
| Piratininga_2011 | 0 | 0 | 1 | 0 | 0 | 0 | 0 | 1 |
| Piratininga_2012 | 0 | 0 | 1 | 0 | 0 | 0 | 0 | 1 |
| Piratininga_2013 | 0 | 0 | 1 | 0 | 0 | 0 | 0 | 1 |
| RGE_2010 | 0 | 0 | 1 | 0 | 0 | 0 | 0 | 1 |
| RGE_2011 | 0 | 0 | 1 | 0 | 0 | 0 | 0 | 1 |
| RGE_2012 | 0 | 0 | 1 | 0 | 0 | 0 | 0 | 1 |
| RGE_2013 | 0 | 0 | 1 | 0 | 0 | 0 | 0 | 1 |
Input and output data to measure efficiency.
| DMU | Inputsa | Outputa | ||
|---|---|---|---|---|
| Total assets | Operational cost | Operational expenses | Net incomes | |
| AESsul_2010 | 2,430,053 | 1,693,378 | 1 | 1,866,037 |
| AESsul_2011 | 2,661,628 | 1,652,938 | 1 | 2,027,923 |
| AESsul_2012 | 2,989,756 | 2,083,013 | 1 | 2,341,357 |
| AESsul_2013 | 3,091,616 | 2,060,608 | 1 | 2,072,919 |
| Ampla_2010 | 4,313,606 | 2,399,048 | 294,002 | 3,154,775 |
| Ampla_2011 | 4,658,509 | 2,544,709 | 187,418 | 3,312,371 |
| Ampla_2012 | 5,229,122 | 2,709,667 | 274,915 | 3,690,989 |
| Ampla_2013 | 5,712,410 | 2,832,781 | 268,391 | 3,849,432 |
| CEEE_2010 | 3,771,149 | 1,651,370 | 344,556 | 1,821,539 |
| CEEE_2011 | 3,829,171 | 1,742,720 | 395,281 | 2,028,501 |
| CEEE_2012 | 3,492,784 | 2,020,188 | 224,558 | 2,188,950 |
| CEEE_2013 | 2,997,582 | 2,299,047 | 256,647 | 2,263,719 |
| Celpa_2010 | 4,201,029 | 1,692,834 | 217,222 | 2,110,961 |
| Celpa_2011 | 4,358,111 | 2,032,579 | 296,400 | 2,433,800 |
| Celpa_2012 | 4,518,762 | 2,139,375 | 499,827 | 2,349,951 |
| Celpa_2013 | 4,469,736 | 2,202,237 | 295,326 | 2,494,994 |
| Celpe_2010 | 3,680,215 | 2,014,936 | 252,684 | 2,860,067 |
| Celpe_2011 | 3,820,501 | 2,110,065 | 373,537 | 2,914,133 |
| Celpe_2012 | 3,775,798 | 2,837,100 | 659,520 | 3,545,861 |
| Celpe_2013 | 3,791,353 | 2,666,392 | 400,454 | 3,283,509 |
| Cemar_2010 | 2,781,505 | 1,092,978 | 233,193 | 1,756,353 |
| Cemar_2011 | 2,965,340 | 1,250,669 | 284,420 | 1,912,105 |
| Cemar_2012 | 3,610,523 | 1,576,243 | 292,603 | 2,348,082 |
| Cemar_2013 | 3,615,568 | 1,245,978 | 334,484 | 1,968,774 |
| Cemat_2010 | 3,302,280 | 1,597,452 | 140,470 | 1,956,588 |
| Cemat_2011 | 3,551,439 | 1,451,909 | 163,743 | 2,009,768 |
| Cemat_2012 | 3,822,248 | 1,873,863 | 323,119 | 2,344,799 |
| Cemat_2013 | 3,675,473 | 1,884,791 | 577,363 | 2,312,967 |
| Cemig_2010 | 9,403,439 | 6,123,603 | 789,944 | 7,713,003 |
| Cemig_2011 | 10,477,784 | 6,528,735 | 751,808 | 8,510,128 |
| Cemig_2012 | 11,779,640 | 7,985,881 | 1,021,235 | 9,503,792 |
| Cemig_2013 | 12,497,936 | 7,316,386 | 1,018,137 | 9,205,932 |
| Coelba_2010 | 5,372,695 | 2,902,851 | 357,903 | 4,394,324 |
| Coelba_2011 | 5,891,383 | 3,315,429 | 605,836 | 4,967,359 |
| Coelba_2012 | 6,982,966 | 4,151,685 | 736,044 | 5,813,614 |
| Coelba_2013 | 7,627,195 | 3,626,801 | 637,870 | 4,984,637 |
| Coelce_2010 | 3,075,933 | 2,081,156 | 105,805 | 2,849,706 |
| Coelce_2011 | 3,352,968 | 1,901,117 | 104,753 | 2,627,212 |
| Coelce_2012 | 3,560,488 | 2,204,623 | 146,542 | 2,893,720 |
| Coelce_2013 | 3,371,127 | 2,395,919 | 204,778 | 2,849,743 |
| Cosern_2010 | 1,414,575 | 771,927 | 111,161 | 1,150,843 |
| Cosern_2011 | 1,534,090 | 768,566 | 112,289 | 1,149,671 |
| Cosern_2012 | 1,650,070 | 1,039,307 | 140,501 | 1,418,335 |
| Cosern_2013 | 1,879,804 | 1,017,704 | 153,453 | 1,383,176 |
| CPFL_2010 | 4,750,491 | 4,023,120 | 297,701 | 5,360,015 |
| CPFL_2011 | 5,761,746 | 4,168,231 | 423,057 | 5,594,932 |
| CPFL_2012 | 6,696,446 | 5,229,850 | 596,553 | 6,518,013 |
| CPFL_2013 | 7,178,481 | 4,420,650 | 518,966 | 6,024,019 |
| EBE_2010 | 2,656,839 | 1,871,794 | 159,961 | 2,440,960 |
| EBE_2011 | 2,390,696 | 1,977,454 | 200,085 | 2,584,707 |
| EBE_2012 | 2,401,488 | 2,276,043 | 146,059 | 2,557,089 |
| EBE_2013 | 2,457,370 | 2,104,620 | 201,287 | 2,605,852 |
| Elektro_2010 | 3,242,228 | 2,428,087 | 224,021 | 3,368,855 |
| Elektro_2011 | 3,418,815 | 2,509,999 | 274,314 | 3,564,093 |
| Elektro_2012 | 4,558,718 | 2,846,649 | 195,760 | 3,569,543 |
| Elektro_2013 | 4,601,380 | 2,885,782 | 163,484 | 3,549,334 |
| Eletropaulo_2010 | 10,710,069 | 7,784,122 | 1 | 9,697,157 |
| Eletropaulo_2011 | 11,024,810 | 7,491,065 | 1 | 9,835,578 |
| Eletropaulo_2012 | 11,303,378 | 9,834,719 | 1 | 9,959,198 |
| Eletropaulo_2013 | 10,694,051 | 8,718,588 | 1 | 9,012,207 |
| Enersul_2010 | 1,755,420 | 890,438 | 90,010 | 1,157,009 |
| Enersul_2011 | 1,882,917 | 938,011 | 109,652 | 1,334,601 |
| Enersul_2012 | 2,032,684 | 1,157,491 | 259,976 | 1,517,353 |
| Enersul_2013 | 1,877,509 | 1,155,616 | 291,761 | 1,463,120 |
| Escelsa_2010 | 2,292,522 | 1,314,452 | 109,038 | 1,685,225 |
| Escelsa_2011 | 2,131,585 | 1,340,714 | 127,444 | 1,647,749 |
| Escelsa_2012 | 2,376,182 | 1,596,096 | 56,538 | 1,904,705 |
| Escelsa_2013 | 2,372,139 | 1,643,140 | 141,530 | 2,027,508 |
| Light_2010 | 7,886,476 | 4,480,248 | 557,004 | 6,097,103 |
| Light_2011 | 8,701,072 | 5,112,069 | 713,433 | 6,507,086 |
| Light_2012 | 8,968,355 | 5,291,173 | 515,116 | 6,614,402 |
| Light_2013 | 10,596,246 | 5,240,992 | 573,345 | 6,716,762 |
| Piratininga_2010 | 2,235,605 | 1,807,365 | 152,255 | 2,436,451 |
| Piratininga_2011 | 2,391,639 | 1,815,232 | 186,629 | 2,524,131 |
| Piratininga_2012 | 2,666,486 | 2,052,171 | 273,668 | 2,562,687 |
| Piratininga_2013 | 2,640,008 | 1,986,921 | 287,307 | 2,480,262 |
| RGE_2010 | 2,793,276 | 1,576,448 | 176,626 | 2,125,171 |
| RGE_2011 | 2,832,261 | 1,697,729 | 184,301 | 2,279,458 |
| RGE_2012 | 3,459,757 | 1,950,801 | 230,290 | 2,641,916 |
| RGE_2013 | 3,570,070 | 1,819,589 | 298,803 | 2,421,550 |
Peer Review under the responsibility of Departamento de Administração, Faculdade de Economia, Administração e Contabilidade da Universidade de São Paulo – FEA/USP.