Visceral obesity is one of the most intensely researched cardiometabolic risk factors in recent years; nonetheless, its accurate assessment remains a challenge in regions were socioeconomic conditions hinder the widespread use of diagnostic methods for this purpose, such as imaging tests. In this setting, Visceral Adiposity Index (VAI) may be a useful tool. Thus, the objective of this study was to determine the VAI cutoff in adult population from Maracaibo City, Venezuela.
MethodsThis is a descriptive, cross-sectional study with multi-staged sampling; 2026 subjects of both genders aged ≥18 years were selected from this database and had their VAI calculated. In order to determine VAI cutoffs, subsamples of metabolically healthy and sick individuals were determined, with 599 and 286 subjects, respectively. Gender-specific and general ROC curves were plotted in order to identify the most suitable cutoff according to sensitivity and specificity.
ResultsMedian VAI in the selected sample was 1.67 (0.97–2.78). The optimal cutoff was determined to be 1.91, with 70.3% sensitivity, 70.3% specificity [AUC=0.777 (0.745–0.808)]. No differences were found between genders. Analysis by age revealed VAI to have greater predictive power among subjects aged<30 years (cutoff: 1.53), 78.6% sensitivity, 72.8% specificity [AUC=0.797 (0.709–0.884)].
ConclusionWe suggest a VAI cutoff of 1.9 for define dysfunctional adiposity in our population, with age being an important factor in the epidemiologic behavior of this variable, particularly in younger individuals.
La obesidad central es uno de los factores de riesgo cardiometabólicos emergente más evaluado durante los últimos años, sin embargo, su medición de forma precisa resulta un reto en aquellas poblaciones cuyas condiciones económicas dificultan la realización de métodos diagnósticos complejos, como pruebas de imagen. Por ello el objetivo de este estudio es determinar el punto de corte del índice de adiposidad visceral (VAI) en sujetos adultos de la ciudad de Maracaibo, Venezuela.
MétodosSe seleccionó a 2.026 individuos de ambos sexos, mayores de 18 años, de la base de datos del Estudio de prevalencia de síndrome metabólico en la ciudad de Maracaibo, un estudio descriptivo, transversal, con muestreo multietápico. El VAI se calculó para cada sexo y para la estimación del punto corte se seleccionó a 599 sujetos sanos y 286 enfermos, realizándose curvas COR para identificar el mejor valor de acuerdo con la sensibilidad y la especificidad.
ResultadosEl promedio de VAI en la muestra seleccionada fue 1,67 (0,97-2,78). El punto de corte fue 1,91 (70,3% de sensibilidad y 70,3% de especificidad) con AUC=0,777 (0,745-0,808), sin diferencias en el punto de corte según sexo. En el análisis por grupos etarios la mayor capacidad predictiva fue para el grupo<30 años con AUC=0,797 (0,709-0,884), con un punto de corte de 1,53 (78,6% de sensibilidad y 72,8% de especificidad).
ConclusiónEl punto de corte indicado para VAI en nuestra población es de 1,9; considerando la edad como un factor importante en su comportamiento, especialmente en los grupos más jóvenes.
Obesity is a metabolic disorder with a wide phenotypic variability and a myriad of associated conditions, whose prevalence has risen alarmingly in recent decades, especially in developed countries.1 In 2014, the WHO estimated 13% of the worldwide adult population to be obese, with 39% being overweight.2 Likewise, the Latin American Consortium of Studies on Obesity has estimated the prevalence of obesity to be around 16.1% in this region, based on reports from eight countries in South America and the Caribbean.3 Although Venezuela lacks data on the nationwide prevalence of this disease, the Maracaibo City Metabolic Syndrome Prevalence Study – based on the second most populous city – has found a 33% prevalence of obesity.4
The close relationship between obesity and various cardiometabolic conditions such as Type 2 Diabetes Mellitus (DM2), hypertension (HTN), hyperlipidemia, metabolic syndrome (MS) and hepatic steatosis has led to continuous research in the last decade on the concept of sick adipose tissue.5 Adiposopathy is adipose tissue dysfunction found in genetically and environmentally susceptible individuals, characterized by adipocyte accumulation and hypertrophy of visceral adipose tissue (VAT), which lead to the activation of numerous molecules with proinflammatory and proatherogenic properties in response to various stimuli.6
Therefore, assessment of visceral obesity is key in the evaluation of cardiometabolic risk in daily clinical practice. Various methods may be used for the evaluation of body composition, ranging from simple anthropometric measurement to imaging techniques such as dual-energy X-ray absorptiometry, computerized axial tomography and magnetic resonance imaging, each with specific advantages and disadvantages.7
Given the need to routinely identify individuals in which central obesity may confer an increased cardiovascular risk, the visceral adiposity index (VAI) emerges as a system based on simple anthropometric measures, such as body mass index (BMI) and waist circumference (WC), in conjunction with functional parameters such as serum triacylglycerides (TAG) and high-density lipoprotein-cholesterol (HDL-C), capable of estimating the dysfunctional visceral adiposity related to cardiovascular risk.8
Previous reports in our city indicate a high prevalence of obesity and MS4; thus, the exploration of novel techniques for the early identification of individuals with high cardiometabolic risk represents a priority in our locality. In this scenario, the aim of this study was to determine the VAI cutoff for dysfunctional visceral obesity in the adult population of Maracaibo City, Venezuela.
Material and methodsSample selectionThis report is part of the Maracaibo City Metabolic Syndrome Prevalence Study (MMSPS), a cross-sectional study whose purpose is to identify Metabolic Syndrome and cardiovascular risk factors in the adult population of Maracaibo, the second largest city of Venezuela. The sample (1986 individuals) was calculated based on estimations of the city's population by our National Institute of Statistics (1,428,043 inhabitants for the year 2007). A total of 244 subjects (12%) were added for oversampling, in order to increase accuracy of the estimates obtained from smaller subgroups from the overall sample, amounting to a total of 2230 individuals. Maracaibo is divided in 18 parishes, each of which was proportionally sampled with a multistage cluster method: In the first stage, clusters were represented by sectors from each of the 18 parishes, selecting 4 from each parish by simple randomized sampling. In the second phase, clusters were represented by city blocks within each sector, which were selected by simple randomized sampling using a random number generation tool. All individuals enrolled in the study signed a written consent before physical examination and anamnesis. All procedures were approved by the Bioethics Committee of the Endocrine-Metabolic Research Center “Dr. Félix Gómez”, Maracaibo, Venezuela. Further details of the sampling process have been previously published elsewhere.9
From an overall population of 2230 subjects; 2026 individuals were randomly selected on the basis of availability of insulin determination. For the determination of VAI cutoffs, a reference population was selected (n=885) based on the inclusion criteria shown in Fig. 1. The group of healthy subjects included subjects with HOMA2-IR values <2, and excluded subjects with HTN, diabetes mellitus, ischemic heart disease, heart failure, heart arrhythmias, thyroid disease, liver disease, polycystic ovary syndrome, cerebrovascular disease and history of drug use. On the other hand, the group of sick subjects included those with HOMA2-IR values ≥2 and one of the following disorders: Personal history of HTN, diabetes mellitus, ischemic heart disease, heart arrhythmias or cerebrovascular disease.
Subject evaluationData were collected through completion of a full clinical record carried out by trained personnel, which included interrogation regarding the individuals’ medical history and drug use, as well as their ethnic group, educational status, socioeconomic status, and employment status.
AnthropometryWeight was assessed using a digital scale (Tanita, TBF-310 GS Body Composition Analyzer, Tokyo, Japan), while height was obtained with a calibrated rod; the subjects were barefooted and wearing light clothing at all times. For the quantification of BMI, the [weight/height2] formula was utilized and results were expressed in kg/m2. WC was measured using a calibrated measuring tape in accordance with the anatomical landmarks proposed by the USA National Institutes of Health protocol.10
Laboratory analysisOvernight fasting determination of serum glucose, total cholesterol, TAG, and HDL-C was done with an automated analyzer (Human Gesellschaft fur Biochemica und Diagnostica mbH, Germany); the intraassay variation coefficient for the total cholesterol, TAG, and HDL-C was 3%, 5%, and 5%, respectively. Insulin was determined using an ultrasensitive ELISA double-sandwich method (DRG Instruments GmbH, Germany, Inc.). Homeostasis Model Assessment 2-Insulin Resistance (HOMA2-IR) was calculated using the software supplied by the Oxford Centre for Diabetes Endocrinology and Metabolism available at http://www.dtu.ox.ac.uk/homacalculator/index.php.11
Calibration of the Framingham–Wilson equation and coronary risk categorization for the population of Maracaibo cityFor proper Framingham-Wilson equation calibration,12 the constants in the formula regarding major cumulative coronary events (lethal and non-lethal myocardial infarction (MI), symptomatic and no symptomatic angina) were replaced with the local statistics obtained from the Vital Statistics Yearbook of the State of Zulia from 2008, where the morbidity and mortality for cardiovascular diseases are registered. The subjects were classified in 4 categories: low risk <5%, moderate risk 5–9.9%, high risk 10–19.9%, and very high risk ≥20%, the calibration process has been detailed previously.12
Calculation of visceral adiposity indexVAI calculation was performed with the gender-specific equations proposed by Amato et al.8 (TAG and HDL-C are expressed in mmol/L).
Statistical analysisQualitative variables were expressed as absolute and relative frequencies. VAI values were expressed as medians (p25–p75th) due to the non-normal distribution of this variable, applying Mann–Whitney's U test for comparisons between 2 groups, and Kruskal–Wallis H test for comparisons among ≥3 groups. Data were analyzed with the Statistical Package for the Social Sciences (SPSS) v.21 for Windows (IBM Inc., Chicago, IL).
Because the VAI equations include multiple clinical and metabolic variables, a reference metabolically healthy subsample and a metabolically sick subsample were selected based on certain criteria (Fig. 1), in order to avoid generating autocorrelations when plotting the ROC curves for determination of cutoffs. ROC curves were constructed for each gender using R Project software for Statistical Computing. Several indexes were calculated to assess the optimal cutoff point on the curve and hence the best VAI cut-off value. The Youden Index was calculated using [J = sensitivity + specificity − 1 = S − (1 − Es)],13 by yielding the true positive rate (sensitivity) and false positive rate (1−specificity) when J>1. The minimal cutoff value was calculated using the distance of the point closest to (0.1) on the ROC curve; formula: square root [(1−sensitivity) 2+(1−specificity)2].14 Moreover, positive [sensitivity/1−specificity] and negative [1−sensitivity/specificity] likelihood ratios were calculated to aid in the selection of the cutoff alongside Youden Index; likelihood ratios>1 indicate association with the disease, whereas ratios<1 indicate association with the absence of the disease.15
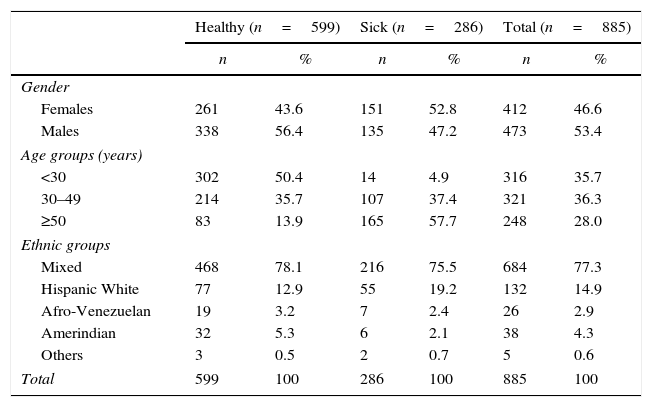
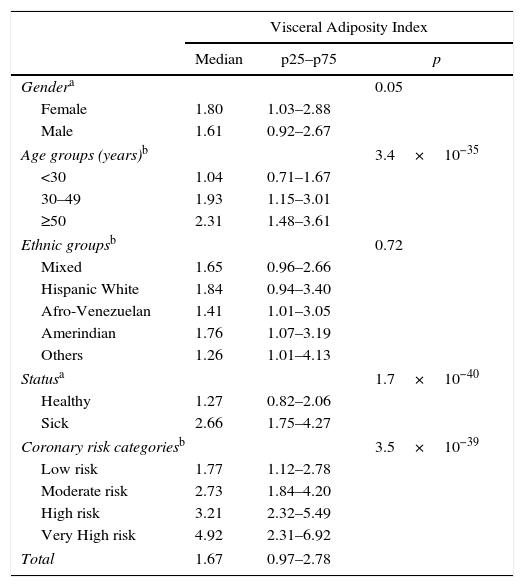
ResultsA total of 885 subjects were studied, 53.4% males (n=473) and 46.6% females (n=412). The mean age was 39.5±15.8 years. The distributions by age and ethnic groups are shown in Table 1. The median VAI in the sample was 1.67 (0.97–2.78); with 1.80 (1.03–2.88) and 1.61 (0.97–2.67) for women and men, respectively; p=0.05. The epidemiologic behavior of VAI by age, ethnic groups, healthy/sick status and coronary risk classification are shown in Table 2.
General characteristics of the reference population. Maracaibo City Metabolic Syndrome Prevalence Study, 2015.
| Healthy (n=599) | Sick (n=286) | Total (n=885) | ||||
|---|---|---|---|---|---|---|
| n | % | n | % | n | % | |
| Gender | ||||||
| Females | 261 | 43.6 | 151 | 52.8 | 412 | 46.6 |
| Males | 338 | 56.4 | 135 | 47.2 | 473 | 53.4 |
| Age groups (years) | ||||||
| <30 | 302 | 50.4 | 14 | 4.9 | 316 | 35.7 |
| 30–49 | 214 | 35.7 | 107 | 37.4 | 321 | 36.3 |
| ≥50 | 83 | 13.9 | 165 | 57.7 | 248 | 28.0 |
| Ethnic groups | ||||||
| Mixed | 468 | 78.1 | 216 | 75.5 | 684 | 77.3 |
| Hispanic White | 77 | 12.9 | 55 | 19.2 | 132 | 14.9 |
| Afro-Venezuelan | 19 | 3.2 | 7 | 2.4 | 26 | 2.9 |
| Amerindian | 32 | 5.3 | 6 | 2.1 | 38 | 4.3 |
| Others | 3 | 0.5 | 2 | 0.7 | 5 | 0.6 |
| Total | 599 | 100 | 286 | 100 | 885 | 100 |
Epidemiologic behavior of Visceral Adiposity Index in the reference population. Maracaibo City Metabolic Syndrome Prevalence Study, 2015.
| Visceral Adiposity Index | |||
|---|---|---|---|
| Median | p25–p75 | p | |
| Gendera | 0.05 | ||
| Female | 1.80 | 1.03–2.88 | |
| Male | 1.61 | 0.92–2.67 | |
| Age groups (years)b | 3.4×10⁻³⁵ | ||
| <30 | 1.04 | 0.71–1.67 | |
| 30–49 | 1.93 | 1.15–3.01 | |
| ≥50 | 2.31 | 1.48–3.61 | |
| Ethnic groupsb | 0.72 | ||
| Mixed | 1.65 | 0.96–2.66 | |
| Hispanic White | 1.84 | 0.94–3.40 | |
| Afro-Venezuelan | 1.41 | 1.01–3.05 | |
| Amerindian | 1.76 | 1.07–3.19 | |
| Others | 1.26 | 1.01–4.13 | |
| Statusa | 1.7×10−40 | ||
| Healthy | 1.27 | 0.82–2.06 | |
| Sick | 2.66 | 1.75–4.27 | |
| Coronary risk categoriesb | 3.5×10−39 | ||
| Low risk | 1.77 | 1.12–2.78 | |
| Moderate risk | 2.73 | 1.84–4.20 | |
| High risk | 3.21 | 2.32–5.49 | |
| Very High risk | 4.92 | 2.31–6.92 | |
| Total | 1.67 | 0.97–2.78 | |
n=885.
ROC curves were constructed for VAI for each gender and in the overall population (Fig. 2). The AUC value of the ROC curve from the overall sample was 0.777 (0.745–0.808); whereas the AUC for females was 0.766 (0720–0813), and 0.785 (0.743–0.827) for males. Selected cutoff points for each ROC curve are shown in Table 3.
Selected Visceral Adiposity Index cutoffs in reference population and by gender. Maracaibo City Metabolic Syndrome Prevalence Study, 2015.
| VAIa | Sensitivity (%) | Specificity (%) | Youden Index | Distance-to-ROC | Positive likelihood ratio | |
|---|---|---|---|---|---|---|
| Females | 1.91 | 70.2 | 69.7 | 0.40 | 0.425 | 2.32 |
| Males | 1.91 | 70.4 | 70.4 | 0.41 | 0.419 | 2.38 |
| All | 1.91 | 70.3 | 70.3 | 0.41 | 0.420 | 2.37 |
n=885.
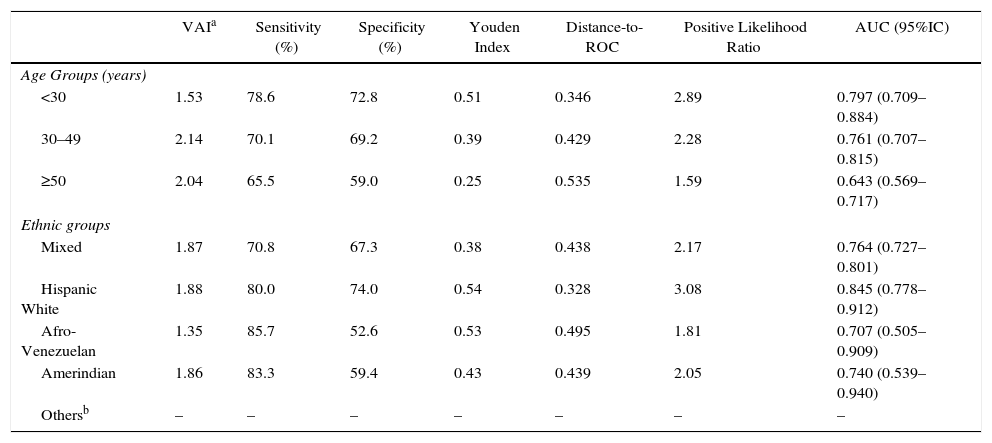
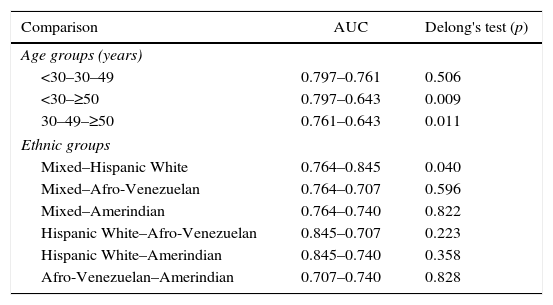
When evaluating VAI by age groups (Fig. 3), the greatest AUC was found in younger subjects [<30 years, AUC=0.797 (0.709–0.884)]. Similarly, Table 4 summarizes VAI cutoffs according to both age and ethnic groups: Lower cutoffs were found in individuals aged <30 years [1.53 (78.6% sensitivity, 72.8% specificity)], and in Afro-Venezuelans [1.35 (85.7% sensitivity, 52.6% specificity)]. Finally, Table 5 exhibits AUC values according to age and ethnic groups; the AUC value found in subjects aged ≥50 years were lower than in any other group [<30 years: 0.797 (0.709–0.884) vs ≥50 years: 0.643 (0.569–0.717); p=0.009] and [30–49 years: 0.761 (0.707–0.815) vs ≥50 years: 0.643 (0.569–0.717); p=0.011].
Selected Visceral Adiposity Index Cuttoff according to age groups and ethnic groups. Maracaibo City Metabolic Syndrome Prevalence Study, 2015.
| VAIa | Sensitivity (%) | Specificity (%) | Youden Index | Distance-to-ROC | Positive Likelihood Ratio | AUC (95%IC) | |
|---|---|---|---|---|---|---|---|
| Age Groups (years) | |||||||
| <30 | 1.53 | 78.6 | 72.8 | 0.51 | 0.346 | 2.89 | 0.797 (0.709–0.884) |
| 30–49 | 2.14 | 70.1 | 69.2 | 0.39 | 0.429 | 2.28 | 0.761 (0.707–0.815) |
| ≥50 | 2.04 | 65.5 | 59.0 | 0.25 | 0.535 | 1.59 | 0.643 (0.569–0.717) |
| Ethnic groups | |||||||
| Mixed | 1.87 | 70.8 | 67.3 | 0.38 | 0.438 | 2.17 | 0.764 (0.727–0.801) |
| Hispanic White | 1.88 | 80.0 | 74.0 | 0.54 | 0.328 | 3.08 | 0.845 (0.778–0.912) |
| Afro-Venezuelan | 1.35 | 85.7 | 52.6 | 0.53 | 0.495 | 1.81 | 0.707 (0.505–0.909) |
| Amerindian | 1.86 | 83.3 | 59.4 | 0.43 | 0.439 | 2.05 | 0.740 (0.539–0.940) |
| Othersb | – | – | – | – | – | – | – |
n=885.
Comparisons of areas under the curves for Visceral Adiposity Index cutoffs according to age groups and ethnic groups. Maracaibo City Metabolic Syndrome Prevalence Study, 2015.
| Comparison | AUC | Delong's test (p) |
|---|---|---|
| Age groups (years) | ||
| <30–30–49 | 0.797–0.761 | 0.506 |
| <30–≥50 | 0.797–0.643 | 0.009 |
| 30–49–≥50 | 0.761–0.643 | 0.011 |
| Ethnic groups | ||
| Mixed–Hispanic White | 0.764–0.845 | 0.040 |
| Mixed–Afro-Venezuelan | 0.764–0.707 | 0.596 |
| Mixed–Amerindian | 0.764–0.740 | 0.822 |
| Hispanic White–Afro-Venezuelan | 0.845–0.707 | 0.223 |
| Hispanic White–Amerindian | 0.845–0.740 | 0.358 |
| Afro-Venezuelan–Amerindian | 0.707–0.740 | 0.828 |
The role of abdominal obesity as a risk factor for cardiovascular disease is well documented,16 being associated with the development of other metabolic disorders such as insulin resistance (IR), DM2, HTN and dyslipidemia, among others,17,18 which increase the risk for cardiovascular events both individually and jointly.
The anatomical location of visceral adipose tissue (VAT) prevents its accurate assessment with simple anthropometric methods (e.g. BMI, WC, hip circumference), which appear insufficient to adequately explore the biologic behavior of visceral adipocytes. Part of this sensitivity problem may be attributed to the existence of metabolic phenotypes that do not correspond to classical views of metabolic health and disease – such as metabolically healthy obese subjects, or metabolically obese normal-weight individuals –, which, although infrequent, may be able to alter the predictive power of these basic diagnostic tools.19 Moreover, in regions with scarce economic resources, such as ours, the routine use of imaging methods for the evaluation of VAT remains unfeasible, given the elevated costs involved and the high prevalence of central obesity described in our previous reports.4
In this setting, VAI represents an useful alternative method that integrates both anthropometric and biochemical variables, and may provide a more complete overview of the VAT functionality and metabolic health of each subject, in a more accessible and cost-effective manner for large-scale applications.20 Likewise, it also shows a tendency to be higher in accordance to coronary risk categories. Although VAI cutoffs have been proposed previously,21 broad biological variability of each component on the equation demands their readjustment according to the sociocultural features and genetic backdrop of each population; in particular because early studies examining VAI have been limited to European Caucasian cohorts. It should also be noted that most studies to date have utilized the presence of MS as the reference variable to determine VAI cutoffs.21,22 We have opted to differ in this regard, as WC, TAG and HDL-C are components of both the criteria for diagnosis of MS and the VAI equations; this coexistence may generate some degree of autocorrelation during analysis. Hence, we avoided the use of these variables in the inclusion criteria for the subsamples in this study.
To our knowledge, this is the first study to propose VAI cutoffs in Latin America. Likewise, to the present, no VAI cutoffs had been posited for specific subpopulations, with the exception of Amato et al., who stratified their results by age.21 Although VAI is computed with gender-specific equations, our findings demonstrated similar cutoffs and predictive capacity for both genders. Thus, we suggest a single VAI value (1.9) for the identification of metabolically sick subjects. This differs from the average value reported by Bozorgmanesh et al. in regards to prediction of DM2.23
Analysis of the biologic behavior of VAI by age groups revealed an interesting difference in regards to predictive capacity, where the AUC was found to be lower in older individuals (aged≥50 years). Indeed, as previously suggested by Amato and Giordano, VAI may be most useful in younger populations.20 Similarly, we ascertained lower cutoffs among subjects aged<30 years, disharmonizing from the results of Amato et al. This difference may be due to the distinct trends concerning psychobiological factors (e.g. diet, physical activity, smoking, alcohol intake) in each region, which should be object for further studies.21
Regarding ethnic groups, the lower cutoff ascertained in the Afro-Venezuelan population was an interesting finding. Although, the small size of the ethnic categories precludes the generalization of this result, it illustrates the need to evaluate VAI performance in different ethnic groups on large scale. This issue represents one of the limitations of our study, along with its cross-sectional design. Likewise, it is important to consider that the corroboration of VAI usefulness for cardiovascular risk assessment requires the evaluation of this tool in regards to major cardiovascular events in large-scale prospective studies.
In summary, this report is the first to suggest VAI cutoffs for a Venezuelan population; which may be useful for comparison in further research on this tool, particularly regarding its epidemiological behavior concerning ethnicity. We do not pretend to extent these cutoff values to other Latin American population, albeit we do encourage other research teams to investigate local tendencies and reference values. We propose a VAI value of 1.9 for the identification of subjects with dysfunctional visceral adiposity. Nevertheless, age is an important factor to consider when utilizing this tool, as its predictive ability appears to be greater among younger individuals.
Ethical disclosuresProtection of human and animal subjectsThe authors declare that the procedures followed were in accordance with the regulations of the relevant clinical research ethics committee and with those of the Code of Ethics of the World Medical Association (Declaration of Helsinki).
Confidentiality of dataThe authors declare that they have followed the protocols of their work center on the publication of patient data.
Right to privacy and informed consentThe authors have obtained the written informed consent of the patients or subjects mentioned in the article. The corresponding author is in possession of this document.
FundingThis work was supported by Research Grant no. CC-0437-10-21-09-10 from Consejo de Desarrollo Científico, Humanístico y Tecnológico (CONDES), University of Zulia, and Research Grant no. FZ-0058-2007 from Fundacite-Zulia.
Conflicts of interestThe authors declare that they have no conflict of interest.


