Information is scarce on the impact of the clinical electronic record on the frequency and severity of medication errors in acute geriatric patients.
Material and methodsAn analytical and descriptive pre–post study was conducted on the implementation of computerized provider order entry systems (CPOE), over a 6 year period. A voluntary reporting system was used to detect the medication errors using the IR2 report form of the UK National Health Service, the Global Trigger Tool and the walk rounds with the Pharmacy Service. The severity categories were taken from the National Coordinating Council for Medication Error Reporting and Prevention (NCC MERP) Index Categorizing Errors.
ResultsA total of 1887 medication errors (1553 patients) were detected in the period of study, and represented the first adverse event reported (29.3%). 8.5 adverse events per 100 admissions were found (0.24 in the categories E through I) and the prescription errors represented a 27.6%. By drugs dispensed, adverse events were 2.07 times more frequent in the 3 year period (2007–2009) with electronic clinical record than in the 3 year period with the hand-written system (2004–2006), being more frequent with antibiotics (1.92 times), antipyretic (2.21 times) and opiates (2.72 times). For serious errors and by doses dispensed, there were 5.18 times less frequent serious errors in the period related to the electronic record, drug omission (46.8 times less frequent), wrong dose (10.53 times) and antibiotics (10.84 times).
ConclusionFrequent medication errors were found in acute geriatric patients. An increase in medication errors and a decline in the severity of the detected errors were found in relationship to the electronic clinical record. For these reasons, the implementation of the electronic clinical record should be monitored.
Hay pocos datos sobre el impacto que tiene la historia clínica electrónica sobre la frecuencia y severidad de los errores de medicación en pacientes agudos geriátricos.
Material y métodosEstudio analítico y descriptivo pre- y postimplementación de la historia clínica electrónica (HCE). Periodo de estudio: 6 años, usando un sistema de notificación voluntario para detectar los errores de medicación con el formulario IR2 del Servicio Nacional Inglés de Salud, el Global Trigger Tool y las rondas intinerantes con el Servicio de Farmacia usando las categorías de severidad del National Coordinating Council for Medication Error Reporting and Prevention (NCC MERP) Index Categorizing Errors.
ResultadosSe detectaron un total de 1.887 errores de medicación (1.553 pacientes) en el periodo de estudio y representó el primer evento adverso notificado (29,3%). Se encontraron 8,5 eventos adversos por 100 admisiones (0,24 en las categorías E a la I) y los errores de prescripción representaron un 27,6%. Para los fármacos dispensados, los eventos adversos fueron 2,07 veces más frecuentes en el periodo de 3 años (2007–2009) con la HCE que el periodo de 3 años con la historia clínica en papel (2004–2006), siendo más frecuente debido a antibióticos (1,92 veces), antitérmicos (2,21 veces) y opiáceos (2,72 veces). Para errores serios y por dosis dispensadas, hubo 5,18 veces menos de errores serios en el periodo relativo a la HCE, omisión de fármaco (46,8 veces menos frecuente), dosis equivocada (10,53 veces) y antibióticos (10,84 veces).
ConclusiónSe han encontrado errores de medicación frecuentes en los pacientes agudos geriátricos. Se observó un incremento en los errores de medicación y una disminución en la severidad de los mismos en relación a la implantación de la historia clínica electrónica. Por este motivo, la implementación de la historia clínica electrónica debe ser monitorizada.
The medication use process poses a significant safety risk for hospitalized patients in each of its phases (prescription, dispensation, administration or monitorization). There are several published studies showing that many adverse drug events (ADEs) are preventable1–6 and prescribing errors occur in 0.3–39.1% of medication orders for hospital inpatients,7 and harm has been reported in 1% of inpatients,1,8 depending of differences in study methods, definitions applied, and the ways in which prescription rates are calculated.9
Elder patients may be more vulnerable to medication errors because of the larger number of medications administered on a daily basis,10 and the number of opportunities for error is substantial in places such as nursing homes where the incidences rates range from 1.19 to 7.26 incidents per resident month.11
Computerized provider order entry systems (CPOE) have been consistently identified as an important intervention with the potential to reduce prescribing errors and injury.12–15 Although the evidence is limited,16 it may be due to have advantages such as standardization, a full audit trail, legibility, specification of a key data fields such as the route of administration, and storage and recall of records.17
Although voluntary reporting systems have serious limitations, such systems provide data that can be used to target patient safety improvement.18
Because there are scarce data and that the majority of the studies have serious limitations, this study describes the epidemiology and severity of medication errors detected in an acute geriatric hospital, and the impact of the electronic clinical record on reducing these errors.
Material and methodsSettingMonte Naranco Hospital (Oviedo, Spain) is a 200-bed (bed occupation rate was 71.4% and the average length of hospital stay as 11 days in the period of study) university-associated hospital in which most of the patients are geriatric (72.2%).
Type of studyAnalytical and descriptive study pre–post CPOE implementation. A six year period using a voluntary reporting system, the former period (2004–2006) with a hand-writing system and the latter period (2007–2009) with the clinical electronic record (CER) (Selene, Siemens, Germany). The computerized physician order entry has three main screens: (a) prescription screen (by commercial, substance or drug groups), (b) drug substance in the Pharmacy hospital repository and the rest of the drugs, and (c) standard procedures (route, doses, frequency and duration of treatment) and a free narrative text. The reporting systems and the methodology were the same in the six-year period of study and there were no changes in the period except to the introduction of the CER in the year 2007.
In the period of the study the following interventions were implemented: (a) 2004–2006: incorporation of reporting systems and analysis of causes and contributory factors, staff training about medication errors; (b) 2007: CER, Pharmacological Guide in CER and following group of the CER; (c) 2008–2009: incorporation of different patches in the CER, evaluation and analysis of the medication errors, periodically feedback was provided to the physicians.
Medication error was defined as an error which can occur at any of the phases of the medication use process; in this definition side effects of the medication are not included.
The following data were collected: (a) patient characteristics (age, sex, Barthel index and pathologies i.e. main diagnosis of hospitalization), (b) ward, phase of medication, shift, type of incident and causes, contributory factors of errors, group of medication and route. The Global medication error index (GMEI) was used for 10,000 administration doses.
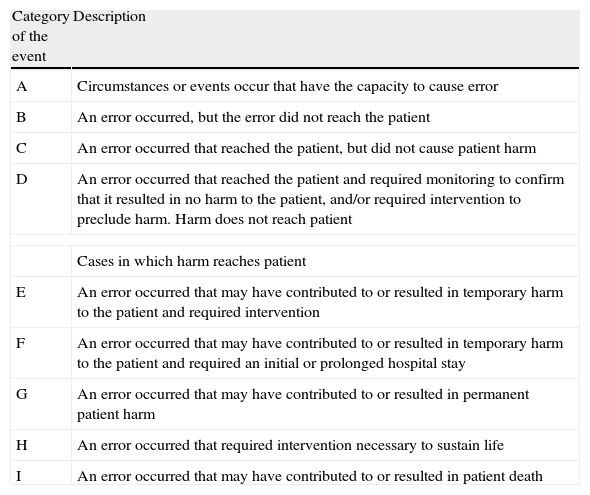
Data of the medication errors were collected from the IR2 report form from the NHS (UK National Health Service) and includes data about the incident, with a free narrative text, “what happened”, severity of the incident, contributory factors, outcome and learned lessons. The Global Trigger Tool (GTT)19 and the walk rounds with the Pharmacy Department. The data were anonymised and aggregated. We used the severity categories score from the adapted National Coordinating Council for Medication Error Reporting and Prevention (NCC MERP) Index Categorizing Errors20 (Table 1). The contributory factors were categorized by Charles Vincent's Scheme21 and by Ruiz-Jarabo's classification.22
The National Coordinating Council for Medication Errors Reporting and Prevention Index for Categorizing Errors.
| Category of the event | Description |
| A | Circumstances or events occur that have the capacity to cause error |
| B | An error occurred, but the error did not reach the patient |
| C | An error occurred that reached the patient, but did not cause patient harm |
| D | An error occurred that reached the patient and required monitoring to confirm that it resulted in no harm to the patient, and/or required intervention to preclude harm. Harm does not reach patient |
| Cases in which harm reaches patient | |
| E | An error occurred that may have contributed to or resulted in temporary harm to the patient and required intervention |
| F | An error occurred that may have contributed to or resulted in temporary harm to the patient and required an initial or prolonged hospital stay |
| G | An error occurred that may have contributed to or resulted in permanent patient harm |
| H | An error occurred that required intervention necessary to sustain life |
| I | An error occurred that may have contributed to or resulted in patient death |
Characteristics of moderate–serious errors (categories E–I of the NCC MERP) were compared using chi square tests and two-sample student t tests. A p value of <0.05 was considered to indicate statistical significance. The relative risk (RR) of an error and serious error was determined for each characteristics of an error, and 99% confidence intervals (CI) are reported.
ResultsGeneral dataThe medication errors were the first adverse events reported (29.3%) followed by nosocomial infections (16.8%) and patient falls (14.6%). In the six year period of study, there were 18,348 inpatients and 2,163,122 doses of dispensing drugs with a total of 1553 of patients with at least a medication error (n=1887). These figures represent 0.7 errors per patient month and 8.5 per 100 admissions (0.24 in the categories E–I) and the prescription errors represented a 27.6%.
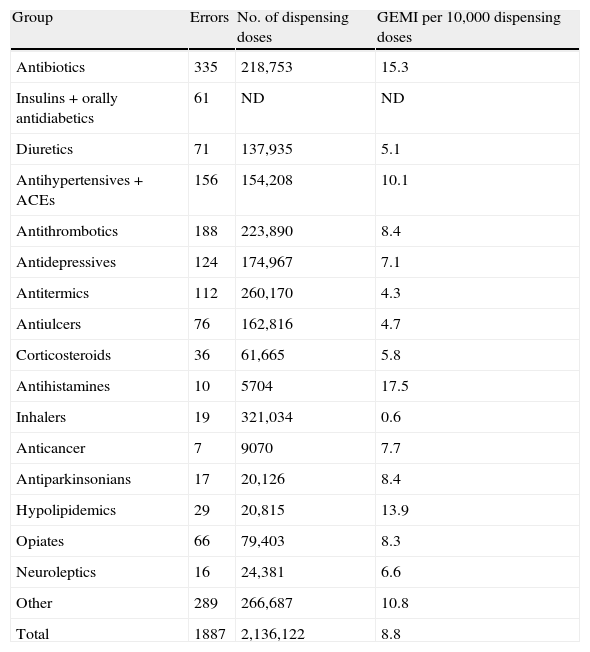
By severity, there were 0.19 severe errors (H–I), the majority of them were submitted in the morning shift (76.5%), the largest single category of type of error was dose/drug omission (41.5%), the main causes of error were human factors (57.6%), the contributory factors according to Ruiz Jarabo: individual (25.8%) and by IR2: work team (28.2%), and the route of administration: oral administration (55.9%) (Table 2). By medication group (using the GMEI): the mot frequent errors were produced in the following groups: antihistamines (17.5), antibiotics (15.3) and hypolipidemics (13.9) (Table 3).
General data of the medication errors (n=1553).
| Variable | 2004–2006 | 2007–2009 | Total number (%) |
| Phase of the error | |||
| Administration | 135 | 209 | 344 (22.2) |
| Prescription | 39 | 385 | 428 (27.6) |
| Dispensation | 138 | 533 | 671 (43.2) |
| Transcription | 44 | 66 | 110 (7.1) |
| Severity categories (NCC MERP) | |||
| A | 11 | 23 | 34 (2.2) |
| B | 159 | 995 | 1154 (74.3) |
| C | 68 | 157 | 225 (14.5) |
| D | 43 | 53 | 96 (6.2) |
| E | 27 | 6 | 33 (2.1) |
| F | 5 | 3 | 8 (0.5) |
| G | – | – | – |
| H | – | 1 | 1 (0.06) |
| I | 1 | 1 | 2 (0.13) |
| Shift | |||
| Morning | 254 | 934 | 1188 (76.5) |
| Afternoon | 72 | 97 | 169 (10.9) |
| Night | 10 | 3 | 13 (0.8) |
| Several shifts | 9 | 16 | 23 (1.5) |
| Unknown | 15 | 145 | 160 (10.3) |
| Type of error | |||
| Dose/drug omission | 161 | 530 | 691 (41.5) |
| Wrong dose | 57 | 111 | 168 (10.1) |
| Noncompliance | 16 | 138 | 144 (8.6) |
| Wrong drug | 52 | 81 | 133 (8) |
| Wrong patient | 17 | 104 | 121 (7.3) |
| Wrong strength | 9 | 49 | 58 (3.5) |
| Wrong time | 7 | 41 | 48 (2.6) |
| Other errors | 66 | 236 | 302 (18.1) |
| Causes of the error | |||
| Human factors | 191 | 768 | 959 (57.6) |
| Problems with prescribing interpretation | 35 | 302 | 337 (20.2) |
| Equipment and devices | 71 | 35 | 106 (6.4) |
| Wrong name of patients | 9 | 45 | 54 (3.2) |
| Wrong names of drugs | 15 | 14 | 29 (1.7) |
| Other | 6 | 33 | 39 (2.3) |
| Unknown | 44 | 98 | 142 (8.5) |
| Contributory factors | |||
| Individual | 181 | 248 | 429 (25.8) |
| Preparation/dispensing systems deficiency | 102 | 14 | 116 (7) |
| Communication/information systems deficiency | 49 | 60 | 209 (12.5) |
| Wrong standarization of procedures | 20 | 58 | 78 (4.7) |
| System inertia | 16 | 38 | 54 (3.2) |
| Environmental factors | – | 7 | 7 (0.4) |
| Out of stock | 8 | 19 | 27 (1.6) |
| Other | 378 | 368 | 746 (44.8) |
| Contributory factors (IR2) | |||
| Work team | 93 | 377 | 470 (28.2) |
| Design tasks | 170 | 285 | 455 (27.3) |
| Individual | 81 | 234 | 315 (18.9) |
| Environment | 20 | 308 | 328 (19.7) |
| Management | – | 3 | 3 (0.2) |
| Institutional context | – | 2 | 2 (0.1) |
| Patient | – | 1 | 1 (0.06) |
| Unknown | – | 92 | 92 (5.5) |
| Route of administration | |||
| Oral | 165 | 889 | 1054 (55.9) |
| Intravenous | 57 | 478 | 535 (28.4) |
| Subcutaneous | 44 | 155 | 199 (10.5) |
| Inhalation | 4 | 21 | 25 (1.3) |
| Patches | 33 | 20 | 53 (2.8) |
| Topic | 1 | 7 | 8 (0.4) |
| Eye drops | 1 | 9 | 10 (0.5) |
| Epidural | – | 3 | 3 (0.2) |
Errors and group of medications (1887).
| Group | Errors | No. of dispensing doses | GEMI per 10,000 dispensing doses |
| Antibiotics | 335 | 218,753 | 15.3 |
| Insulins+orally antidiabetics | 61 | ND | ND |
| Diuretics | 71 | 137,935 | 5.1 |
| Antihypertensives+ACEs | 156 | 154,208 | 10.1 |
| Antithrombotics | 188 | 223,890 | 8.4 |
| Antidepressives | 124 | 174,967 | 7.1 |
| Antitermics | 112 | 260,170 | 4.3 |
| Antiulcers | 76 | 162,816 | 4.7 |
| Corticosteroids | 36 | 61,665 | 5.8 |
| Antihistamines | 10 | 5704 | 17.5 |
| Inhalers | 19 | 321,034 | 0.6 |
| Anticancer | 7 | 9070 | 7.7 |
| Antiparkinsonians | 17 | 20,126 | 8.4 |
| Hypolipidemics | 29 | 20,815 | 13.9 |
| Opiates | 66 | 79,403 | 8.3 |
| Neuroleptics | 16 | 24,381 | 6.6 |
| Other | 289 | 266,687 | 10.8 |
| Total | 1887 | 2,136,122 | 8.8 |
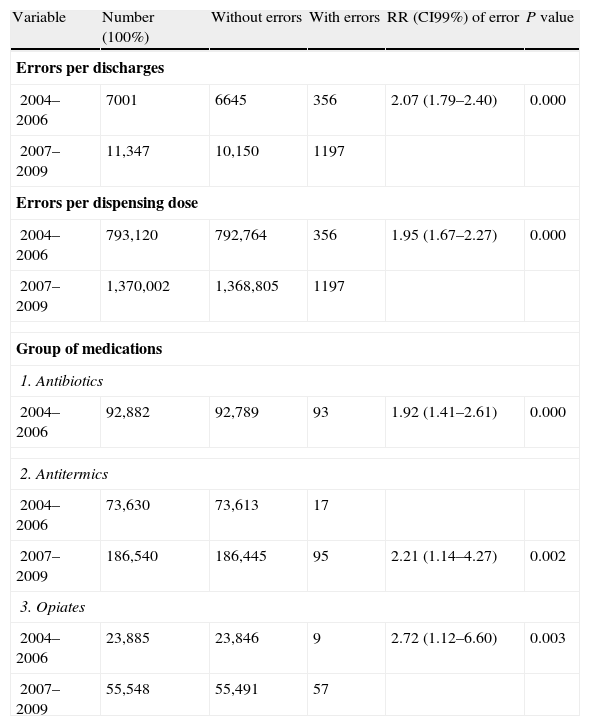
In the period 2004–2006, there were 356 errors per 7001 discharges (5.1%) versus 1197 errors per 11,347 discharges (10.5%) in the period 2007–2009 (2.07 times more frequent errors) (RR 2.07, CI99% 1.79–2.40). By dispensation drugs, there were 4.9 GMEI versus 8.7 (1.95 times more frequent errors) (RR 1.95, CI99% 1.67–2.27). By medication groups, there were more frequent errors in: antibiotics (1.92 times) (RR 1.92, CI99% 1.41–2.61), antitermics (2.21 times) (RR 2.21, CI99% 1.14–4.27) and opiates groups (2.72 times) (RR 2.72, CI99% 1.12–6.60) (Table 4). There was no statistical significance in other variables.
RR of number of errors with statistical significance.
| Variable | Number (100%) | Without errors | With errors | RR (CI99%) of error | P value |
| Errors per discharges | |||||
| 2004–2006 | 7001 | 6645 | 356 | 2.07 (1.79–2.40) | 0.000 |
| 2007–2009 | 11,347 | 10,150 | 1197 | ||
| Errors per dispensing dose | |||||
| 2004–2006 | 793,120 | 792,764 | 356 | 1.95 (1.67–2.27) | 0.000 |
| 2007–2009 | 1,370,002 | 1,368,805 | 1197 | ||
| Group of medications | |||||
| 1. Antibiotics | |||||
| 2004–2006 | 92,882 | 92,789 | 93 | 1.92 (1.41–2.61) | 0.000 |
| 2. Antitermics | |||||
| 2004–2006 | 73,630 | 73,613 | 17 | ||
| 2007–2009 | 186,540 | 186,445 | 95 | 2.21 (1.14–4.27) | 0.002 |
| 3. Opiates | |||||
| 2004–2006 | 23,885 | 23,846 | 9 | 2.72 (1.12–6.60) | 0.003 |
| 2007–2009 | 55,548 | 55,491 | 57 | ||
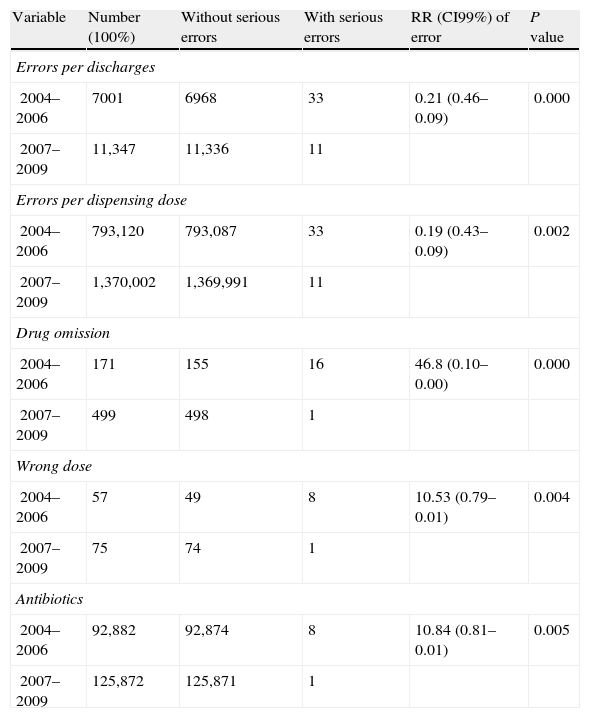
In the period of 2004–2006, there were 33 moderate–serious errors (E–I) from the 356 errors (9.3%) versus 11 from the 1197 in the period 2007–2009 (1%) (10.09 times less frequent) (RR 0.10, CI99% 0.20–0.05). By discharges, 4.86 times less frequent (RR 0.21, CI99% 0.46–0.09) and by dispensing doses, 5.18 times less frequent (RR 0.19, CI99% 0.43–0.09). By type of error: drug omission (46.8 times less frequent) (RR 0.02, CI99% 0.10–0.00) and wrong dose (10.53 times less frequent) (RR 0.10, CI99% 0.79–0.01), and by medication group: antibiotics (10.84 times less frequent) (RR 10.84, CI99% 0.81–0.01) (Table 5) were the most significant groups involved. There was no statistical significance in other variables.
RR of number of serious errors with statistical significance.
| Variable | Number (100%) | Without serious errors | With serious errors | RR (CI99%) of error | P value |
| Errors per discharges | |||||
| 2004–2006 | 7001 | 6968 | 33 | 0.21 (0.46–0.09) | 0.000 |
| 2007–2009 | 11,347 | 11,336 | 11 | ||
| Errors per dispensing dose | |||||
| 2004–2006 | 793,120 | 793,087 | 33 | 0.19 (0.43–0.09) | 0.002 |
| 2007–2009 | 1,370,002 | 1,369,991 | 11 | ||
| Drug omission | |||||
| 2004–2006 | 171 | 155 | 16 | 46.8 (0.10–0.00) | 0.000 |
| 2007–2009 | 499 | 498 | 1 | ||
| Wrong dose | |||||
| 2004–2006 | 57 | 49 | 8 | 10.53 (0.79–0.01) | 0.004 |
| 2007–2009 | 75 | 74 | 1 | ||
| Antibiotics | |||||
| 2004–2006 | 92,882 | 92,874 | 8 | 10.84 (0.81–0.01) | 0.005 |
| 2007–2009 | 125,872 | 125,871 | 1 | ||
In the literature review,9 just 12 valid studies were identified between 1998 and 2007 from 954 articles about prescription errors in hospital inpatients: 7 pre and post-implementation CPOE studies (two with voluntary reporting system), 2 time series, 1 cross-sectional, 1 crossover and 1 comparative cohort in the United States, the UK, Europe and Israel. In four studies patients were paediatric patients and in the rest of the nine studies were adults (3 in Intensive Care Unit – ICU – and 5 in adult general hospitals – two studies relied upon voluntary reporting). Our study was in acute geriatric patients and in Spain, where there are no data about this topic in our knowledge.
Spencer et al.23 in an observational time series study, using voluntary reporting, found that the number of prescription errors per discharge was higher after CPOE implementation from 0.015 to 0.019 prescription errors per discharge. Mahoney et al.24 conducted a retrospective pre–post CPOE study involving voluntary reporting, the prescribing errors decreased significantly in three out of four monitored categories, specifically drug allergy reporting, excessive dosing and incomplete or unclear orders. In general, there is a significant reduction in prescribing errors rates for all or some drug types in the 12 studies.9 In line with Spencer et al.,23 we found that the number of prescribing errors per discharge was higher after CPOE implementation from 5.1% to 10.5% (2.1 times more frequent) and per dispensing drugs from 4.9 GMEI to 8.7 GMEI (1.95 times more frequent) and this effect could be a detection bias with the new system.23
In just five studies estimated the prescribing error severity9 and the evidence is limited by modest sample sizes and designs such as the classes of severity. We show that, using NCC MERP categories and extended to all the hospital, there was a significant reduction from 9.3% to 1% (10.1 times less frequent).
According to Reckmann¿s definition,9 we considerer that our study has several strengths: definition of prescribing errors, absolute error rates pre and post-COPE implementation, denominator for prescribing error rates including total number of orders, proportion of errors by a standardized severity scale, error rates per severity category using two denominators (total orders, total errors), significance testing and the scale of the study to all hospital not just one or two wards. On the contrary, our limitation is the use of a voluntary reporting system, with under-reporting of errors. Although we think that our results can be significant in the same way of other valid studies, other studies show that these voluntary reporting systems identify just a 1.5% of the adverse events and 6% of medication events (review in 2525). In a previous study,26 we showed the increase of the notification and record of adverse events, the increase of the reporting systems from 4 to 10 and the prevalence of medication errors of 19.2% with the Spanish observational study of medication errors (Estudio multicéntrico observacional para la prevención de errores de medicación – EMOPEM) in the year 2007. For these reasons, this could be the cause of the bias in the increased number of medication events, although the three methods used in this paper (IR2 report form from the NHS – UK National Health Service, the Global Trigger Tool – GTT – and the walk rounds with the Pharmacy Service) were the same methods used in the period of the study. The nature of the sources in the reporting systems does not let us know the ranking and real figures of the adverse events, and it is necessary to establish priorities and to stagger the different reporting systems and according to cost effectiveness measures. The reporting systems are the first step to analysis and it might be necessary to improve and to mitigate the adverse events.26 Another bias could be the organizational and cultural change with the CER and the notification in the voluntary reporting systems. This bias could be solved with the use of other data sources. In our study, voluntary reporting systems were used, at the same time the GTT and walk rounds have also been used. Other limitation could be that the CER is described in reference centers with different culture than the existing one in small or medium hospitals such as our hospital. The main goal in this study is that CPOE must be monitored during and after its implementation in order to detect the occurrence of new medication errors.
In conclusion, the study conducted in acute geriatric patients detected an increase in the reported errors and the decline of the severity of the errors related to the CER. Accordingly, we recommend that the follow-up of the implementation of the CER in hospitals should be monitorized to determine the impact of the medication errors.
Conflicts of interestThe authors have no conflicts of interest to declare.


