The present paper attempts take an in-depth look into the configuration of social capital as a multi-dimensional construct, and unlike other studies, the dimensions are interrelated, and all of this in a global inter-organizational context. This work also analyses the influence of the cross-national diversity of corporate governance on the configuration of social capital. A variance-based structural equation modelling (partial least squares) and the multi-group analysis have been applied to a sample consisting of 225 global contractors. The findings lead us to argue that the different dimensions of social capital configuration do not act independently, but they exert a certain effect among themselves, and also affect the international market share of the company. Furthermore, the way each company configures the dimensions of social capital dimensions will depend on the company's corporate governance style.
Este trabajo trata de profundizar en la configuración el capital social como un constructo multidimensional, donde a diferencia de estudios previos sus dimensiones están inter-relacionadas, y todo esto en un contexto de relaciones inter-organizativas globales. Además, este trabajo analiza la influencia de la diversidad transnacional del gobierno corporativo en la configuración del capital social. Un modelo de ecuaciones estructurales basado en la varianza y un análisis de multi-grupos ha sido aplicado a una muestra conformada por 225 constructores globales. Los resultados nos permiten afirmar que las diferentes dimensiones de la configuración del capital social se inter-relacionan incidiendo unas sobre otras lo cual afecta a la cuota de mercado internacional de la empresa. Además, la manera en que la empresa configura las dimensiones del capital social va a depender del estilo de gobierno corporativo.
In recent years, an increasing interest in the study of international strategic alliances (hereafter, ISAs) and other cooperation mechanisms in the field of international business has been observed (Nair, Hanvanich, & Tamer Cavusgil, 2007). Accordingly, most studies have looked at the benefits brought by capital to the inter-organizational networks in which the companies are embedded (Koka & Prescott, 2002; Tsai & Ghoshal, 1998), although the majority of these analyses have handled this concept implicitly (Ahuja, 2000a). Despite this, some authors agree (Adler & Kwon, 2002) that social capital should be recognized as a critical factor in organizational success. Hence, from a social network approach, focal firms build and develop their social capital among their already existing alliance partners through the formation of additional alliances (Walker, Kogut, & Shan, 1997). Regarding the social capital configuration, some researchers (Koka & Prescott, 2002; Wassmer, 2010) argue that is a complex concept comprising multiple dimensions which refer to the result of the effect of various aspects linked to the network architecture and the access to the network resources (Ahuja, Soda, & Zaheer, 2012). Moreover, these configuration processes are likely to take different forms and to have different levels depending on several contingent factors (Ramström, 2008). These could be the diversity of corporate governance styles (Aguilera & Jackson, 2003). Therefore, the configuration of the social capital remains a puzzle.
Another important issue analyzed in the literature has been how certain dimensions of the social capital influence international performance. In accordance with this, the literature shows that there are several possible indicators that reflect the ISAs’ success. One of the most relevant for the international activity of multinational companies (hereafter, MNCs) is the international market share (Kauser & Shaw, 2004). Some researchers have studied the influence of social networks in achieving international growth focusing on the structural dimension of SMEs (Coviello & Munro, 1997; Johanson & Mattsson, 1988; Zhou, Wu, & Luo, 2007). Dussauge, Garrette, and Mitchell (2004) analyzed at a dyadic level the incidence of certain types of alliances (link versus scale) on the international market share. Nonetheless, the analysis of the social capital configuration-international market share relationship of MNCs to implement a holistic approach has until now received little attention.
Accordingly, MNCs do not suffer from both the liability of newness and the liability of smallness (Kiss & Danis, 2008), but they require to access and mobilize other types of resources as reputation, legitimacy and knowledge. All in all, in order to improve our understanding of the social capital configuration it is necessary to examine two central questions: firstly, which dimensions conform the social capital and how they are interrelated; and, secondly, how certain contingent factors affect the configuration of the social capital (Aguilera & Jackson, 2003; Koka & Prescott, 2002). By doing so, the objective of this study is twofold. First we aim to fill the existing gap in the analysis of ISAs and to make an empirical contribution to the literature by going deeper into the conceptualization and measurement of the dimensions of social capital and analyzing the direct relationships between these dimensions in a specific empirical context – in particular, an interorganizational network in the global contractors industry. Second, our aim is to study how cross-national diversity affect the configuration of the social capital (Aguilera & Jackson, 2003; Koka & Prescott, 2002). To achieve the objectives proposed this paper is organized as follows. We begin with a review of the literature on social capital in order to identify and measure each of the dimensions that make up the construct, as well as its impact on the international competitive position of firms. Our research means to explicitly measure the dimensions of social capital by proposing a direct relationships model based on the data from 225 international contractors (MNCs). We apply a variance-based structural equation modelling (Partial Least Squares) (Henseler, Ringle, & Sinkovics, 2009) to test the measurement model (outer model) and the structural model (inner model). The importance of the findings is that they provide an alternative explanation for the divergent results obtained by different social capital configuration about international performance. To answer the second aim, we carried out a multi-group analysis, segmenting Aguilera and Jackson (2003) typology.
Conceptual model and hypothesesInternational performance and dimensions of the social capitalThere are many approaches about the concept of international performance. One of the many proposals made is the international market share. Market share reflects the firm's competitive position and is a non-financial performance indicator that is commonly accepted both in general strategy (Combs, Yasin, & Lisboa, 2007) and in international business (Depperu & Cerrato, 2005). Guler and Guillén (2010) have recently shown how domestic (local) networks affect international expansion, by highlighting the existence of a growing body of evidence, documenting the influence of social networks on a firm's strategy and performance (Dussauge et al., 2004). However, there has been little or no studies about to how these networks affect established firms and their performance in international markets.
Social capital is the network of relationships which bring value to the actors forming the network by allowing them access to the resources embedded in that network (Adler & Kwon, 2002; Florin, Lubatkin, & Schulze, 2003). However, as aforementioned, social capital configuration is a complex concept comprising multiple dimensions which refers to the result of the effect of various aspects linked to the network architecture (Ahuja et al., 2012; Koka & Prescott, 2002). The architecture of any network can be conceptualized in terms of three primitives (Ahuja et al., 2012) – the nodes that comprise the network, the ties that connect the nodes, and the patterns or structure that result from these connections (see Fig. 1). Network architectures can therefore be associated with the number, identity, and characteristics of nodes; the location, content, or strength of ties; and the pattern of interconnections or ties among nodes. These concepts are closely linked to capital social's dimensions. In light of the above, we conceptualize social capital as the structural characteristics of the network (structural dimension), the components of the alliance such as trust (relational dimension), the features of partner firms as such technological and cultural diversity (partner dimension) and the network resourcefulness (resource dimension) (Rivera-Santos & Inkpen, 2009).
Research model based on Tsai and Ghoshal (1998).
The structural dimension of social capital attempts to include all the interactions that exist between the different nodes that form a network. In general, network density is rarely uniform throughout a network. Coleman (1988) posed that the greater the cohesion within the network in which the firm is situated and the more central its position in the network, the greater the potential benefits that a firm can gain (Ahuja, 2000b; Cowan & Jonard, 2006; Houghton, Smith, & Hood, 2009); whilst Burt (1992) suggested that firms occupying favourable brokering or entrepreneurial positions within a network can secure important advantages by exploiting their privileged relationships with isolated colleagues (Houghton et al., 2009; Sapsed, Grantham, & DeFillippi, 2007; Shipilov, 2006).
Although some authors consider these two views as being independent, it makes sense to view them as being linked and inversely related (Koka & Prescott, 2008). Drawing on the relevant research into the MNCs’ interfirm networks from international industries which support Coleman's position (Ahuja, 2000a; Lorenzoni & Baden-Fuller, 1995), in this work we are going to focus on centrality. A centrally-located firm is generally considered to be well positioned in a network (Burt, 1992; Coleman, 1988; Inkpen & Tsang, 2005), as this position mainly implies two benefits. Firstly, central firms are predicted to have significant access benefits because they possess direct and indirect ties with multiple firms and many of their partner firms are prominent in the network. Access arguments view network ties as conduits providing timely knowledge, and resources (Batjargal, 2003). Secondly, a central firm can achieve affiliation benefits (Coleman, 1988). Finally, network centrality provides a signalling mechanism of legitimacy and reputation (Podolny, 2001). These theoretical considerations about the central network position enhances firm international performance have, in general, been confirmed by empirical findings (Ahuja, 2000a; Baum & Ingram, 2002; Gnyawali & Madhavan, 2001; Hoffmann, 2007).
In Tsai and Ghoshal's (1998) model, structural dimension is the prime generator of social capital, and influences the other components. If we look at the relational dimension, this refers to the characteristics and attributes of relationships such as trust and other complex incentives (quality of the relationships) which are derived principally from the company's history and reputation (Granovetter, 1985; Gulati, Nohria, & Zaheer, 2000). Previous studies have observed that when two actors interact over time, their relationships become stronger and the actors are more likely to view each other as trustworthy (Granovetter, 1992; Gulati & Gargiulo, 1999; Tsai, 2001). All in all, it is logical to think that the focal actor's social structure can affect both trust and perceived trustworthiness (Theingi, Purchase, & Phungphol, 2008; Tsai & Ghoshal, 1998). We therefore propose that:Hypothesis 1 The central network position will be positively associated with the trust and perceived trustworthiness.
The partner dimension aims to embrace certain attributes of partners such as the headquarters’ nationality or geographical location and the technologies that it uses in the development of its activities (Wassmer, 2010). With regard to these attributes is necessary to analyze if the benefits from the partner diversity outperform the costs resulting from having to manage different partners (Jiang, Tao, & Santoro, 2010). Some researchers (Goerzen & Beamish, 2005; Luo & Deng, 2009) observed that the existence of similar partners in a focal firm's alliance portfolio contribute to a firm's performance up to a threshold. Thus, in order to surpass this threshold it is needed to incorporate alliances with dissimilar partners (Goerzen & Beamish, 2005), being this issue particularly important in global and mature markets (Baum, Calabrese, & Silverman, 2000). This work proposes that the focal actor try to select dissimilar partners (van Wijk, Jansen, & Lyles, 2008).
The literature has mainly focused on these two important diversities for firms: technological diversity (Gnyawali & Madhavan, 2001; Stuart, 2000; Vasudeva & Anand, 2011) and cultural diversity. Regarding technological diversity, when the focal firm's partners operate in different market segments they may have different technologies and belong to different sub-industries (Baum et al., 2000; Koka & Prescott, 2002). Accordingly, these technologically-diverse firms can be a critical source of novel and diverse knowledge and other resources for the ego firm (Phelps, 2010; Vasudeva & Anand, 2011). With regard to cultural diversity, some authors posit (Lavie & Miller, 2008) that the alliances in a global industry involve setting up interorganizational relations between partners from different nation states. These alliances provide the focal firms with valuable resources and capabilities and enhance different knowledge transfers and learning (Jiang et al., 2010).
Finally, the structural dimension of alliance portfolio configuration are the channels through which the ego firm may access to these partners’ characteristics (Tsai & Ghoshal, 1998). This indicates that the structural dimension of the alliance portfolio's configuration may have a significant impact on the partner dimension. We therefore propose the following hypothesis:Hypothesis 2 The central network position will be positively associated with the convenient partner's characteristics.
The resource dimension of social capital refers to the extent to which the contacts within the network possess valuable resources (Batjargal, 2003; Lin, 1999). There are two critical points to know if firms are to be able to mobilize their contacts’ resources. Firstly, they must be aware of the resources that exist within the network (Batt & Purchase, 2004; Westerlund & Svahn, 2008). Secondly, there must be a social structure, as the relationships form conduits along which resources such as knowledge or financial support will flow (Partanen, Möller, Westerlund, Rajala, & Rajala, 2008; Westerlund & Svahn, 2008). Gnyawali and Madhavan (2001) stated that improved access through inter-organizational relationships and resource-advantage frequently enables companies to increase or maintain their international market share. Taking these ideas into account, we propose that:Hypothesis 3 The central network position will be positively associated with the access to valuable partners’ resources.
As aforementioned, the partner dimension refers to contacts’ attributes. Some researchers (Arenius, 2002; Tsai & Ghoshal, 1998) consider that if shared visions, aims and values of the partners are diverse but compatible (Luo & Deng, 2009; van Wijk et al., 2008), they will tend to trust one another and to a large degree the likelihood of opportunistic behaviours will disappear. Therefore, certain attributes of partners make these relationships are characterized by trust and strength and this trust will be an important social lubricant (Rivera-Santos & Inkpen, 2009, p. 208) for the flow of valuable resources via different network ties. Therefore we state that:Hypothesis 4 The partners’ characteristics will be positively associated with the relational dimension.
Following a similar reasoning, we pose that as cooperating firms with diverse but compatible share objectives, values, interests, they become more likely to exchange and combine their resources (Arenius, 2002; Puhakka, 2006; Sarkar, Aulakh, & Madhok, 2009). Otherwise, network composed of similar partners is restricted in resources diversity and a large degree the likelihood of accessing to valuable resources will decrease (Luo & Deng, 2009). Likewise, Arenius (2002) proposes that the partner dimension help actors to cooperate better by creating more opportunities for exchanging resources. These ideas lead us to think that:Hypothesis 5 The partners’ characteristics will be positively associated with the access to valuable partners’ resources.
For some authors, the main benefit of alliance portfolio is accessing to valuable resources (Arenius, 2002; Autio, Sapienza, & Arenius, 2005; Stein & Ginevicius, 2010). Batjargal (2003) demonstrated that both the relational and the resource dimensions have a favourable impact on performance (Ramström, 2008). This occurs because as trust increases and becomes embedded in the relationships, their tendency to share resources increase (Puhakka, 2006). In this sense, various researchers (Bratkovic, Antoncic, & Ruzzier, 2009; Doz, 1996; Gulati, 1995b; Koka & Prescott, 2002) consider that trust is the critical factor as it decreases the likelihood of developing opportunistic relationships and allows greater fluidity in the sharing and combination of resources. Taking these ideas into account, we posit that:Hypothesis 6 The relational dimension will be positively associated with the access to valuable partners’ resources.
The dimension that has been mainly associated with firm's performance is the resource dimension (Tsai & Ghoshal, 1998), although other studies link all of the social capital's dimensions to the dependent variable without establishing a specific sequence (Koka & Prescott, 2002). From our point of view, firms that have privileged access to partners’ resources can achieve a greater international market share than their competitors (Autio, Sapienza, & Almeida, 2000). Accordingly, Johanson and Vahlne (2009) noted that insidership in valuable networks is critical for the success of the internationalization, and for this reason there is a liability of outsidership. Therefore, when undergoing the internationalization process, firms must obtain, share, assimilate and combine resources – primarily knowledge – in order to compete and grow in international markets. As a result, we propose the following hypothesis:Hypothesis 7 The access to valuable partners’ resources will be positively associated with international performance.
The costs and benefits related to social capital depend on how efficiently is configured. Previous research has noted that on several contingent factors affects the efficiency of social capital (Ramström, 2008). Accordingly, it has been suggested in the literature that the cross-national diversity of corporate governance present differences in the consideration of the social capital dimensions (Koka & Prescott, 2002). Reuer and Ragozzino (2006) posit that social capital is configured inefficiently due to corporate governance issues. Many researchers suggest that corporate culture reflects how an organization competes (Luk et al., 2008). Therefore we state that:Hypothesis 8 The configuration of social capital's dimensions is contingent on the cross-national diversity.
Bearing in mind the dependent variable used, a specific industry had to be selected that has reached a high level of globalization and whose structure would allow us to achieve our proposed objective. The public works sector was chosen for a number of reasons. Firstly, because it is a global sector in which construction companies are prepared to undertake projects in any part of the world. Secondly, alliances or cooperative actions are frequent in this sector (Bresnen & Marshall, 2000; Crespin-Mazet & Ghauri, 2007). Finally, because it makes sense to measure social capital in a particular sector or activity where the number of actors that conform it is relatively easy to define or control (Koka & Prescott, 2002). The International Public Works industry is relatively small, since a company needs to reach a certain size and to be pre-qualified or classified before it can carry out international projects (Bresnen & Marshall, 2000; Castro, Galán, & Casanueva, 2009; Crespin-Mazet & Ghauri, 2007).
We needed two types of information to perform our social network analysis: relational information and attributive information on the nodes (Wasserman & Faust, 1994).
The relational data on the international activity of firms in this sector was taken from Public Works Financing (PWF), which publishes its annual “International Public Works Financing Projects Database”, listing more than 3100 PPP (public–private partnership) infrastructure projects that have been proposed or carried out over the past 20 years. The projects are largely contractual, and a number of firms work together in any single project, however, no long-term legal entities are formed beyond of the bidding consortium, which has a limited time frame (Sarkar, Aulakh, & Cavusgil, 1998). The variety of firms that participate in a construction firm is very wide: consultancies, contractors, sub-contractors and suppliers. In this research, we focus solely on the network of contractors that is of a horizontal nature, which is based on agreements of cooperation involving both equity and international joint ventures, as well as non-equity (in other words, what appears in the rectangle in the Fig. 2). Accordingly, data were identified on the PWF Database for all projects that had been awarded to a consortium of firms, specifically 66.6% (2100 projects).
The interorganizational networks of a construction project based on London et al. (1998).
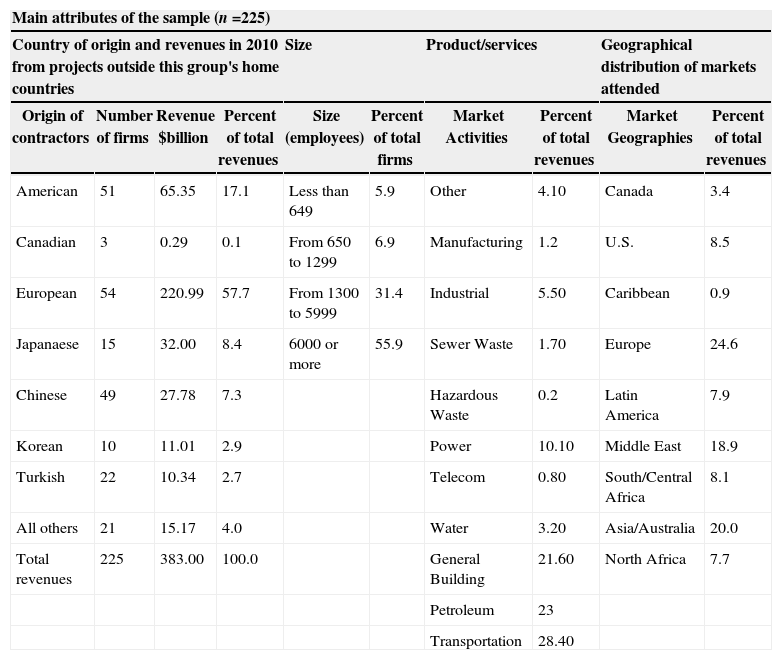
The attributive data for the main contractors operating at an international level were taken from the Engineering News Record database, which publishes weekly trade journal for the construction contracting industry and annual classification or ranking: The Top 225 International Contractors. This classification ranks companies according to construction revenue generated outside each company's home country over a set period of time in U.S.$ millions. Therefore, we have studied the agreements of cooperation and horizontal alliances between these 225 contractors which made up our sample (Sarkar et al., 1998). Table 1 summarizes some of the sample's relevant characteristics.
Characteristics of the sample.
| Main attributes of the sample (n=225) | |||||||||
|---|---|---|---|---|---|---|---|---|---|
| Country of origin and revenues in 2010 from projects outside this group's home countries | Size | Product/services | Geographical distribution of markets attended | ||||||
| Origin of contractors | Number of firms | Revenue $billion | Percent of total revenues | Size (employees) | Percent of total firms | Market Activities | Percent of total revenues | Market Geographies | Percent of total revenues |
| American | 51 | 65.35 | 17.1 | Less than 649 | 5.9 | Other | 4.10 | Canada | 3.4 |
| Canadian | 3 | 0.29 | 0.1 | From 650 to 1299 | 6.9 | Manufacturing | 1.2 | U.S. | 8.5 |
| European | 54 | 220.99 | 57.7 | From 1300 to 5999 | 31.4 | Industrial | 5.50 | Caribbean | 0.9 |
| Japanaese | 15 | 32.00 | 8.4 | 6000 or more | 55.9 | Sewer Waste | 1.70 | Europe | 24.6 |
| Chinese | 49 | 27.78 | 7.3 | Hazardous Waste | 0.2 | Latin America | 7.9 | ||
| Korean | 10 | 11.01 | 2.9 | Power | 10.10 | Middle East | 18.9 | ||
| Turkish | 22 | 10.34 | 2.7 | Telecom | 0.80 | South/Central Africa | 8.1 | ||
| All others | 21 | 15.17 | 4.0 | Water | 3.20 | Asia/Australia | 20.0 | ||
| Total revenues | 225 | 383.00 | 100.0 | General Building | 21.60 | North Africa | 7.7 | ||
| Petroleum | 23 | ||||||||
| Transportation | 28.40 | ||||||||
Some researchers posited that market share provides an absolute measure of the firm's international market penetration and international success (Leiblein & Reuer, 2004; Rugman & Verbeke, 2004; Zhou et al., 2007). In this line, we associate international performance to the international market share as this variable therefore reflects the firm's “power” in the sector which, in the long term, will affect its economic benefit. In order to operationalize this variable, we calculated two indicators: firstly, the international market share (IMS), which was calculated as the average ratio between a firm's foreign sales and industry total foreign sales during the period 2002–2006. Secondly, international growth (NIMS) reflected on the sales derived from new works or projects divided by the total international turnover from new works or projects during the period 2002–2006.
Explanatory variablesTo measure the structural dimension and, in particular the centrality, we have used two indicators. First, starting from the premise that international strategic alliances are symmetrical relationships and therefore do not distinguish between entry and exit, the indicator we use is degree centrality (PARTNERS). The second indicator is a normalized eigenvector of geodesic distances (EIGEN) that takes relationship intensity into account for measuring centrality (Ahuja, 2000a; Koka & Prescott, 2002). The two network indicators were calculated using the Ucinet VI SNA software package (Borgatti, Everett, & Freeman, 2002).
In order to analyze the partner dimension we have developed two indicators: technological and cultural diversity. Technological network diversity, we used the measurement based on Koka and Prescott (2002). Technological diversity has been commonly studied by the Standard Industry Classification (SIC) (Gulati, Lavie, & Singh, 2009). As the SICs in our sample are very similar, we have classified the firms in this study by their principal activity used in the Engineering News Record database (General Building; Manufacturing; Power; Water Supply; Sewerage Solid/Waste; Industrial/Process Petroleum; Transportation; Hazardous Waste; Telecomunications). We used Blau's heterogeneity index (Blau, 1977) to calculate this indicator. With the aim to analyze cultural network diversity we used the measurement based on Hofstede perspective (Hofstede, 1980; Kaufmann & O’Neill, 2007; Kogut, 1988). This approach, which tries to measure the cultural distance between the focal actor and its partners, has been widely adopted in the literature on internationalization as the best proxy, which includes the cultural differences between countries (Lavie, 2008; Tihanyi, Griffith, & Russell, 2005), taking on board the possible criticisms that Hofstede's work may have received.
where Idc is the value in Hofstede index for the cultural dimension d of country c, u is the focal actor's country of origin, and Vd represents the variance between countries in the Hofstede Index in dimension d. We then calculated the average cultural distance of firms’ egocentric network.To operationalize the relational dimension we developed an indicator based on the idea that multiple links between the same partners could be viewed as a sign of trust between them (Gulati, 1995a, 1995b; Koka & Prescott, 2002). Multiple links refers to the establishment of more than one inter-organizational relationship with the same partner when carrying out a project during the time period being considered. To calculate this ratio we divided the number of multiple partners that the focal firm had (more than one international alliance during the period under consideration – 1985–2006 by the number of partners that form its ego network.
The resource dimension indicates whether the firms in our study are powerful or resource-rich (Batjargal, 2003). Following Gulati (1995b), we divided The Top 225 International Contractors in 2007 into four conglomerates through hierarchical principal component analysis in which different financial and attributive firm indicators were considered. From this analysis two measures were developed. The first, Partners Group A shows the ratio of the number of partners that a firm had which could be classified as the most valuable or powerful (belonging to Group A) to the number of firms making up the neighbourhood of the firm analyzed. The second indicator, Partners Group A and B, represents the number of partners that a firm has, out of all the firms that make up its ego network which could be placed in groups A and B. To construct the two indicators we used matrix algebra to multiply the relational matrix (international strategic alliances) by the vector representing the hierarchical conglomerate in which each of the firms is placed (Borgatti et al., 2002).
ResultsInternational performance and dimensions of the social capitalPartial least squares (PLS), a structural equation modelling (SEM) methodology, was used to evaluate the relationships established in the hypotheses using pls-graph v 3.0(Chin & Frye, 2003). We opted for the PLS technique as it is appropriate in situations where the theory is insufficiently tested and the available manifest variables or measures are unlikely to conform to a rigorously-specified measurement model (Fornell & Bookstein, 1982).
The analysis and interpretation of a PLS requires an analysis and evaluation of the reliability and validity of the measurement model, and an assessment of the structural model itself (Barclay, Higgins, & Thompson, 1995). The measurement model in PLS is therefore assessed in terms of individual item reliability, construct reliability, convergent validity, and discriminant validity.
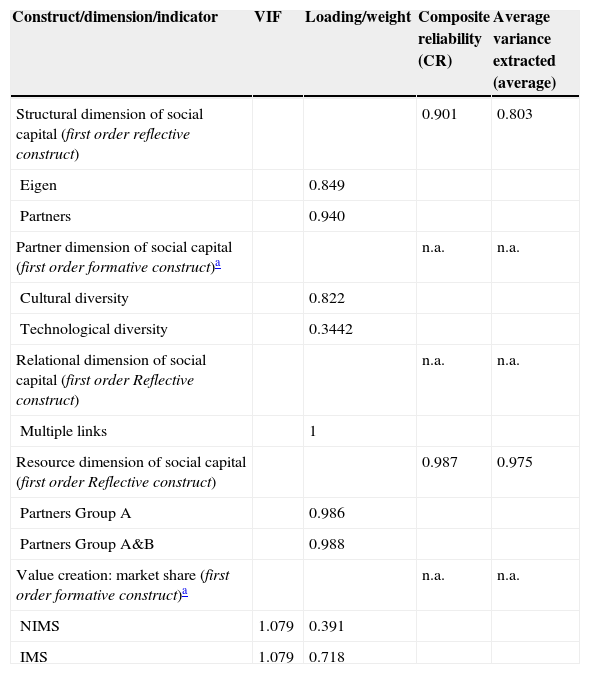
We followed the recommendation made by Bollen and Lennox (1991) not to drop any items of the formative constructs, as this may result in the loss of interesting information. Moreover, the variance inflation factors (VIF) presented in all of the constructs presented a value under 5, as proposed by Belsley (1990), showing absence of multicolinearity. Regarding the reflective constructs, all of them met the recommended threshold of 0.7 (Carmines & Zeller, 1979).
Construct reliability is assessed by composite reliability (CR) (Werts, Linn, & Jöreskog, 1974) taking the value of 0.7 as a benchmark (Nunnally, 1978) for modest construct reliability, applicable in the initial stages of research, and 0.8 for basic research. In our study, all of the multi-item constructs appeared to be reliable, as can be observed in Table 2. To ensure that all the items referred to are measuring the same concept, namely convergent validity, we examined the average variance extracted (AVE) measure (Fornell & Larcker, 1981). The AVE values obtained showed values greater than the minimum (0.5) recommended by Fornell and Larcker (1981), thereby supporting the convergent validity of all constructs.
Measurement model results.
| Construct/dimension/indicator | VIF | Loading/weight | Composite reliability (CR) | Average variance extracted (average) |
|---|---|---|---|---|
| Structural dimension of social capital (first order reflective construct) | 0.901 | 0.803 | ||
| Eigen | 0.849 | |||
| Partners | 0.940 | |||
| Partner dimension of social capital (first order formative construct)a | n.a. | n.a. | ||
| Cultural diversity | 0.822 | |||
| Technological diversity | 0.3442 | |||
| Relational dimension of social capital (first order Reflective construct) | n.a. | n.a. | ||
| Multiple links | 1 | |||
| Resource dimension of social capital (first order Reflective construct) | 0.987 | 0.975 | ||
| Partners Group A | 0.986 | |||
| Partners Group A&B | 0.988 | |||
| Value creation: market share (first order formative construct)a | n.a. | n.a. | ||
| NIMS | 1.079 | 0.391 | ||
| IMS | 1.079 | 0.718 |
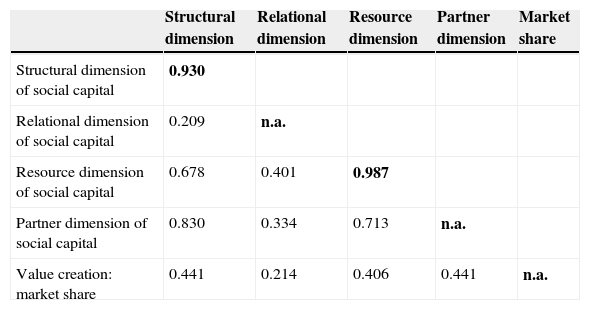
Finally, to assess discriminant validity –that is to say, that the constructs analyzed are different– AVE should be greater than the variance shared between the construct and other constructs in the model (the squared correlation between the two constructs). For adequate discriminant validity, the diagonal elements should be significantly greater than the off-diagonal elements in the corresponding rows and columns (Barclay et al., 1995). As can be observed in Table 3, all constructs fulfil this condition.
Correlations between constructs.
| Structural dimension | Relational dimension | Resource dimension | Partner dimension | Market share | |
|---|---|---|---|---|---|
| Structural dimension of social capital | 0.930 | ||||
| Relational dimension of social capital | 0.209 | n.a. | |||
| Resource dimension of social capital | 0.678 | 0.401 | 0.987 | ||
| Partner dimension of social capital | 0.830 | 0.334 | 0.713 | n.a. | |
| Value creation: market share | 0.441 | 0.214 | 0.406 | 0.441 | n.a. |
Note: The bold numbers on the diagonal are the square root of the average variance extracted (AVE).
Off-diagonal elements are correlations among constructs. n.a.: not applicable
Fig. 3 is a graphical representation of the path coefficients (β), the significance level of each of the hypothesized relationships and the variance explained (R2) in the dependent constructs as well as the path coefficients. A bootstrap (5.00 sub-samples) was used to generate standard errors and t-statistics. For understanding these results a one-tailed t-student distribution is used to contrast this hypothesis. Support for each general hypothesis was determined by examining the sign and statistical significance of the t-values for each corresponding path.
Estimated casual relationships in the structural model based on Tsai and Ghoshal (1998).
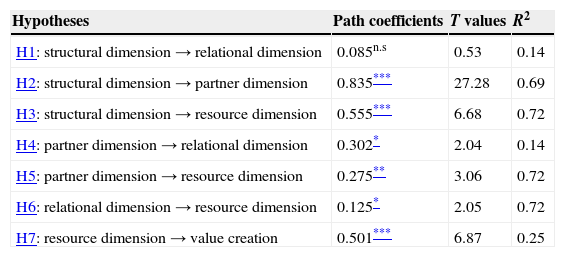
From these analyses we observe that all the constructs are intensively interrelated, as suggested in the literature. Table 4 shows that only one hypothesis has not been confirmed in our model (H1) as the structural dimension does not exert a significant influence on the relational dimension of social capital. It seems that the rationale behind the creation of trustworthiness in the construction industry is derived from a different issue such as certain attributes of partners. Another important issue to highlight is the strength of the relationships, with six out of the seven hypotheses showing a p<0.001. The assessment of the structural model is based on the algebraic sign, magnitude and significance of the structural path coefficients, the R2 values (R2=0.25). This fact reflects the cohesion of the constructs that comprise social capital and demonstrates that this could be viewed as a multidimensional concept (Koka & Prescott, 2002).
Model statistics.
| Hypotheses | Path coefficients | T values | R2 |
|---|---|---|---|
| H1: structural dimension→relational dimension | 0.085n.s | 0.53 | 0.14 |
| H2: structural dimension→partner dimension | 0.835*** | 27.28 | 0.69 |
| H3: structural dimension→resource dimension | 0.555*** | 6.68 | 0.72 |
| H4: partner dimension→relational dimension | 0.302* | 2.04 | 0.14 |
| H5: partner dimension→resource dimension | 0.275** | 3.06 | 0.72 |
| H6: relational dimension→resource dimension | 0.125* | 2.05 | 0.72 |
| H7: resource dimension→value creation | 0.501*** | 6.87 | 0.25 |
n.s., not significant (based on a Student t (499) distribution with one tail). t(0.05; 499)=1.64791345; t(0.01; 499)=2.333843952; t(0.001; 499)=3.106644601.
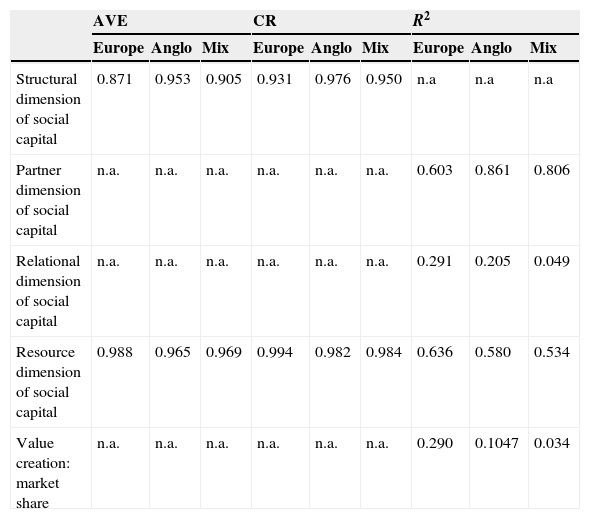
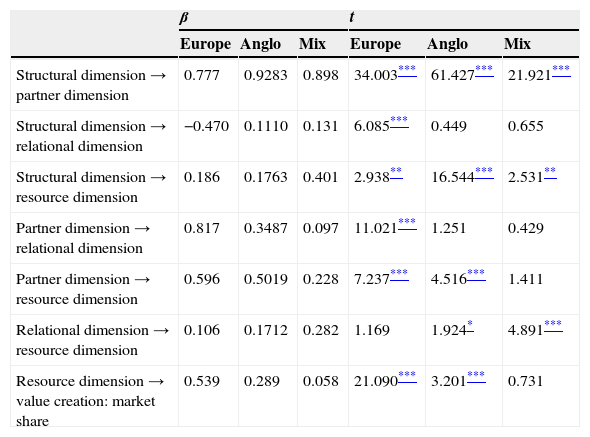
To analyze how the corporate governance styles influence on the dimensions of the alliance portfolio configuration, the general sample was divided into three sub-groups according to managerial management style. Aguilera and Jackson (2003) identified two main corporate governance groups: the Anglo-American and the Continental European. Although other taxonomies exist (Chen, 1999; Weimer & Pape, 1999), it is very difficult to assign all the countries to either group. We therefore used a classification in which countries that had commonly been associated with the groups proposed by Aguilera and Jackson (2003) (Anglo-American or Continental European) were placed in these groups, whilst the rest were assigned to an unidentified group, labelled “Mixture”. Tables 5 and 6 summarize the results of the structural model for the three samples.
Average variance explained, construct reliability, variance explained and predictive relevance.
| AVE | CR | R2 | |||||||
|---|---|---|---|---|---|---|---|---|---|
| Europe | Anglo | Mix | Europe | Anglo | Mix | Europe | Anglo | Mix | |
| Structural dimension of social capital | 0.871 | 0.953 | 0.905 | 0.931 | 0.976 | 0.950 | n.a | n.a | n.a |
| Partner dimension of social capital | n.a. | n.a. | n.a. | n.a. | n.a. | n.a. | 0.603 | 0.861 | 0.806 |
| Relational dimension of social capital | n.a. | n.a. | n.a. | n.a. | n.a. | n.a. | 0.291 | 0.205 | 0.049 |
| Resource dimension of social capital | 0.988 | 0.965 | 0.969 | 0.994 | 0.982 | 0.984 | 0.636 | 0.580 | 0.534 |
| Value creation: market share | n.a. | n.a. | n.a. | n.a. | n.a. | n.a. | 0.290 | 0.1047 | 0.034 |
Structural model results.
| β | t | |||||
|---|---|---|---|---|---|---|
| Europe | Anglo | Mix | Europe | Anglo | Mix | |
| Structural dimension→partner dimension | 0.777 | 0.9283 | 0.898 | 34.003*** | 61.427*** | 21.921*** |
| Structural dimension→relational dimension | −0.470 | 0.1110 | 0.131 | 6.085*** | 0.449 | 0.655 |
| Structural dimension→resource dimension | 0.186 | 0.1763 | 0.401 | 2.938** | 16.544*** | 2.531** |
| Partner dimension→relational dimension | 0.817 | 0.3487 | 0.097 | 11.021*** | 1.251 | 0.429 |
| Partner dimension→resource dimension | 0.596 | 0.5019 | 0.228 | 7.237*** | 4.516*** | 1.411 |
| Relational dimension→resource dimension | 0.106 | 0.1712 | 0.282 | 1.169 | 1.924* | 4.891*** |
| Resource dimension→value creation: market share | 0.539 | 0.289 | 0.058 | 21.090*** | 3.201*** | 0.731 |
Certain differences can be directly observed from comparing the three results. The most relevant issue is the difference in the strength of the relationships (relational dimension). Accordingly, the importance of the relationship between the structural and relational dimensions is only significant for the European group. Moreover, in the two main groups (Anglo-American and Continental European) the partner dimension is linked to the resource dimension, which in turn is linked to the dependent variable. However, this does not occur in the Mixture group.
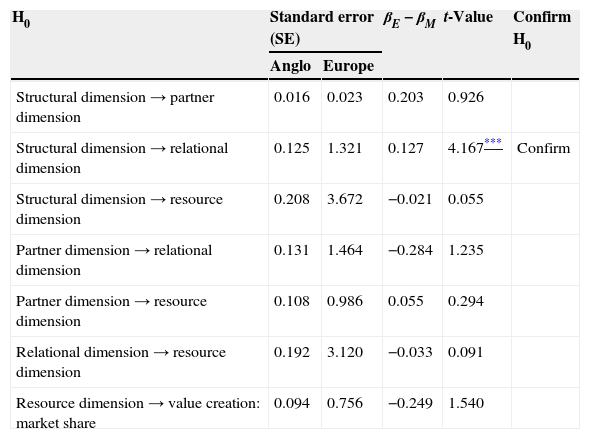
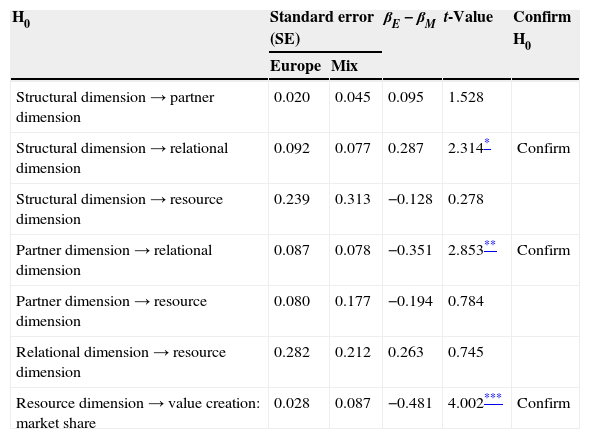
No measurement invariance was found between the groups (Eberl, 2010; Vandenberg & Lance, 2000; Williams, Vandenberg, & Edwards, 2009). In view of these results, we proceeded to examine whether the differences in the results between the two models were significant. To carry out the calculations we followed Chin's (2000) indications for multi-group analysis, with the adaptation made by Eberl (2010).
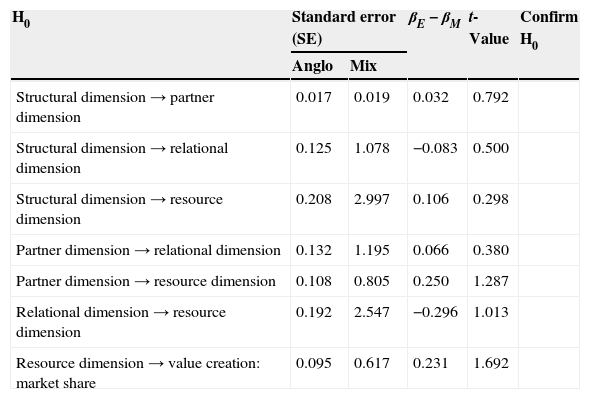
Results of the different sample comparisons are shown in Tables 7–9. Although more differences might be expected, some interesting insights can be obtained from these results.
t-Statistic for multi-group analysis Anglo-Europe.
| H0 | Standard error (SE) | βE−βM | t-Value | Confirm H0 | |
|---|---|---|---|---|---|
| Anglo | Europe | ||||
| Structural dimension→partner dimension | 0.016 | 0.023 | 0.203 | 0.926 | |
| Structural dimension→relational dimension | 0.125 | 1.321 | 0.127 | 4.167*** | Confirm |
| Structural dimension→resource dimension | 0.208 | 3.672 | −0.021 | 0.055 | |
| Partner dimension→relational dimension | 0.131 | 1.464 | −0.284 | 1.235 | |
| Partner dimension→resource dimension | 0.108 | 0.986 | 0.055 | 0.294 | |
| Relational dimension→resource dimension | 0.192 | 3.120 | −0.033 | 0.091 | |
| Resource dimension→value creation: market share | 0.094 | 0.756 | −0.249 | 1.540 | |
t-Statistic for multi-group analysis Europe-mix.
| H0 | Standard error (SE) | βE−βM | t-Value | Confirm H0 | |
|---|---|---|---|---|---|
| Europe | Mix | ||||
| Structural dimension→partner dimension | 0.020 | 0.045 | 0.095 | 1.528 | |
| Structural dimension→relational dimension | 0.092 | 0.077 | 0.287 | 2.314* | Confirm |
| Structural dimension→resource dimension | 0.239 | 0.313 | −0.128 | 0.278 | |
| Partner dimension→relational dimension | 0.087 | 0.078 | −0.351 | 2.853** | Confirm |
| Partner dimension→resource dimension | 0.080 | 0.177 | −0.194 | 0.784 | |
| Relational dimension→resource dimension | 0.282 | 0.212 | 0.263 | 0.745 | |
| Resource dimension→value creation: market share | 0.028 | 0.087 | −0.481 | 4.002*** | Confirm |
t-Statistic for multi-group analysis Anglo-mix.
| H0 | Standard error (SE) | βE−βM | t-Value | Confirm H0 | |
|---|---|---|---|---|---|
| Anglo | Mix | ||||
| Structural dimension→partner dimension | 0.017 | 0.019 | 0.032 | 0.792 | |
| Structural dimension→relational dimension | 0.125 | 1.078 | −0.083 | 0.500 | |
| Structural dimension→resource dimension | 0.208 | 2.997 | 0.106 | 0.298 | |
| Partner dimension→relational dimension | 0.132 | 1.195 | 0.066 | 0.380 | |
| Partner dimension→resource dimension | 0.108 | 0.805 | 0.250 | 1.287 | |
| Relational dimension→resource dimension | 0.192 | 2.547 | −0.296 | 1.013 | |
| Resource dimension→value creation: market share | 0.095 | 0.617 | 0.231 | 1.692 | |
Despite, we expected to find greater differences between the three groups, some of the found must be remarked. Thus, the Continental European group has more differences than the other two groups, whilst no differences were found between the Mixture and Anglo-American groups. Therefore, our H8 has been confirmed.
DiscussionThis work aims to contribute to a better understanding of the configuration of the social capital. To achieve this objective, we go deeper into the conceptualization and measurement of the dimensions of the social capital configuration by analyzing the direct relationships between them. Moreover, we consider that it is necessary to examine how certain contingent factors affect the development of the social capital's dimensions. As for the work's contribution to international management, apart from the context used, whilst most of the literature has focused on the effect of the social capital in the internationalization process of small firms, we have applied the concept to the performance of MNCs.
The results show how the strategic configuration of the different dimensions of the alliance portfolio affects the international performance of firms. An analysis of the results leads to the conclusion that in a network that is as sparse and non-heterogeneous as the one we have analyzed, the firms that occupy a more central position will be able to do two things. On the one hand, to increase the quality of their inter-organizational relationships through technological and cultural diversity; and, on the other hand, to have a greater access to actors with valuable resources.
The second research question set out refers to how cross-national diversity leads to a different management of the dimensions of social capital configuration. To answer this question, we carried out a multi-group analysis. We must enhance the proximity between the mixed group and Anglo-American firms. This group, made up mainly of Asiatic and Middle Eastern firms, shows no significant differences to the Anglo-American firms. The most important result was that the Continental European firms strengthen networks of inter-organizational relationships and multiplex ties (the relational dimension of social capital) by reinforcing commitment and trust, as there is a high density of relationships between firms. By contrast, U.S. or British firms are much less involved in inter-organizational networks and the development of multiplex ties (relational dimension) (Aguilera & Jackson, 2003). From the results obtained we can draw two conclusions. First, that there are significant differences in the way that Anglo-American and Continental European firms configure and manage the relational dimension of social capital configuration and their relationships with both the structural and partner dimensions. Second, that the different ways of managing the different dimensions of social capital achieve similar results, as there are no significant differences regarding their international market share.
This study is not however without its limitations. Firstly, there are those arising from the methodology used. The exploratory nature of the study required the use of flexible techniques, such as structural equations, which need the subsequent application of confirmatory techniques to support the results. Secondly, there are the limitations of using sector characteristics: while this has the advantage of allowing the network to be analyzed at a global level, it shows little cohesion. Testing the conclusions in other sectors where there is a stronger connection between members could be an important line of research. This would allow us to advance in our understanding of the effect of social capital on a firm's international performance.
This research was supported by the Ministerio de Ciencia e Innovación, Spain (ECO2009-12742).


