Sexual dysfunctions are a highly prevalent problem. It is necessary to have instruments adapted to the Colombian population in order to evaluate their sexual functioning because to date none of them have been validated. The aim of this study was to adapt and validate the Massachusetts General Hospital-Sexual Functioning Questionnaire in Colombian population, and compare it with a similar sample from Spain. Two different samples were used in this study. On one hand, a sample of expert judges who performed the cultural adaptation and the evaluation of the scale, and on the other hand, a second end sample of 1117 participants -men and women of both nationalities- who answered the questionnaire -together with others- through a virtual platform. Some of the items were adjusted based on the initial results of the evaluation by the expert judges. Cronbach's alpha between .81 and .92 were obtained after the application of the test. The psychometric properties of the scale are adequate and this instrument properly correlates with other criterion variables. Construct validity was evaluated using factorial invariance. The unidimensional configural model for men (RMSEA=.000; CFI=1) and for women (RMSEA=.048, CFI=.997) had an adequate fit, and a level of strict invariance was also reached. Screening can be performed with this first validated scale in order to evaluate the sexual difficulties of the Colombian population and compare them with the Spanish population.
Las disfunciones sexuales son un problema muy frecuente. Es necesario contar con instrumentos adaptados a la población colombiana con el fin de evaluar su funcionamiento sexual porque hasta la fecha ninguno de ellos se ha validado. El objetivo de este estudio fue adaptar y validar el Cuestionario de funcionamiento sexual del Hospital General de Massachusetts en la población colombiana y compararla con una muestra similar de España. Se utilizaron dos muestras diferentes en este estudio. Por una parte, una muestra de jueces expertos que realizaron la adaptación cultural y la evaluación de la escala, y por la otra, una segunda muestra final de 1.117 participantes - hombres y mujeres de ambas nacionalidades - que respondieron el cuestionario, junto con otros, a través de una plataforma virtual. Algunos de los elementos se ajustaron según los resultados iniciales de la evaluación realizada por jueces expertos. Se obtuvieron coeficientes alfa de Cronbach entre 0.81 y 0.92 después de la aplicación de la prueba. Las propiedades psicométricas de la escala son adecuadas y este instrumento se correlaciona debidamente con otras variables para el criterio. La validez del constructo se evaluó mediante invariancia factorial. El modelo configural unidimensional para los hombres (RMSEA=0.000; CFI=1) y para las mujeres (RMSEA=0.048; CFI=0.997) tenía un ajuste adecuado, y también se alcanzó un nivel de estricta invariancia. Puede realizarse un cribado con esta primera escala validada para evaluar las dificultades sexuales de la población colombiana y compararlas con las de la población española.
Sexual dysfunctions are a problem of great impact on the world's population (World Health Organization, 2000). Sexual functioning disorders may arise during different stages of the sexual response cycle. Thus, desire, arousal, orgasm and general sexual satisfaction can be affected. Pain in the genital area at some point during sexual intercourse is also considered as a sexual functioning disorder (American Psychiatric Association, 2000; Laumann, Paik, & Rosen, 1999). Patients who have sexual dysfunctions may be also have anxiety and depression disorders (Michael & O’Keane, 2000; Ozkan, Orhan, Aktas, & Coskuner, 2015; Rajkumar & Kumaran, 2015). The prevalence of sexual dysfunction in men is estimated between 20% and 30%, while in women it ranges between 40% and 45% (Lewis et al., 2004, 2010; Lewis, 2011; Nicolosi et al., 2004).
The Diagnostic and Statistical Manual of Mental Disorders – 5th edition (DSM 5) presents the following prevalences: delayed ejaculation is less than 1%; erectile disorder between 13% and 50%; hypoactive sexual desire disorder between 6% and 41% and premature ejaculation between 20% and 30%. For women, female orgasmic disorder varies between 10% and 42%; data regarding the sexual interest/arousal disorder are not shown since it has recently been defined. Finally, 15% of women may have genito/pelvic pain disorder (American Psychiatric Association, 2013). Similar data have been found in other studies (DeRogatis & Burnett, 2008; Lewis et al., 2010).
As for prevalence in Colombia, only a few studies report the prevalence and incidence of sexual dysfunctions. A study by Acuña and Ceballos (2005) showed that 54.5% of the male population has sexual dysfunctions, and the most frequent ones are erectile dysfunction with 43.27% and premature ejaculation with 14.93%; another study reported a prevalence of 55.8% in women (García, Aponte, & Moreno, 2005). Desire and arousal-related problems are most prevalent in this sample. However, these are approximate data estimated based on small samples and unvalidated scales.
It is important to have validated instruments in order to evaluate sexual functioning thereby allowing to obtain reliable data. There are many instruments to evaluate sexual functioning (Fisher, Davis, Yarber, & Davis, 2013; Sierra, Santos-Iglesias, Vallejo-Medina, & Moyano, 2014). One of these tests is the Massachusetts General Hospital-Sexual Functioning Questionnaire (MGH-SFQ; Labbate & Lare, 2001), which was developed based on the Guided Interview Questionnaire and the Arizona Sexual Experience Scale (Fava, Rankin, Alpert, Nierenberg, & Worthington, 1998). This questionnaire consists of five different items which evaluate sexual interest, arousal, the ability to reach orgasms, the ability to reach and maintain an erection (for men only) and general satisfaction. Values were assigned to the Likert response scale as follows: 0=totally reduced, 1=strongly reduced, 2=moderately reduced, 3=slightly reduced and 4=normal. The original study showed that the scale correlated significantly in each of its dimensions with the CSFQ scale (Labbate & Lare, 2001). In the validation study for Spain, this scale showed an internal consistency of .90 and .93 in men and in women (Sierra, Vallejo-Medina, Santos-Iglesias, & Fernandez, 2012).
The MGH-SFQ has proven to be reliable in identifying sexual dysfunctions in the target population; it has been applied to detect sexual dysfunction in patients under antidepressant treatment (Taylor et al., 2013), with psychological problems (Hoyer, Uhmann, Rambow, & Jacobi, 2009) or in order to evaluate the effect other substances have on sexual functioning (Dording, Mischoulon, Shyu, Alpert, & Papakostas, 2012).
The aim of this study was to adapt and validate the MGH-SFQ in a sample of Colombian men and women as well as to calculate its factorial equivalence as compared to its Spanish version.
MethodParticipantsThe sample initially included a total of 1797 participants, who were selected incidentally, seeking to achieve a balance regarding sex and age. Inclusion criteria were: being of age, having a Colombian or a Spanish nationality -as appropriate- accepting voluntarily to partake in the study and having answered the questionnaire thoroughly. Based on these criteria, the final sample consisted of 1117 participants, 621 Colombian nationals and 496 Spanish nationals. The age range for the Colombian population ranged between 18 and 72 years (M=32.04, SD=10.87). Age ranges in Spain were 18 and 70 years (M=33.94, SD=12.61), and statistically significant differences were observed between the two countries t(1115)=2.69; p<.01; d=0.16. The schooling level in Colombia was M=16.69 years (SD=2.84) and in Spain M=15.88 years (SD=3.97), with statistically significant differences t(1104)=3.95; p<.01; d=0.23. Fifty-five point nine percent of respondents who were tested in Colombia were single, versus 60.5% in Spain. According to Kinsey's Sexual Orientation Scale (Kinsey, Pomeroy, Martin, & Gebhard, 1953, and Kinsey, Pomeroy, & Martin, 1948), 84% of participants in Colombia stated being exclusively heterosexual, 6.9% mainly heterosexual, and 3.1% exclusively homosexual, among other smaller percentages, whereas in Spain, 82% of participants stated to be exclusively heterosexual, 7.5% mainly heterosexual and 3.8% exclusively homosexual.
InstrumentsMassachusetts General Hospital-Sexual Functioning Questionnaire (MGH-SFQ; Labbate & Lare, 2001). Description and characteristics of this questionnaire can be found in the introduction (see Appendix 1).
Sexual Opinion Survey (SOS; Fisher, White, Byrne, & Kelley, 1988). It originally consisted of 21 items answered on a 7-alternative Likert scale ranging from 0=totally false to 6=totally true. The SOS evaluates the erotophilia-erotophobia personality trait, which identifies the positive or negative evaluation that people have toward stimuli of sexual content. A brief 6-item version of the SOS scale which was validated in Spain and Colombia (Vallejo-Medina et al., 2015a, 2015b; Vallejo-Medina, Granados, & Sierra, 2014) was used in this study; this version has shown adequate reliability (α=.74). Reliability in this study was .85 for Colombia and .66 for Spain.
Sexual Assertiveness Scale (SAS; Morokoff et al., 1997). The brief 9-item version of the scale (Vallejo-Medina et al., 2015a, 2015b) was used. This scale was based on the adaptation by Sierra, Vallejo-Medina, Santos and Iglesias (2011), and Sierra, Santos-Iglesias and Vallejo-Medina (2012). The SAS consists of three dimensions: Initiation, which is the ability to initiate sexual relations whenever desired, as well as carrying them out as desired; refusal, which is the ability to reject sexual unwanted practices or contact; Sexually Transmitted Diseases – unwanted Pregnancy (STD-P), which is the ability to negotiate the use of a condom during sexual relations (Morokoff et al., 1997). Each subscale consists of three items scored from 0=never to 4=always. The following reliability data were found in the three subscales in this study (initiation=.72 and 0.75; refusal=.60 and .82; and STD-P=.90 and .91 for Colombia and Spain respectively).
Sexuality Scale (SS; Snell & Papini, 1989). The 15-item brief version of Wiederman and Allgeier (1993) as well as the version validated in Colombia and Spain (Soler et al., 2015) were used in this study. The aforementioned questionnaire has three subscales: Sexual Self-Esteem (SS), Sexual Depression (SD) and Sexual Preoccupation (SP). SS is defined as the ability to experience sexuality in a positive and confident manner. SD is the feeling of experiencing depression about one's own sexuality. The SP is the tendency to think excessively about sex (Snell & Papini, 1989). This scale is answered using a 5-category Likert scale ranging from strongly disagree to strongly agree. The Cronbach's alphas for each subscale in this questionnaire were as follows: sexual self-esteem .82 in Colombia and .87 in Spain; sexual depression .86 for both countries; and sexual preoccupation .85 for both countries.
The Rosenberg Self-Esteem Scale (RSES; Rosenberg, 1965). This study was based on the validated version for Spain by Martin-Albo, Nuñez, Navarro and Grijalvo (2007) and for Colombia (Gomez-Lugo et al., in press). The scale consists of 10 items which evaluate general self-esteem; it is answered on a Likert scale wherein 1=strongly disagree, 2=disagree, 3=agree, 4=strongly agree. Therefore, the overall score ranges from 10 to 40 points. Higher scores indicate better self-esteem. The Cronbach's alphas were .83 for Colombia and .87 for Spain.
ProcedureThe scales were reviewed by four Colombian expert psychologists who had lived for at least two years in Spain. These experts contributed in the cultural adaptation of the scales from Spanish of Spain into Spanish of Colombia. In addition, four experts in psychometrics and/or sexuality evaluated some of the properties of the items.
Initially, the cultural adaptation of the MGH-SFQ was based on the version that had already been validated in Spain (Sierra, Vallejo-Medina, et al., 2012), following the guidelines by Vallejo-Medina et al. (2015a, 2015b), which was based on the proposal by Muñiz, Elosua and Hambleton (2013), as well as the recommendations of Elosua, Mujika, Almeida, and Hermosilla (2014) and APA, AERA and NCME (2014).
Once this first adaptation was performed, the questionnaire was submitted to 4 experts in psychometrics and/or sexuality who evaluated the adequacy of the items. All the experts evaluated the item's representativeness of the sexual functioning construct, the item's comprehension in the Colombian version, the single item's interpretation (no ambiguity), and the item's clarity (how concise the item is). The experts rated the items in different categories ranging from 1 (nothing …) to 4 (very …) using the table of specification of the items (Osterlind, 1989). The ICaiken program (Merino & Livia, 2009) was used in order to calculate the confidence interval of the Aiken's V (Aiken, 1980, 1985). Scores below .50 at the lower limit (CI=95%) were established as the cutoff point for Aiken's V and a criterion of inadequacy of the item (Merino & Livia, 2009).
The final sampling was performed through virtual platforms. The questionnaire was entered in Typeform© and it was applied in an homologous way in both countries. Sampling was conducted between October 23, 2014 and February 24, 2015.
Data analysisSPSS 20.0 was used to analyze some of the psychometric properties of the items. EQS 6.1 was used to calculate the factorial invariance (FI) as in other studies of sexuality (Monge, Sierra, & Salinas, 2013). The FI was evaluated progressively under a Mean and Covariances Structures procedure (MACS), as recommended by Byrne et al. (2009). Multivariate data distribution was calculated using Mardia's test, wherein values above 5 are indicative of non-normality. This test indicated results of 38.0 in Colombia and 74.6 in Spain for men, and 17.04 in Colombia and 14.36 in Spain for women.
Thus, the Maximum Likelihood method, Robust (ML, R) was used as the estimation method since the parameter of normal distribution was not met. Regarding progressive factorial invariance, the configural invariance was evaluated during the first stage: no restrictions in the model. Metric or weak invariance was evaluated during the second stage: the factorial loads are restricted evaluating the equivalence of the loads of each item regarding the factor. Strong invariance was measured during the third stage – intercepts were restricted- and strict invariance measurements showed that the variances of the errors were restricted. The indices taken into account in order to evaluate the fit of the models were as follows: the Root Mean Square Error Approximation (RMSEA; Hu & Bentler, 1999), the confidence interval – at 90% – and the Comparative Fit Index (CFI; Bentler, 1990). Values below .08 for the RMSEA (Browne & Cudeck, 1992) and greater than .95 for the CFI were considered indicative of good fit. A decrease no greater than .01 with regard to the least restrictive model was taken as evidence of invariance (Cheung & Rensvold, 2002). The Akaike Information Criterion (AIC; Akaike, 1974) was also taken into account, which indicates absence of FI should the increase with regard to the least restrictive model be considerable.
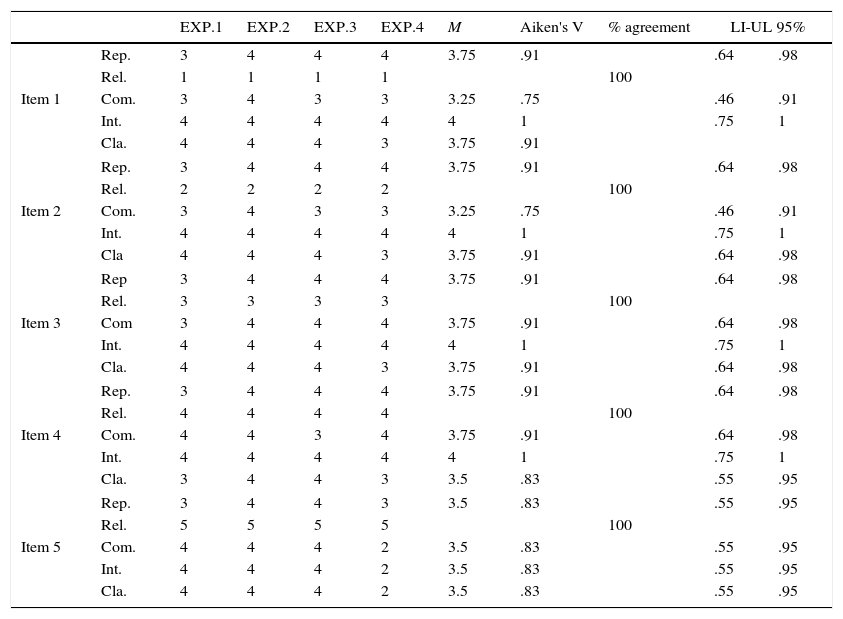
ResultsProperties of items and content validityTable 1 shows the qualitative evaluation that four experts in psychometrics and/or sexuality performed on the five items from the scale of the Colombian version. The lower limit of Aiken's V was not always above 50%; for this reason, it was necessary to make some adjustments to the items such as modifying their wording as recommended. Content validity was optimal for all items with a 100% agreement by the judges regarding the relevance of all items.
Evaluation of the characteristics of the items of the Massachusetts General Hospital-Sexual Functioning Questionnaire by experts.
| EXP.1 | EXP.2 | EXP.3 | EXP.4 | M | Aiken's V | % agreement | LI-UL 95% | |||
|---|---|---|---|---|---|---|---|---|---|---|
| Item 1 | Rep. | 3 | 4 | 4 | 4 | 3.75 | .91 | .64 | .98 | |
| Rel. | 1 | 1 | 1 | 1 | 100 | |||||
| Com. | 3 | 4 | 3 | 3 | 3.25 | .75 | .46 | .91 | ||
| Int. | 4 | 4 | 4 | 4 | 4 | 1 | .75 | 1 | ||
| Cla. | 4 | 4 | 4 | 3 | 3.75 | .91 | ||||
| Item 2 | Rep. | 3 | 4 | 4 | 4 | 3.75 | .91 | .64 | .98 | |
| Rel. | 2 | 2 | 2 | 2 | 100 | |||||
| Com. | 3 | 4 | 3 | 3 | 3.25 | .75 | .46 | .91 | ||
| Int. | 4 | 4 | 4 | 4 | 4 | 1 | .75 | 1 | ||
| Cla | 4 | 4 | 4 | 3 | 3.75 | .91 | .64 | .98 | ||
| Item 3 | Rep | 3 | 4 | 4 | 4 | 3.75 | .91 | .64 | .98 | |
| Rel. | 3 | 3 | 3 | 3 | 100 | |||||
| Com | 3 | 4 | 4 | 4 | 3.75 | .91 | .64 | .98 | ||
| Int. | 4 | 4 | 4 | 4 | 4 | 1 | .75 | 1 | ||
| Cla. | 4 | 4 | 4 | 3 | 3.75 | .91 | .64 | .98 | ||
| Item 4 | Rep. | 3 | 4 | 4 | 4 | 3.75 | .91 | .64 | .98 | |
| Rel. | 4 | 4 | 4 | 4 | 100 | |||||
| Com. | 4 | 4 | 3 | 4 | 3.75 | .91 | .64 | .98 | ||
| Int. | 4 | 4 | 4 | 4 | 4 | 1 | .75 | 1 | ||
| Cla. | 3 | 4 | 4 | 3 | 3.5 | .83 | .55 | .95 | ||
| Item 5 | Rep. | 3 | 4 | 4 | 3 | 3.5 | .83 | .55 | .95 | |
| Rel. | 5 | 5 | 5 | 5 | 100 | |||||
| Com. | 4 | 4 | 4 | 2 | 3.5 | .83 | .55 | .95 | ||
| Int. | 4 | 4 | 4 | 2 | 3.5 | .83 | .55 | .95 | ||
| Cla. | 4 | 4 | 4 | 2 | 3.5 | .83 | .55 | .95 | ||
Note. Rep: representativeness; Rel: relevance; C: comprehension; I: interpretation; CL: clarity; Exp: expert; M: mean; LI: lower limit; UL: upper limit.
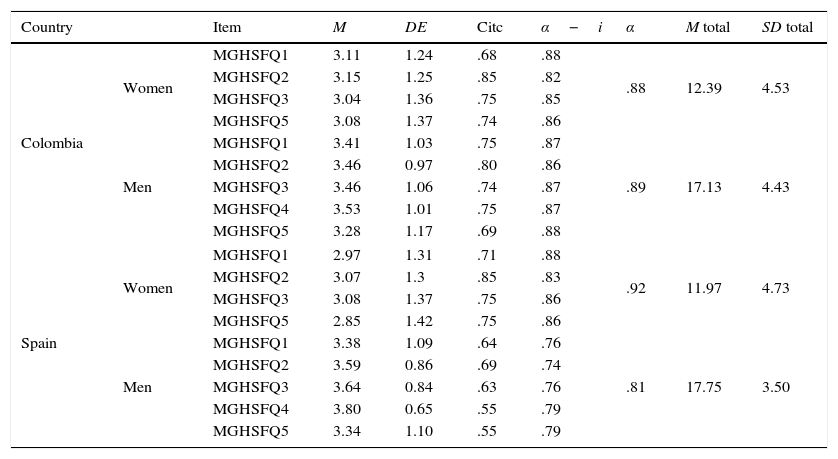
Table 2 shows that the indicators analyzed were generally adequate. Both versions were reliable and had very similar values in both countries. Corrected item-total correlations (Citc) are always greater than .30. No significant increase in Cronbach's alpha was observed if an item was removed, and the mean values of the items were slightly above the theoretical average of response (2.5). Furthermore, SD's above 1 indicated adequate response variability. Cronbach's alphas for this scale were .89 and .81 for men in Colombia and Spain respectively; and .89 and .92 for women in Colombia and Spain respectively.
Reliability and some properties of the items for both men and women from Colombia and Spain.
| Country | Item | M | DE | Citc | α−i | α | M total | SD total | |
|---|---|---|---|---|---|---|---|---|---|
| Colombia | Women | MGHSFQ1 | 3.11 | 1.24 | .68 | .88 | .88 | 12.39 | 4.53 |
| MGHSFQ2 | 3.15 | 1.25 | .85 | .82 | |||||
| MGHSFQ3 | 3.04 | 1.36 | .75 | .85 | |||||
| MGHSFQ5 | 3.08 | 1.37 | .74 | .86 | |||||
| Men | MGHSFQ1 | 3.41 | 1.03 | .75 | .87 | .89 | 17.13 | 4.43 | |
| MGHSFQ2 | 3.46 | 0.97 | .80 | .86 | |||||
| MGHSFQ3 | 3.46 | 1.06 | .74 | .87 | |||||
| MGHSFQ4 | 3.53 | 1.01 | .75 | .87 | |||||
| MGHSFQ5 | 3.28 | 1.17 | .69 | .88 | |||||
| Spain | Women | MGHSFQ1 | 2.97 | 1.31 | .71 | .88 | .92 | 11.97 | 4.73 |
| MGHSFQ2 | 3.07 | 1.3 | .85 | .83 | |||||
| MGHSFQ3 | 3.08 | 1.37 | .75 | .86 | |||||
| MGHSFQ5 | 2.85 | 1.42 | .75 | .86 | |||||
| Men | MGHSFQ1 | 3.38 | 1.09 | .64 | .76 | .81 | 17.75 | 3.50 | |
| MGHSFQ2 | 3.59 | 0.86 | .69 | .74 | |||||
| MGHSFQ3 | 3.64 | 0.84 | .63 | .76 | |||||
| MGHSFQ4 | 3.80 | 0.65 | .55 | .79 | |||||
| MGHSFQ5 | 3.34 | 1.10 | .55 | .79 | |||||
Note. M: mean; SD: standard deviation; Citc: corrected total-item correlations; α−i: Cronbach's alpha if item is removed; α: Cronbach's alpha.
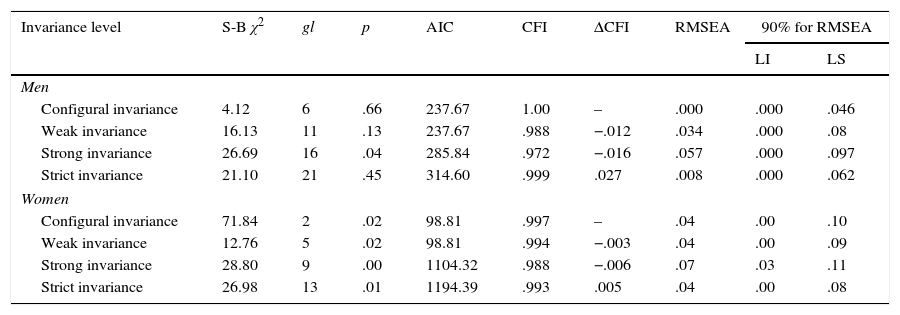
Progressive factorial invariance was performed separately for men and women (Table 3) in order to evaluate the scale's construct validity and establish the factorial equivalence between versions of Spain and Colombia. Analysis began with the model's most basic level of restriction: the configural variance – without constrictions. Good fit of the data matrix was observed in the proposed theoretical model, which allows to accept the equivalence of the basic measurement models between the two versions of the test. As for weak invariance, proper fit of the model is observed, as well as compliance with factorial invariance for both men and women, with a decrease in CFI no greater than .01, thereby indicating that the factor loads are equivalent in both scales. In regards to strong invariance, a good fit is observed in both men and women. However, the CFI increase for men is slightly higher than expected, though AIC increase is not very high, so it was considered that this level of invariance is also met. Finally, for strict invariance, which was the last level tested, results also showed a good fit in RMSEA values in both men and women; the CFI and AIC increase indicate equal estimation error in evaluating both the Colombian and the Spanish versions.
Invariance fit indices for men and women model.
| Invariance level | S-B χ2 | gl | p | AIC | CFI | ΔCFI | RMSEA | 90% for RMSEA | |
|---|---|---|---|---|---|---|---|---|---|
| LI | LS | ||||||||
| Men | |||||||||
| Configural invariance | 4.12 | 6 | .66 | 237.67 | 1.00 | – | .000 | .000 | .046 |
| Weak invariance | 16.13 | 11 | .13 | 237.67 | .988 | −.012 | .034 | .000 | .08 |
| Strong invariance | 26.69 | 16 | .04 | 285.84 | .972 | −.016 | .057 | .000 | .097 |
| Strict invariance | 21.10 | 21 | .45 | 314.60 | .999 | .027 | .008 | .000 | .062 |
| Women | |||||||||
| Configural invariance | 71.84 | 2 | .02 | 98.81 | .997 | – | .04 | .00 | .10 |
| Weak invariance | 12.76 | 5 | .02 | 98.81 | .994 | −.003 | .04 | .00 | .09 |
| Strong invariance | 28.80 | 9 | .00 | 1104.32 | .988 | −.006 | .07 | .03 | .11 |
| Strict invariance | 26.98 | 13 | .01 | 1194.39 | .993 | .005 | .04 | .00 | .08 |
Note. CFI: Comparative Fit Index; S-B χ2: Santorra-Bentler Scaled Chi-Square; RMSEA: Root Mean Square Error of Approximation; LL: lower limit; UL: upper limit.
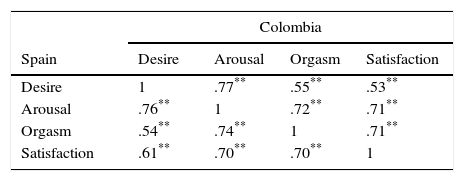
MGH-SFQ scores were correlated with the SOS, the SAS, the SS and the RSES scores (Table 4) in order to evaluate its external validity. These scales evaluate some variables theoretically related to the MGH-SFQ. The majority of the scales show a significant correlation as compared to the MGH-SFQ and they aim at the expected direction. The only subscale that does not correlate with the test is the assertiveness STD-P. Furthermore, the intra-items correlations are very similar for Spain and Colombia, as shown in Tables 5 and 6.
Correlations with the different tests evaluated.
| Country | SS | SD | SP | IA | RA | STD-P | GS | SOS | |
|---|---|---|---|---|---|---|---|---|---|
| Colombia | MGH-SFQ | .31** | −.43** | .21** | .20** | −.24** | −.01 | .25** | .08* |
| Spain | MGH-SFQ | .27** | −.39** | .19** | .13** | −.23** | −.04 | .28** | .17** |
Note. MGH-SFQ: Massachusetts General Hospital-Sexual Functioning Questionnaire; SS: sexual self-esteem; SD: sexual depression; SP: sexual preoccupation; IA: initiation assertiveness; RA: refusal assertiveness; STD-P: Sexual Transmitted Diseases-Pregnancy Sexual Assertiveness; GS: general self-esteem; SOS: Sexual Opinion Survey.
Correlations between items of MSG-SFQ for women.
| Colombia | ||||
|---|---|---|---|---|
| Spain | Desire | Arousal | Orgasm | Satisfaction |
| Desire | 1 | .77** | .55** | .53** |
| Arousal | .76** | 1 | .72** | .71** |
| Orgasm | .54** | .74** | 1 | .71** |
| Satisfaction | .61** | .70** | .70** | 1 |
Correlations for Colombia are above the diagonal, and correlations for Spain are below the diagonal.
Correlations between items of MSG-SFQ for men.
| Colombia | |||||
|---|---|---|---|---|---|
| Spain | Desire | Arousal | Orgasm | Erection | Satisfaction |
| Desire | 1 | .77** | .57** | .63** | .59** |
| Arousal | .61** | 1 | .68** | .69** | .58** |
| Orgasm | .47** | .55** | 1 | .65** | .62** |
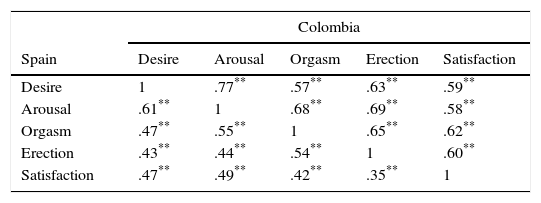
| Erection | .43** | .44** | .54** | 1 | .60** |
| Satisfaction | .47** | .49** | .42** | .35** | 1 |
Correlations for Colombia are above the diagonal, and correlations for Spain are below the diagonal.
Likewise, the percentage of participants who had some kind of dysfunction was estimated establishing a score of 2 or less as a cutoff point. Thus, 33.5% of men in Colombia had a sexual dysfunction of some kind, while in Spain 31.6% of men had a dysfunction. Forty-four point six percent of women in Colombia and 50.5% in Spain had a sexual dysfunction.
DiscussionThe first scale to evaluate sexual functioning in both Colombian men and women was validated in this study. Furthermore, it was proven that the scores are strictly invariant, thus allowing to compare sexual functioning scores for both men and women from Spain and Colombia. Consequently, the MGH-SFQ becomes the only valid and reliable instrument for evaluating sexual functioning in Colombia.
The samples obtained in this study were homologous in most socio-demographics, and those in which statistically significant differences were found are not expected to affect the results due to the low size of the effect of the differences.
The qualitative evaluation of the items was appropriate. Items which showed any problems during the initial stage of adaptation were modified following the comments of the experts (from “How would you rate your overall sexual satisfaction in the last month?, to “How would you rate your general sexual satisfaction in the last month?”) In addition, content validity was optimal, which could indicate adequate construct validity.
The quantitative evaluation of the items is also optimal. Both the Colombian and Spanish versions showed adequate corrected item-total correlations indices and Cronbach's alphas if the item is removed. The distribution of scores, with a mean of the scale slightly above its theoretical average (as would be expected in non-clinical population), and standard deviations close to 1 indicate an adequate distribution of scores. Furthermore, a scale with good reliability is shown (Nunnally & Bernstein, 1995), similar to the one obtained in previous studies (Labbate & Lare, 2001; Sierra, Santos-Iglesias, et al., 2012; Sierra, Vallejo-Medina, et al., 2012).
One of the limitations of the MGH-SFQ is the fact that its dimensionality has not been replicated; in fact, to the extent of our knowledge, only Sierra, Santos-Iglesias, et al. (2012) and Sierra, Vallejo-Medina, et al. (2012) have conducted an exploratory factor analysis. Not only was the theoretical basis of dimensionality verified through content validity, but a confirmation of the dimensionality and equivalence with the version validated in Spain was also performed in this study through factorial invariance. A level of strict invariance was obtained for both men and women with a single limit value in strong invariance. This allows not only the comparison between groups (Elosua, 2005), but to carry it out with the same level of error (Dimitrov, 2010).
External validity shows positive significant correlations between low and moderate with sexual self-esteem, sexual preoccupation, initial sexual assertiveness, general self-esteem and erotophilia. Other authors had already found some of these relations: sexual self-esteem (Brassard, Dupuy, Bergeron, & Shaver, 2015; Sanchez-Fuentes, Santos-Iglesias, & Sierra, 2014; Wentland, Herold, Desmarais, & Milhausen, 2009), initial sexual assertiveness (Santos-Iglesias & Sierra, 2010), general self-esteem (Tan, Waldman, & Bostick, 2002) and erotophilia (Nobre & Pinto-Gouveia, 2006; Ponseti & Bosinski, 2010; Sanchez-Fuentes et al., 2014; Santos-Iglesias, Sierra, & Vallejo-Medina, 2013).
Negative correlations with sexual depression and sexual refusal assertiveness were also found; the latter relation – albeit weak- was also observed in Vallejo-Medina and Sierra (2015). This result is coherent since it could be an avoidance behavior of people who have some type of sexual dysfunction, because they tend to avoid sexual contact in order not to face the difficulty they are dealing with. Sexual functioning and assertiveness STD-P do not correlate and this fact agrees with other studies’ findings as highlighted by Santos-Iglesias and Sierra (2010). Besides, correlations observed between items in this study indicate, as in other studies (Sierra, Santos-Iglesias, et al., 2012; Sierra, Vallejo-Medina, et al., 2012), the relations between the sexual functioning stages, even though they are independent.
This instrument could be used for screening because it allows to identify difficulties regarding sexual response, but it does not allow to specify particular characteristics of different dysfunctions.
This study has some limitations related to a linear interpretation of sexuality, an aspect that may not correspond to women sexual functioning which is more complex. It is also important to establish the correlation of this scale with other sexual functioning scales, as well as extending the study population including clinical sample, which would allow a better extrapolation of data. Finally, the use of an incidental sampling, conducted through a virtual evaluation, makes generalization of results impossible. Nevertheless, it is worth considering that this is a first validation of a scale to evaluate sexual functioning in Colombia. The result is a valid and reliable adaptation for evaluating Colombian women and men's sexual functioning, which also allows a cultural comparison with Spain.
Functioning Questionnaire (MGH-SFQ; Labbate & Lare, 2001) in Colombia
En la presente escala se le preguntará por algunos aspectos relacionados con el funcionamiento sexual. Por favor responda con sinceridad cada una de las preguntas, seleccionando una de las opciones disponibles
| Totalmente disminuido. | Marcadamente disminuido | Moderadamente disminuido. | Mínimamente disminuido. | Normal | |
|---|---|---|---|---|---|
| 1. ¿Cómo ha estado su interés sexual durante el último mes? | 0 | 1 | 2 | 3 | 4 |
| 2. ¿Cómo ha estado su capacidad para conseguir excitación sexual en el último mes? | 0 | 1 | 2 | 3 | 4 |
| 3. ¿Cómo ha estado su capacidad para alcanzar el orgasmo en el último mes? | 0 | 1 | 2 | 3 | 4 |
| 4. ¿Cómo ha estado su capacidad para conseguir y mantener una erección en el último mes? (solo para hombres) | 0 | 1 | 2 | 3 | 4 |
| 5. ¿Cómo calificaría su satisfacción sexual general en el último mes? | 0 | 1 | 2 | 3 | 4 |
Dimensiones de la escala:
- -
Deseo Sexual: se conceptualiza como un impulso apetitivo que es necesario para provocar los cambios físicos anteriores a la excitación sexual.
- -
Excitación Sexual: es la preparación fisiológica para el contacto sexual.
- -
Orgasmo: es una sensación de intenso placer acompañada por una alteración de la conciencia y contracción de la musculatura genitourinaria.
- -
Erección (Sólo para hombres): hace alusión a la capacidad para alcanzar y mantener una erección.
- -
Satisfacción general: es el valor subjetivo otorgado a lo placentero de la actividad sexual.
Inversión de ítems: No hay ítems invertidos para el MGH-SFQ.
Correspondencia de ítems en dimensiones:
- 1.
Deseo.
- 2.
Excitación.
- 3.
Orgasmo.
- 4.
Erección (Para hombres únicamente).
- 5.
Satisfacción general.
- -
Mujeres:
Se deben sumar los ítems 1, 2, 3 y 5, y el resultado de dicha suma debe ser divida en 4.
- -
Hombres:
Se deben sumar los ítems 1, 2, 3, 4 y 5, y el resultado de dicha suma debe ser divida en 5.
Puntuaciones iguales a 0 o inferiores a 2 en alguna subescala o en el total podría ser un indicativo de problemáticas sexuales.
This work has been possible, thanks to “Fundación Universitaria Konrad Lorenz” funding associated to the research project (number: 55270151) granted to last author.


