


The proxies used to compose cognitive reserve (CR) for patients of a first episode of psychosis (FEP) have varied in the literature. The development of FEP is linked to peripheral pathways of the central nervous system, yet despite this knowledge, no research has considered the introduction of biomarkers as proxies for CR. Meanwhile, schizophrenia has been linked to the metabolic system, indicating that alterations in the levels of biological parameters, in particular high-density lipoproteins (HDL), cause worse global functioning and cognitive impairment. For these reasons, the present study aimed to create a quantifiable and objective CR index that adjusts for the multifactorial nature of FEP.
Materials and methodsWe included 668 FEP patients and 217 healthy controls. Participants were assessed for sociodemographic information, years of education, employment status, premorbid IQ and biological parameters: waist circumference, hypertension, and levels of HDL, triglycerides, and glucose.
ResultsThe findings suggest that the years of education proxy showed correlational and higher relationship with HDL levels for both FEP patients (r=0.23, b=0.185) and controls (r=0.31, b=0.342). We found that the CR index composed of years of education and HDL levels showed a higher explanatory power for the phenomenon than the classic CR index composed of years of education, employment status and premorbid IQ.
ConclusionsThis article proposes an objective and quantifiable method to measure CR that is more the multifactorial nature of FEP.
Cognitive reserve (CR) is defined as a buffer against neuropathologies made possible through individual differences in neural networks that maintain efficient cognitive performance1 and thus actively compensate for the effects of a given disease.2 Previous research has shown that CR is a predictor of functionality and clinical and cognitive symptomatology.3–6 Thus, the higher the CR, the better the patient's performance in these areas, with CR functioning as a protective factor in patients with severe mental illness.7,8 CR is commonly estimated through the use of proxies and indices. One of the most common compositions of CR is composed of the proxies: years of education, premorbid IQ and employment status.6,9 Premorbid IQ proxy is related to patients’ functional outcomes10 and cognitive performance both at baseline and after disease onset,11 as well as to the levels of certain biomarkers12 Meanwhile, years of education and employment status are related to intellectual and environmental factors at different stages of life: years of education in early life, and employment status in middle and late life.13
Research focused on CR in Alzheimer's disease (AD) clarifies the importance of the proxy years of education, such that patients presenting with a higher level of education tended to have a lower incidence of developing the disease.14 Two explanations would justify this phenomenon. It is possible that highly educated patients have higher cognitive performance that would in turn require advanced pathology to be observed at clinical levels of symptomatology. It is possible as well that education stimulates neuroplasticity, providing resistance to adverse effects on brain function.15 Furthermore, previous heritability studies found that the genetic architecture of dementia was related to education,16,17 suggesting a causal effect on AD.18 However, neurological and psychiatric disorders are complex, polygenic and multifactorial. For this reason, endogenous and exogenous factors should be taken into account for the composition of CR. A recent line of research in the area of AD has recently developed to address this complexity. For instance, studies have integrated extra proxies into the measure of CR, such as the tau protein,13 the Aβ burden13 and the P300 latency.19
A previous study has described the influence of peripheral pathways in schizophrenia.20 This influence causes a link between schizophrenia and the metabolism. One reason for this link is that the probability of neuronal recruitment in the brain is related to the bioenergetic efficiency of neurons and astrocytes. There is thus a link between somatic metabolism and neurological deterioration, a relationship that is affected by external factors such as exercise and diet.21 Initial research reported that biomarkers of high-density lipoprotein (HDL), triglycerides, and fasting plasma glucose (FPG) were predictive of global cognitive impairment in schizophrenia.22 Subsequently, it was clarified that cognition was predicted by total cholesterol and glucose together with the proxy years of education.23 Recently, a study has been published reporting that the prediction model for social functioning in schizophrenia was formed by HDL, triglycerides and FPG, while the biomarker systolic blood pressure (SBP) needed to be added to the model to predict cognitive impairment.24 To date, many studies have highlighted the importance of HDL levels in schizophrenia, indicating a relationship between low HDL levels and poorer global functioning, global cognition,25–27 poor social relationships,28 as well as increased suicidal behaviour.29 On the other hand, although it has been reported that HDL levels tends to remain stable during the first three years of the disease,30 any changes in these lipids could produce changes in brain structure and inhibition of synaptogenesis, and consequently neurodegenerative changes.31 This is because cholesterol plays an important role in the brain due to its involvement in myelination, synaptic growth and regeneration,31 and it has been shown that high levels of HDL may act as a protective factor against hippocampal atrophy.32
To the best of our knowledge, no previous study has assessed the relationship between biological parameters and CR proxies in first-episode psychosis (FEP). This lack of knowledge justifies the present study, which focused on the search for neurobiological proxies of CR.
Based on the scientific evidence, we hypothesised that HDL levels are related to CR proxies and specifically, that HDL levels could be an extra proxy for CR in patients with FEP. The aim of this study was to construct an index of CR that is objective, quantifiable and multifactorial.
Materials and methodsParticipantsThe sample of the present study were individuals with a FEP of non-affective psychosis treated in a longitudinal and epidemiological programme called Programa de Atención a Fases Iniciales de Psicosis (PAFIP), carried out at the Marqués de Valdecilla University Hospital (Santander, Spain). Further details of the description of PAFIP have been described in previous papers.33,34
The patient group consisted of 668 participants with a first episode of non-affective psychosis recruited from February 2001 to January 2017. Participation in PAFIP was voluntary, and they were free to withdraw from the programme at any time. Participants were informed about the study and signed the informed consent form, which complied with international standards for research ethics and was approved by the local review board institution. The inclusion criteria for all participants were as follows: (1) were between the ages of 15 and 50 at the time of inclusion in the PAFIP programme; (2) maintained habitual residence in Cantabria, the area where the programme is carried out; (3) presented a first episode of non-affective psychosis, defined as those subjects with non-affective psychotic symptomatology, regardless of the time of evolution of their psychotic symptoms, who contact for the first time a specialised mental health team; (4) had no prior treatment with antipsychotic medication or, if previously treated, a total lifetime of antipsychotic treatment of <6 weeks. That is, only individuals are included drug-naïve; and (5) followed the criteria set out in DSM-IV for schizophrenia spectrum disorders: schizophrenia, schizophreniform disorder, schizoaffective disorder, brief psychotic disorder, and other psychotic disorders not otherwise specified, excluding these types of psychotic disorder.35 Participants were excluded for any of the following reasons: (1) met the criteria for drug dependence of DSM-IV; (2) met the criteria for mental retardation (IQ below 70) of DSM-IV; or (3) had a history of neurological disease or head injury. The Structured Clinical Interview for DSM-IV (SCID-I)36 was used to confirm the diagnoses, realised by an experienced psychiatrist within six months from the baseline visit.
The control group consisted of 217 healthy volunteers recruited from the community through advertisements. Of the control group the inclusion criteria were as follows: (1) over 15 years of age, (2) good domain of the Spanish language, and (3) ability to give informed consent in writing. Exclusion criteria included an absence of history of psychiatric diagnoses related to psychotic illness spectrum, absence of organic brain pathology, and an absence of intellectual disability or substance use disorders according to DSM-V criteria.
Sociodemographic variablesTo collect the sociodemographic information, we interviewed the patients and their relatives. The measures collected were sex, age, age at psychosis onset (defined as the age when the emergence of the first continuous psychotic symptom occurred), area of residence (“urban” vs. “rural”), relationship status (“single” vs. “other”), socioeconomic status (SES) derived from their parent's occupation (“low qualification worker” vs. “other”), first-degree family history of psychosis, cohabitation with parents or family (“yes” or “no”) and the mean chlorpromazine equivalent dose.
Proxies of cognitive reserveProxies for CR vary throughout the literature. In this research, we used the proxies premorbid IQ, education and occupation, as in previous research by González-Ortega et al.6 and our own group.9
As in previous studies,2–6,9,35 premorbid IQ was evaluated using the vocabulary subtest of the WAIS-III37 as a measure of crystallised intelligence.
The proxy education was collected through the participants’ years of education classified according to the Spanish education system. Meanwhile, the proxy occupation, in this case a dichotomous measure (unemployment: “yes” or “no”), was obtained through information on the employment situation of the participants.
Assessment of biological disturbancesThe biological parameters selected for this research are those used for the pre-established criteria for the diagnosis of metabolic syndrome: abdominal obesity, cholesterol, triglycerides, hypertension, and hyperglycemia.38 We selected these biological parameters based on two recent meta-analyses that reported how the presence of these parameters was related to greater global cognitive impairment in patients with schizophrenia.39,40
The physical examination included: abdominal obesity (waist circumference: >102cm in men or >88cm in women) and hypertension (systolic blood pressure (SBP) ≥130mmHg). While laboratory investigations included: hyperglycemia (fasting plasma glucose (FPG) ≥110mg/dl), triglycerides levels (≥150mg/dl) and blood HDL cholesterol (<40mg/dl in men and <50mg/dl in women). These evaluations were carried out according to the following NCEP criteria.41
Data analysesStatistical analyses were performed with the Statistical Package for Social Science version 23.0.42 The first step was to compare patients and HC in terms of sociodemographic data, CR proxies and biological parameters. Qualitative dichotomous variables were performed using chi-square and quantitative variables using univariate analysis of variance (ANOVA).
We then performed Pearson correlations to explore whether there was a relationship between CR proxies and biological parameters.
Subsequently, through multiple regression analysis, we searched for the causes of the relationships between CR and biological parameters at baseline. The dependent variables included in the model were waist circumference, levels of HDL, triglycerides, fasting plasma glucose, and systolic blood pressure. Backward stepwise model selection was used to determine the final model. This entailed the first model containing all predictors, while subsequent models were constructed through elimination of individual predictors based on the F-statistic criterion.
Finally, in line with the methodology used in recent years in CR research, principal component analysis (PCA) and exploratory factor analysis (EFA) were carried out to create a “composite CR score”4 for each participant, referred to as biological CR. In both, HC and patients, the reliability, validity and consistency of the creation of the new CR were explored.43–45 Bartlett's test of specificity was performed to test the correlations between the proxies. Secondly, the Kaiser-Meyer-Olkin measure (KMO) was performed as a test of sampling adequacy and Cronbach's alpha test was used to measure internal consistency. Finally, the final percentages of variance was used to verify that our biological CR explained more than 50% of the phenomenon and that, in addition, the components of biological CR contributed more than 0.30 to the composite CR score.
All statistical tests, which were two-tailed with significance at p=0.05, were performed with independent Z-scores between patients and HC.
ResultsSociodemographic characteristics of the sampleThe total sample consisted of 668 FEP patients and 217 HC. There were no differences between patients and HC in terms of sex, area of residence, socioeconomic status of their parents and if they were living with their parents. However, as shown in Table 1, we found significant differences in relationship status (p<0.001), age (p=0.015), and cohabitation with family (couple and/or parents) (p=0.001), such that patients were more frequently single, older, and more likely to cohabit with their family.
Comparisons between FEP patients and healthy controls on sociodemographic data, CR proxies and levels of biological parameters.
| FEP patients | Healthy controls | Value | p | Post hoc | |||
|---|---|---|---|---|---|---|---|
| N | Mean (SD) | N | Mean (SD) | ||||
| Sex (male): N (%) | 668 | 374 (56.00) | 217 | 132 (60.80) | x2=1.57 | 0.210 | |
| Age | 668 | 30.85 (9.96) | 208 | 29.03 (7.54) | F=5.89 | 0.015 | HC |
| Urban area: N (%) | 667 | 482 (72.30) | 87 | 62 (71.30) | x2=0.38 | 0.845 | |
| Single: N (%) | 661 | 480 (72.60) | 161 | 66 (41.00) | x2=58.05 | <0.001 | HC |
| SES of parents (low): N (%) | 651 | 358 (55.00) | 201 | 123 (61.20) | x2=2.40 | 0.121 | |
| Living with parents: N (%) | 659 | 344 (52.20) | 86 | 43 (50.00) | x2=0.15 | 0.701 | |
| Living with family: N (%) | 659 | 482 (73.10) | 86 | 77 (89.50) | x2=10.91 | 0.001 | HC |
| Age at psychosis onset | 653 | 29.70 (9.67) | NA | NA | |||
| DUP | 653 | 13.66 (32.93) | NA | NA | |||
| Family psychiatric history: N (%) | 663 | 165 (24.90) | NA | NA | |||
| Chlorpromazine equivalent | 665 | 206.10 (79.88) | NA | NA | |||
| Cognitive reserve | |||||||
| Education years | 661 | 10.11 (3.28) | 216 | 10.77 (2.72) | F=7.31 | 0.007 | HC>FEP |
| Premorbid IQ | 449 | 95.98 (13.56) | 201 | 99.03 (10.78) | F=7.92 | 0.005 | HC>FEP |
| Unemployed: N (%) | 658 | 283 (43.00) | 161 | 37 (23.00) | x2=21.80 | <0.001 | HC |
| Biological parameters | |||||||
| Waist circumference | 397 | 83.24 (11.63) | 158 | 86.99 (12.79) | F=11.08 | 0.001 | HC>FEP |
| HDL | 575 | 52.33 (14.84) | 153 | 56.42 (15.57) | F=8.97 | 0.003 | HC>FEP |
| Triglycerides | 580 | 83.89 (41.90) | 153 | 93.10 (52.43) | F=5.23 | 0.022 | HC>FEP |
| SBP | 526 | 118.46 (15.16) | 152 | 107.05 (12.21) | F=72.57 | <0.001 | HC |
| FPG | 656 | 86.04 (14.89) | 153 | 84.45 (8.97) | F=1.61 | 0.205 | |
Abbreviations: NA: not applicable; HC: healthy controls; FEP: FEP patients; DUP: duration of untreated psychosis; IQ: intelligence quotients; HDL: high density lipoprotein; SBP: systolic blood pressure; FPG: fasting plasma glucose.
Table 1 provides the comparisons between participants in terms of proxies of CR and biological parameters.
Proxies of CRAll CR proxies showed significant differences between patients and HC. The patients presented higher unemployment rates (p=<0.001), lower premorbid IQ (p=0.005) and fewer years of education (p=0.007) than the HC.
Biological parametersThe results showed significant differences in all but hyperglycemia. On the one hand, we found that patients had more dysregulated levels of HDL (p=0.003) and SBP (p<0.001) than HC. On the other hand, HC had higher waist circumference (p=0.001) and triglycerides levels (p=0.022) than the patients.
Relationships between CR proxies and HDL and SBP levelsWe explored the correlations between CR and the biological parameters in both groups, as you can see in Fig. 1. As shown in the figures, the patient group only showed significant relationships in HDL and SBP levels.

The first figure shows the correlations between the classic CR (proxies: premorbid IQ, years of education and unemployment) and HDL and SBP levels, both separately and together. For patients, the highest correlation was between classic CR and the composite of HDL and SBP levels (r=0.23; p<0.001), while for HC the strongest correlation was between CR and HDL (r=0.31; p<0.001).
In the next figure we observed that the strongest correlations in both groups were between the proxies premorbid IQ and years of education. In terms of the relationships involving HDL and SBP levels, the strongest correlation for patients was found with the composite of premorbid IQ and years of education (r=0.22; p<0.001), whereas the strongest correlation for the HC group was with years of education (r=0.33; p<0.001).
The last figure shows that the strongest correlation for patients was between HDL and the composite of years of education and unemployment (r=0.21; p<0.001). Meanwhile for HC, the strongest correlation was between years of education with HDL (r=0.34; p<0.001).
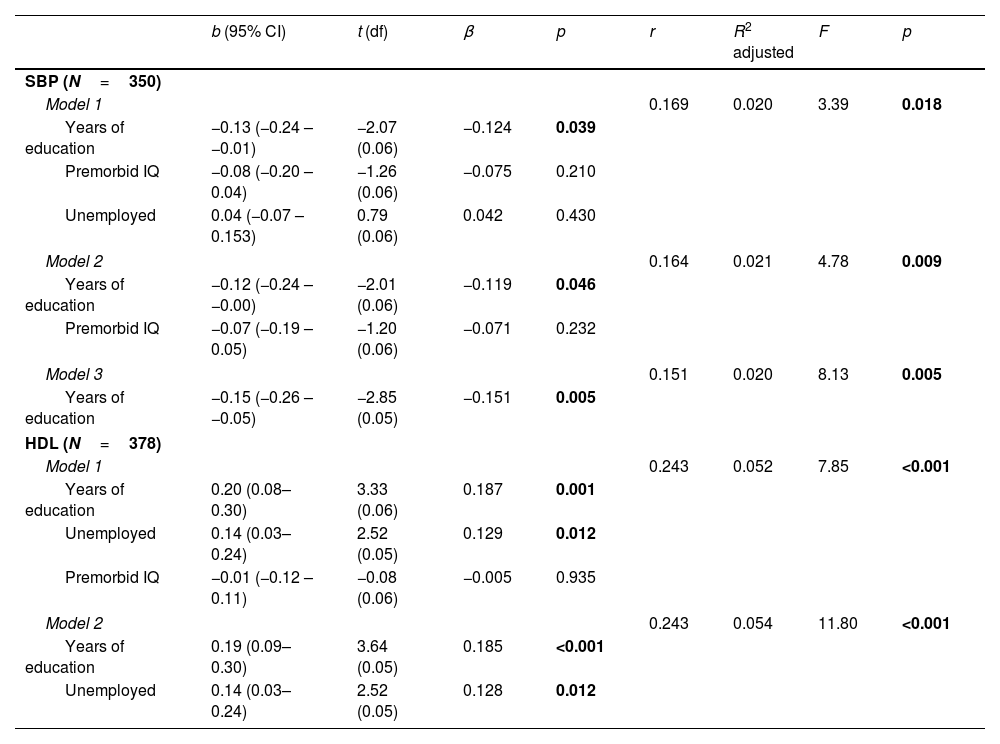
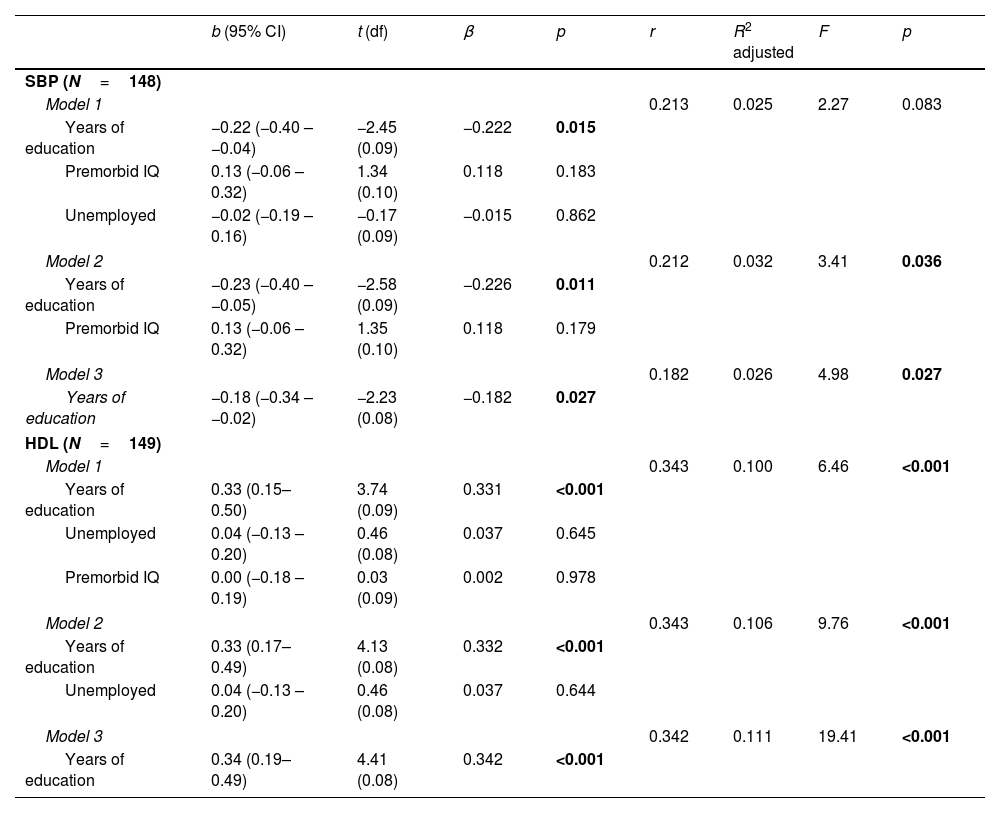
Predictive value of CR proxies on biological parametersFollowing the line of the previous results, we performed multiple regression analyses to explore the predictive capacity of CR proxies with HDL and SBP levels as dependent variables among patients (see Table 2) and HC (see Table 3).
Linear regression models pertaining to FEP patients with SBP and HDL levels as dependent variables.
| b (95% CI) | t (df) | β | p | r | R2 adjusted | F | p | |
|---|---|---|---|---|---|---|---|---|
| SBP (N=350) | ||||||||
| Model 1 | 0.169 | 0.020 | 3.39 | 0.018 | ||||
| Years of education | −0.13 (−0.24 – −0.01) | −2.07 (0.06) | −0.124 | 0.039 | ||||
| Premorbid IQ | −0.08 (−0.20 – 0.04) | −1.26 (0.06) | −0.075 | 0.210 | ||||
| Unemployed | 0.04 (−0.07 – 0.153) | 0.79 (0.06) | 0.042 | 0.430 | ||||
| Model 2 | 0.164 | 0.021 | 4.78 | 0.009 | ||||
| Years of education | −0.12 (−0.24 – −0.00) | −2.01 (0.06) | −0.119 | 0.046 | ||||
| Premorbid IQ | −0.07 (−0.19 – 0.05) | −1.20 (0.06) | −0.071 | 0.232 | ||||
| Model 3 | 0.151 | 0.020 | 8.13 | 0.005 | ||||
| Years of education | −0.15 (−0.26 – −0.05) | −2.85 (0.05) | −0.151 | 0.005 | ||||
| HDL (N=378) | ||||||||
| Model 1 | 0.243 | 0.052 | 7.85 | <0.001 | ||||
| Years of education | 0.20 (0.08–0.30) | 3.33 (0.06) | 0.187 | 0.001 | ||||
| Unemployed | 0.14 (0.03–0.24) | 2.52 (0.05) | 0.129 | 0.012 | ||||
| Premorbid IQ | −0.01 (−0.12 – 0.11) | −0.08 (0.06) | −0.005 | 0.935 | ||||
| Model 2 | 0.243 | 0.054 | 11.80 | <0.001 | ||||
| Years of education | 0.19 (0.09–0.30) | 3.64 (0.05) | 0.185 | <0.001 | ||||
| Unemployed | 0.14 (0.03–0.24) | 2.52 (0.05) | 0.128 | 0.012 | ||||
Abbreviations: IQ: intelligence quotients; HDL: high density lipoprotein; SBP: systolic blood pressure.
Bold values: group differences with Bonferroni post hoc with significance p < 0.05.
Linear regression models pertaining to HC with SBP and HDL levels as the dependent variables.
| b (95% CI) | t (df) | β | p | r | R2 adjusted | F | p | |
|---|---|---|---|---|---|---|---|---|
| SBP (N=148) | ||||||||
| Model 1 | 0.213 | 0.025 | 2.27 | 0.083 | ||||
| Years of education | −0.22 (−0.40 – −0.04) | −2.45 (0.09) | −0.222 | 0.015 | ||||
| Premorbid IQ | 0.13 (−0.06 – 0.32) | 1.34 (0.10) | 0.118 | 0.183 | ||||
| Unemployed | −0.02 (−0.19 – 0.16) | −0.17 (0.09) | −0.015 | 0.862 | ||||
| Model 2 | 0.212 | 0.032 | 3.41 | 0.036 | ||||
| Years of education | −0.23 (−0.40 – −0.05) | −2.58 (0.09) | −0.226 | 0.011 | ||||
| Premorbid IQ | 0.13 (−0.06 – 0.32) | 1.35 (0.10) | 0.118 | 0.179 | ||||
| Model 3 | 0.182 | 0.026 | 4.98 | 0.027 | ||||
| Years of education | −0.18 (−0.34 – −0.02) | −2.23 (0.08) | −0.182 | 0.027 | ||||
| HDL (N=149) | ||||||||
| Model 1 | 0.343 | 0.100 | 6.46 | <0.001 | ||||
| Years of education | 0.33 (0.15–0.50) | 3.74 (0.09) | 0.331 | <0.001 | ||||
| Unemployed | 0.04 (−0.13 – 0.20) | 0.46 (0.08) | 0.037 | 0.645 | ||||
| Premorbid IQ | 0.00 (−0.18 – 0.19) | 0.03 (0.09) | 0.002 | 0.978 | ||||
| Model 2 | 0.343 | 0.106 | 9.76 | <0.001 | ||||
| Years of education | 0.33 (0.17–0.49) | 4.13 (0.08) | 0.332 | <0.001 | ||||
| Unemployed | 0.04 (−0.13 – 0.20) | 0.46 (0.08) | 0.037 | 0.644 | ||||
| Model 3 | 0.342 | 0.111 | 19.41 | <0.001 | ||||
| Years of education | 0.34 (0.19–0.49) | 4.41 (0.08) | 0.342 | <0.001 | ||||
Abbreviations: IQ: intelligence quotients; HDL: high density lipoprotein; SBP: systolic blood pressure.
Bold values: group differences with Bonferroni post hoc with significance p < 0.05.
As shown in Table 2, the three resulting models for SBP levels were significant (p<0.05), as were the two models for HDL levels (p<0.001). Of the five resulting models, we observed that there was greater predictive value for HDL levels, with Model 2 being the most significant (F=11.80; p<0.001). Model 2, formed by the proxies years of education and unemployment, had a higher predictive power, explaining 5.4% of HDL levels. Meanwhile, the two proxies were statistically significant (years of education: p<0.001; unemployment: p=0.012), with years of education having a higher relationship (β=0.185) than unemployment (β=0.128).
Healthy controlsAs you can see in Table 3, three models were significant (p<0.05) with SBP as the dependent variable, while all three HDL models were significant (p<0.001). As with the patient group, of the five significant models in the HCs, Model 3 on the dependent variable HDL was the most prominent. Model 3 showed the highest predictive power with 11.6% of explanation of HDL levels. We see that this model was composed of years of education proxy with a relationship of β=0.342.
The results on waist circumference and levels of triglycerides and hyperglycemia in the HC group can be found in supplementary Table S1.
Biological cognitive reserveThe next step in the analyses was to carry out PCA and EFA with the most significant variables obtained in the regression models. After several attempts combining all possible components, exploratory analyses showed that the most optimal variables for the composite CR score were years of education and HDL levels.
The two CR models in both groups obtained adequate levels of KMO (KMO>0.05) and significance in Bartlett's test of specificity (p<0.001) (see online supplementary Table S2). The results reported that neither the classic CR nor our biological CR reached the established Cronbach's alpha levels for either patients or HC (p<0.70) (see online supplementary Table S2).
As shown in Table 4, results of total variance explained indicated that biological CR would have a greater explanatory power for the phenomenon than classic CR for both groups of participants. Among the group of patients, classic CR explained 51.79% of the variance, while biological CR explained 59.06%. This percentage increase also occurred in the control group, where classic CR explained 51.04%, while biological CR increased to 67.12%.
Total variance explained by comparing classic and biological CR in patients and controls.
| Initial eigenvalues | Extraction sums of squared loadings | |||||
|---|---|---|---|---|---|---|
| Total | % of variance | Cumulative % | Total | % of variance | Cumulative % | |
| Patients | ||||||
| Components of classic CR | ||||||
| 1 | 1.56 | 51.79 | 51.79 | 1.56 | 51.79 | 51.79 |
| 2 | 0.91 | 30.22 | 82.02 | |||
| 3 | 0.54 | 17.98 | 100.00 | |||
| Components of the biological CR | ||||||
| 1 | 1.17 | 59.06 | 59.06 | 1.17 | 59.06 | 59.06 |
| 2 | 0.81 | 40.94 | 100.00 | |||
| Controls | ||||||
| Components of classic CR | ||||||
| 1 | 1.45 | 51.04 | 51.04 | 1.45 | 51.04 | 51.04 |
| 2 | 0.86 | 30.15 | 81.19 | |||
| 3 | 0.53 | 18.81 | 100.00 | |||
| Components of the biological CR | ||||||
| 1 | 1.37 | 67.12 | 67.12 | 1.37 | 67.12 | 67.12 |
| 2 | 0.67 | 32.88 | 100.00 | |||
The results show that for both groups of participants the unemployment proxy in the classic CR had a degree of extraction lower than 0.30. These low values mean that this proxy did not provide sufficient information to be part of the classic CR. In contrast, the years of education proxy provided the largest information to the classic CR (>0.70), while providing a balanced contribution to the biological CR with its counterpart HDL, for both patients and HC (see online supplementary Table S3).
DiscussionThe main objective of the present study was to explore an objective and quantifiable CR, taking into account endogenous and exogenous factors. Following this line of work, it is interesting to note that, for both groups of participants, the results found that the proposed biological CR has a greater explanatory value of the phenomenon than the classic CR commonly found in the literature. Therefore, we can affirm that introducing HDL levels, as a biological proxy, together with the years of education proxy, is a way of obtaining a CR adjusted to the multifactorial nature of psychosis. Furthermore, it was found that in the classic CR the proxy unemployment did not provide the necessary information load to be taken into account in the total index.
Our research has found that years of education is the variable that best predicts HDL levels. These results are supported by previous studies suggesting that years of education in combination with HDL are necessary to form predictive models of cognitive impairment in schizophrenia.22–24 The fact that years of education is an indispensable proxy may be due to the fact that it often has an early onset, which makes it more important to take into account lived experiences and cognitive enrichment at an early age.46 Another reason why the need for this proxy might be justified is that education stimulates neuroplasticity before the development of the disease, which would promote cognitive protection against the adverse effects of psychosis.15
Furthermore, the need to include HDL levels is supported by previous arguments reporting its relationship with cognitive performance and patient functionality,25,28 independently of the effect of practice, lifestyle, improvements in clinical symptomatology or levels of other biological parameters.32 The introduction of HDL levels in CR implies taking into account biochemical processes that have not been considered until now, since, at the brain level, HDL is located in the hippocampus and is related to the performance of cognitive domains.32,47–49 If we know that an imbalance in HDL levels causes hippocampal atrophy32 with consequent cognitive impairment and increased neurodegenerative speed,31 it is conceivable that it also affects the alternative neural networks referred to in the definition of CR.1 Ultimately, these problems could explain the patients’ inabilities to cope with the onset of their first episode of psychosis and subsequent cognitive declines. This fact supports the claim that CR is a protective factor for the development of severe mental illness, as suggested by previous research.7,8
The combination of years of education and HDL levels seems to have an important implication for CR. On the one hand, if a patient has low cognitive enrichment due to a low level of education, this influences the patient's understanding, learning and reasoning about their health and achieving problem-solving skills to prevent alterations in their biological parameters and future chronic diseases.50 Moreover, if a patient has low HDL levels, it will start an inhibition of synaptogenesis and lead to neurodegenerative changes31 that in turn lead to worse cognitive functioning, making it difficult for the patient to increase their years of education. Therefore, as we can see, the relationship between these two proxies appears to be reciprocal.
Another notable finding of our research is that the proxies premorbid IQ and employment status (unemployment) were discarded. One possible explanation is that years of education and HDL levels can be considered secondary. The results indicated a strong relationship between premorbid IQ and years of education, which leads us to believe that, if a patient has a low educational level, his or her cognitive enrichment will be poor and therefore will not reach a high premorbid IQ. Thus, we come to the possible conclusion that years of education is a predictor of the patient's crystallised intelligence, making the premorbid IQ proxy redundant in the CR composite score. On the other hand, having low HDL levels is related to poorer performance in the domains of verbal learning and memory.47–49 These domains represent the receiving, processing and storing of long-term knowledge, suggesting that low HDL affects the development of crystallised intelligence and, as a result, premorbid IQ. Secondly, if functionality is impaired, as predicted by low HDL levels, it will be more difficult for the patient to find a job, which helps to explain the relationship between HDL and employment.
This paper cannot end without mentioning some limitations and strengths. One of the main limitations lies in not being able to explore the relationship with CR in other inflammatory or neuroimmune biomarkers such as interleukin receptor SHC signalling, hematopoietic cell lineage, interleukin-1/2 family signalling51 and activation of HERV-W.20 We also did not take into account the hormone levels of the participants and especially of the patients. Previous research has shown how antipsychotic medication influences hormone production and how hormones mediate HDL production.52 Another possible limitation lies in the collection of blood tests, as they were not performed on all participants. We also consider it a limitation that due to the lack of uniform information for occupation, it was used as a dichotomous variable (unemployed vs. active). As a final limitation, we can mention that we have not taken into account other factors that could potentially interfere with the results, such as habitual physical exercise, diet, substance use and type of antipsychotic. However, our study has several strengths consisting in the size and homogeneity of the samples, which allows us to consider our results for future CR research. To our knowledge, this is the first study to explore the relationships and predictions between CR proxies with biomarkers, as well as to explore their use as an additional proxy. The gap in the literature justified the present study's focus on the search for neurobiological CR proxies, as patients with FEP tend to have unhealthy lifestyle habits that alter their metabolisms53,54 and thus their CR. Future research is needed to expand the use of biological CR based on years of education and HDL levels.
In conclusion, this study proposes a new composition of CR with exogenous and endogenous factors, consisting of the proxies years of education and HDL levels. We showed that, in patients and HC, the strongest correlations were between years of education and HDL levels. In fact, years of education outperformed the other variables in terms of predicting HDL levels. A notable observation was that our proposed biological CR had a higher percentage of explanation of the phenomenon with only two proxies compared to the classic CR consisting of three proxies. In addition, its two proxies contributed information in a balanced way to the CR composite score. These findings allowed us to develop a quantifiable, objective and multifactorial CR. The possible impact of the biological CR is that is provides a more precise composition taking into account biomarkers through a question and a blood test, or, desirably, through non-invasive measures yet to be developed. These insights will allow for the selection and establishment of the most appropriate treatments for each FEP patient.
Authors’ contributionsAll the authors have participated and have made substantial contributions to this paper.
RMH: conception, design, statistical analysis, interpretations of data and drafting the article.
NMG, AYR, BCF: interpretations of data and revising the article.
KN: editing.
RAA: conception, design, interpretations of data and revising the article.
FundingThe PAFIP project carried out on Marqués de Valdecilla Research Institute was supported by the Carlos III Health Institute (PI14/00639 and PI14/00918). In addition, this work was financed by a Miguel Servet from the Carlos III Health Institute contract (Dra. Rosa Ayesa-Arriola) (CP18/00003), and a predoctoral contract (Rebeca Magdaleno Herrero) (PREVAL22/03) from the Valdecilla Biomedical Research Institute and the University of Cantabria. No pharmaceutical company has financially supported the study.
Conflict of interestThe authors have no conflict of interest to declare.
The authors wish to thank all “Programa de Atención a Fases Iniciales de Psicosis” (PAFIP) research team, and especially to all patients and family members who participated in the study.
The following are the supplementary data to this article: