The Self-Appraisal Questionnaire (SAQ) is a self-report that predicts the risk of violence and recidivism and provides relevant information about treatment needs for incarcerated populations. The objective of the present study was to evaluate the concurrent and predictive validity of this self-report in Spanish offenders. The SAQ was administered to 276 offenders recruited from several prisons in Madrid (Spain). SAQ total scores presented high levels of internal consistency (alpha=.92). Correlations of the instrument with violence risk instruments were statistically significant and showed a moderate magnitude, indicating a reasonable degree of concurrent validity. The ROC analysis carried out on the SAQ total score revealed an AUC of .80, showing acceptable accuracy discriminating between violent and nonviolent recidivist groups. It is concluded that the SAQ total score is a reliable and valid measure to estimate violence and recidivism risk in Spanish offenders.
El cuestionario Self-Appraisal Questionnaire (SAQ) [cuestionario de autovaloración] es una medida de auto-informe que predice el riesgo de violencia y reincidencia, además de permitir evaluar las necesidades de tratamiento para poblaciones penitenciarias. El objetivo de este estudio fue evaluar su validez concurrente y predictiva en una muestra española de delincuentes. El cuestionario fue administrado a 276 delincuentes procedentes de varios centros penitenciarios de Madrid (España). El coeficiente alfa de Cronbach que se obtuvo para la puntuación total del SAQ fue elevado (alfa=.92). Las correlaciones obtenidas con otros instrumentos de riesgo de violencia fueron estadísticamente significativas y presentaron una magnitud moderada, indicando un razonable grado de validez concurrente del instrumento. El análisis de la curva ROC reveló un área bajo la curva de .80, mostrando una aceptable capacidad de precisión a la hora de discriminar entre grupos de reincidentes violentos y no violentos. Se concluye que la puntuación total del SAQ proporciona una medida suficientemente fiable y válida para estimar violencia y riesgo de reincidencia en población de delincuentes españoles.
The prediction of violent behavior is an important public safety aim for forensic and correction personnel, as they make decisions regarding release from prison (Kubiak, Kim, Bybee, & Eshelman, 2014). Offender risk assessment instruments are used by these professionals as a tool to assist in the prediction of recidivism and violent behavior. These instruments are based on advances in identifying factors that are facilitators of violence risk (Andrews & Bonta, 2010; Douglas, Skeem, & Nicholson, 2011; Shepherd, Adams, McEntyre, & Walker, 2014; Wakeling, Freemantle, Beech, & Elliott, 2011; Yang, Wong, & Coid, 2010).
Given the necessity for a permanent assessment to identify whether the individual poses a risk to society and, if so, the nature of this risk, the instruments used for this purpose must be reliable, with good predictive utility (Loza, Dhaliwhal, Kroner, & Loza-Fanous, 2000). On the one hand, the use of standardized tools has been instigated and continues to thrive because many studies have demonstrated that clinicians’ judgments alone led to many erroneous decisions and unacceptably high false positives (Loza, 2005). On the other hand, the use of standardized tools improves the predictive accuracy of recidivism, violent behavior, sexual offense, and gender violence (Kroner & Yessine, 2013; Loza & Green, 2003; Loza & Loza-Fanous, 2000; Pérez, Martínez, & Redondo, 2009).
According to Kubiak et al. (2014), violence risk assessment has changed over the past 50 years from relying on clinical judgments of risk (first generation risk assessments) to the latest instruments that integrate different dimensions of risk management, selection of intervention, and assessment of change during the rehabilitation process (fourth generation risk assessments). Whereas the first generation of risk instruments only assessed static factors (e.g., factors unlikely to change, such as past criminal history), the more recently developed third/fourth generation tools incorporate dynamic factors (e.g., factors that can be changed) and are able to assess treatment needs (Andrade, O’ Neill, & Diener, 2009; Gómez-Hermoso, 2009; Smith, Cullen, & Latessa, 2009). Morash (2009) summarized the different purposes of violence risk assessment instruments: a) prediction of prison misconduct, b) identifying the treatment needs of offenders, c) providing interventions to address those needs, d) identifying the needs that are most predictive of behavior problems and recidivism, e) identifying those individuals with high level of recidivism, and f) developing plans of intervention that will address these needs.
A recent meta-analysis of the outcomes attributable to various instruments and methods used to predict violence highlights a self-report risk instrument, the Self-Appraisal Questionnaire (SAQ; Loza, 2005). The SAQ measures the predominant, predictive aspects (dynamic and static factors) found in the literature and allows us to assess violence risk and recidivism in forensic and prison populations. The SAQ is a risk/need inventory designed to assist clinicians, forensic, and correctional professionals to predict violence risk but it can also be used as a measurement of pre- and post-treatment, an evaluation of offenders’ evolution, a support instrument for assignment and changes in penitentiary grades, and even determining penitentiary permissions (Loza, 2005; Loza & Loza-Fanous, 2001, 2003; Prinsloo & Hesselink, 2011).
Loza (2005) maintains that this inventory has several important advantages over other violence risk measures: a) the SAQ can be completed approximately in only 20minutes, b) the SAQ can be administered in groups, and c) interpreting the results requires minimal professional time, minimal training, and no special certification to obtain credible and reliable results. Despite that the use of self-report questionnaires can be vulnerable to self-presentation biases in forensic settings, different studies have also found evidence that self-report questionnaires can be as reliable and valid as observer rating instruments for violence risk assessment (Loza et al., 2004; Mills, Loza, & Kroner, 2003; Prinsloo, 2013).
From these considerations about the SAQ for predicting violence risk, the purpose of this study was to analyze the concurrent and predictive validity of this self-report measure in a sample of Spanish offenders. The psychometric evaluation was performed by determining the concurrent validity with other violence risk measures and examining the validity of the SAQ for predicting violent and nonviolent recidivism.
MethodEthics StatementThe present study was reviewed and approved by the Committee of the Faculty of Psychology of the Complutense University of Madrid. Written informed consent was obtained from all participants. All participants were informed of the purpose of the research, the estimated duration of the assessment, and the procedures that were followed for the completion of the research.
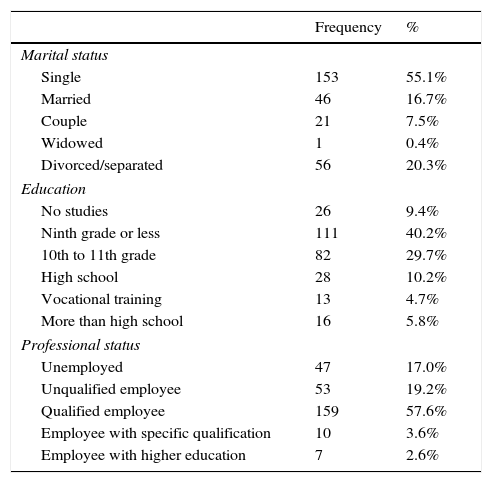
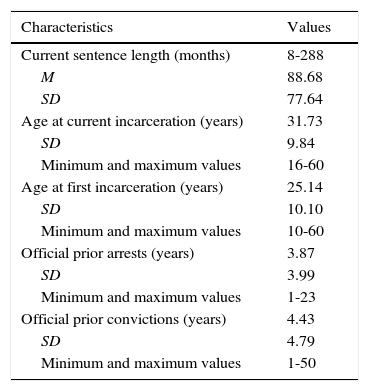
ParticipantsTwo-hundred and seventy-six male offenders who were incarcerated in different prisons in the Community of Madrid (Spain) participated at the present study. The average age of the participants was 36.4 years (SD=9.7, ranging from 19 to 66 years). Of them, 91.3% were Spanish, and 8.7% were of other nationalities. Table 1 displays the demographic characteristics of the offenders. Current sentence length ranged from 8 to 288 months (M=7.39 years, SD=6.47). Seventy-five percent of the participants presented violent offenses (i.e., an offense against a person such as murder, rape, and assault), and the nonviolent offenders were convicted of nonviolent crimes such as property offenses (i.e., robbery without violence, breaking and entering, and theft). See Table 2 for criminal characteristics of the offenders.
Sample Sociodemographic Characteristics (N=276).
| Frequency | % | |
|---|---|---|
| Marital status | ||
| Single | 153 | 55.1% |
| Married | 46 | 16.7% |
| Couple | 21 | 7.5% |
| Widowed | 1 | 0.4% |
| Divorced/separated | 56 | 20.3% |
| Education | ||
| No studies | 26 | 9.4% |
| Ninth grade or less | 111 | 40.2% |
| 10th to 11th grade | 82 | 29.7% |
| High school | 28 | 10.2% |
| Vocational training | 13 | 4.7% |
| More than high school | 16 | 5.8% |
| Professional status | ||
| Unemployed | 47 | 17.0% |
| Unqualified employee | 53 | 19.2% |
| Qualified employee | 159 | 57.6% |
| Employee with specific qualification | 10 | 3.6% |
| Employee with higher education | 7 | 2.6% |
Criminal Characteristics of the Sample (N=276).
| Characteristics | Values |
|---|---|
| Current sentence length (months) | 8-288 |
| M | 88.68 |
| SD | 77.64 |
| Age at current incarceration (years) | 31.73 |
| SD | 9.84 |
| Minimum and maximum values | 16-60 |
| Age at first incarceration (years) | 25.14 |
| SD | 10.10 |
| Minimum and maximum values | 10-60 |
| Official prior arrests (years) | 3.87 |
| SD | 3.99 |
| Minimum and maximum values | 1-23 |
| Official prior convictions (years) | 4.43 |
| SD | 4.79 |
| Minimum and maximum values | 1-50 |
The Psychopathy Checklist–Revised (PCL-R; Hare, 1991, 2003). The PCL-R consists of 20 items and two factors assessing psychopathy in clinical and forensic populations. Several studies have supported the psychometric properties of the PCL-R as well as its use as a predictor of violence (Mokros, Vohs, & Habermeyer, 2014; Olver, Lewis, & Wong, 2013; Piquero et al., 2012; Walters, 2012). The Spanish standardization of the PCL-R (Moltó, Poy, & Torrubia, 2010) was used in the present study.
The Violence Risk Appraisal Guide (VRAG; Harris, Rice, & Quinsey, 1993). The VRAG is a measure developed for assessing the risk of violent recidivism in penitentiary and forensic populations. The instrument displays the probability that an offender will commit another violent crime. Higher scores indicate a greater risk of reoffending violently. The instrument consists of a list of 12 items: 1) lived with both biological parents till age 16 (except for death of parent); 2) elementary school maladjustment; 3) history of alcohol problems; 4) marital status (at the time of or prior to index offense); 5) criminal history score for nonviolent offenses prior to the index offense; 6) failure on prior conditional release (includes parole or probation violation or revocation, failure to comply, bail violation, and any new arrest while on conditional release); 7) age at index offense; 8) victim injury for index offense; 9) any female victim for index offense; 10) meets the Diagnostic and Statistical Manual of Mental Disorders (DSM) criteria for any personality disorder; 11) meets DSM criteria for schizophrenia; and 12) Psychopathy Checklist-Revised score. The Spanish version of the VRAG (Ballesteros, Graña, & Andreu, 2006) was used at the present study.
The Self-Appraisal Questionnaire (SAQ; Loza, 2005). The SAQ is a self-report instrument designed to predict violent and nonviolent recidivism and assess treatment needs in correctional and forensic populations. The questionnaire is composed of 72 true-false items that comprise eight subscales: 1) Criminal Tendencies; 2) Antisocial Personality; 3) Conduct Problems; 4) Criminal History; 5) Alcohol and Drug Use; 6) Antisocial Associates; 7) Anger; and 8) Validity. It is important to note the Validity subscale is included in the other SAQ subscales, and the specific items on this subscale allow one to validate the offender's accuracy when responding to the SAQ items. In particular, these items ask about prior arrests or convictions. Complementarily to the SAQ total score, the score for each subscale can be calculated to assess potential treatment targets (Loza, 2005).
The SAQ measures the predictive variables found in the literature to be related to violent and nonviolent recidivism. The SAQ total score yields an estimation of the offender's level of risk and determines the offender's probability of recidivism, with higher scores indicating a greater level of risk and recidivism. According to Loza and Loza-Fanous (2003), the probability of recidivism can be estimated from the total score as low (SAQ total score=2 to 19), medium (20 to 30), and high (31 to 58). The Spanish translation of the SAQ (available in Andreu, 2010) was used in the present study.
ProcedureParticipation in the present study was voluntary and the following inclusion criteria were used: a) speaking Spanish; b) having a definitive judicial verdict and sentence; and c) having given written informed consent to participate in the research. All participants were informed that the information provided would be used for research purposes, and that all their data would remain confidential. They were individually interviewed and assessed by forensic psychology students from the Master's Degree in Clinical, Legal and Forensic Psychology (Complutense University of Madrid), who were trained in the administration of the risk assessment protocols used in this study. Offender's criminal history was obtained from penitentiary files.
Data AnalysisInternal consistency of the SAQ was examined with Cronbach's alpha. Pearson correlations were used to analyze the concurrent validity of the SAQ with related variables of violence risk. Group differences comparing recidivist groups of offenders were analyzed using Student's t-test, determining the effect size with the partial eta squared coefficient. To examine the SAQ's predictive efficiency for recidivism, the ROC curve was taken into account. All analyses were performed with the SPSS software (v. 22.0).
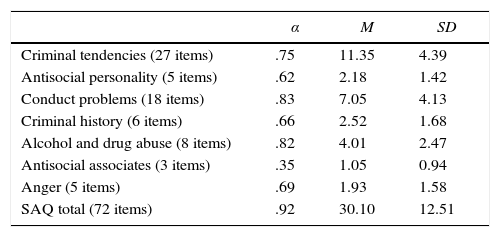
ResultsInternal ConsistencyTable 3 shows the internal consistency for the SAQ total score and subscales. The alpha coefficient for the SAQ total score was .92, and alpha coefficients for the subscales ranged from .35 (antisocial associates subscale) to .83 (conduct problems subscale).
Internal Consistency of SAQ Total and Subscale.
| α | M | SD | |
|---|---|---|---|
| Criminal tendencies (27 items) | .75 | 11.35 | 4.39 |
| Antisocial personality (5 items) | .62 | 2.18 | 1.42 |
| Conduct problems (18 items) | .83 | 7.05 | 4.13 |
| Criminal history (6 items) | .66 | 2.52 | 1.68 |
| Alcohol and drug abuse (8 items) | .82 | 4.01 | 2.47 |
| Antisocial associates (3 items) | .35 | 1.05 | 0.94 |
| Anger (5 items) | .69 | 1.93 | 1.58 |
| SAQ total (72 items) | .92 | 30.10 | 12.51 |
Note. SAQ=Self-Appraisal Questionnaire.
Concurrent validity was analyzed by correlating SAQ scores with two instruments that show adequate psychometric properties for violence risk assessment. Pearson correlation coefficients between all measures are shown in Table 4. The SAQ total score showed moderate correlations with the PCL-R total score (r=.47, p<.01) and higher correlations with the VRAG total score (r=.65, p<.01). Correlations between the SAQ subscales and the PCL-R total score ranged from .20 to .47 and correlations with the VRAG total score ranged from .34 to .65. Analysis of the correlations between the SAQ subscales and factors 1 and 2 from the PCL-R showed that antisocial associates and anger did not show any significant correlations with PCL-R Factor 1. The rest of the SAQ subscales displayed higher correlations with PCL-R Factor 2, ranging from .36 (anger) to .53 (criminal history), in comparison with PCL-R Factor 1, whose correlations ranged from .13 (criminal tendencies and conduct problems) to .22 (antisocial personality). Lastly, the SAQ total score had a higher correlation with PCL-R Factor 2 (r=.66) than with Factor 1 (r=.13).
Correlation Matrix of SAQ Scales and Violence Risk Measures (PCL-R & VRAG).
| PCL-R Factor 1 | PCL-R Factor 2 | PCL-R total score | VRAG Total score | |
|---|---|---|---|---|
| Criminal tendencies | .13* | .50** | .37** | .44** |
| Antisocial personality | .22** | .49** | .43** | .47** |
| Conduct problems | .13* | .61** | .45** | .57** |
| Criminal history | .19** | .53** | .42** | .57** |
| Alcohol and drug abuse | .13* | .44** | .20** | .54** |
| Antisocial associates | .02 | .41** | .26** | .43** |
| Anger | .09 | .36** | .26** | .34** |
| SAQ total | .13* | .66** | .47** | .65** |
Note. SAQ=Self-Appraisal Questionnaire; PCL-R=Psychopathy Checklist–Revised; VRAG=Violence Risk Appraisal Guide; PCL-R Factor 1=Interpersonal/affective; PCL-R Factor 2=Lifestyle/Antisocial.
* p<.05, ** p<.01.
In order to examine the predictive validity of the SAQ, the following criterion was used as a measure of recidivism: a second or subsequent entry in prison by the same person for committing a violent crime in the community, which may have been committed after serving the sentence or while enjoying a temporary leave from prison. A violent crime is defined as a felony involving acts reasonably regarded as likely to harm other people, clearly threatening behaviors, sexual aggressions, and the destruction of objects (Andrés-Pueyo & Echeburúa, 2010). The sample was divided into two groups: violent recidivists (individuals who committed a new crime qualified as violent during the temporal period ranging from 2007 and 2011) and nonviolent recidivists (primary offenders or individuals who committed a new offense considered nonviolent) during the same temporal interval in which retrospective recidivism of the offenders was estimated.
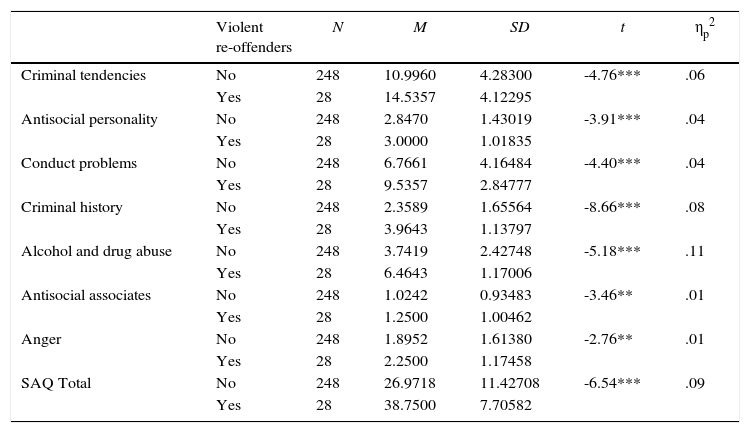
Table 5 shows the comparison of both groups in the SAQ: the means for the violent recidivist group were higher in all subscales and SAQ total score than the means of the nonviolent recidivist group, and the differences were statistically significant at p<.001. The highest value for the partial square eta coefficient corresponded to alcohol and drug abuse (.11), criminal history (.09), and SAQ total score (.09).
Comparison of SAQ Scores across Violent and Non-violent Re-offenders.
| Violent re-offenders | N | M | SD | t | ηp2 | |
|---|---|---|---|---|---|---|
| Criminal tendencies | No | 248 | 10.9960 | 4.28300 | -4.76*** | .06 |
| Yes | 28 | 14.5357 | 4.12295 | |||
| Antisocial personality | No | 248 | 2.8470 | 1.43019 | -3.91*** | .04 |
| Yes | 28 | 3.0000 | 1.01835 | |||
| Conduct problems | No | 248 | 6.7661 | 4.16484 | -4.40*** | .04 |
| Yes | 28 | 9.5357 | 2.84777 | |||
| Criminal history | No | 248 | 2.3589 | 1.65564 | -8.66*** | .08 |
| Yes | 28 | 3.9643 | 1.13797 | |||
| Alcohol and drug abuse | No | 248 | 3.7419 | 2.42748 | -5.18*** | .11 |
| Yes | 28 | 6.4643 | 1.17006 | |||
| Antisocial associates | No | 248 | 1.0242 | 0.93483 | -3.46** | .01 |
| Yes | 28 | 1.2500 | 1.00462 | |||
| Anger | No | 248 | 1.8952 | 1.61380 | -2.76** | .01 |
| Yes | 28 | 2.2500 | 1.17458 | |||
| SAQ Total | No | 248 | 26.9718 | 11.42708 | -6.54*** | .09 |
| Yes | 28 | 38.7500 | 7.70582 |
Note. SAQ=Self-Appraisal Questionnaire.
** p<.01, *** p<.001.
The next step in the examination of the validity of the SAQ was though investigation of the SAQ's predictive efficiency. Using the receiving operator characteristic (ROC) curve, the diagnostic efficacy of the SAQ was described in terms of sensitivity (probability that the measure correctly classified violent recidivist participants) and specificity (probability that the measure correctly classified the nonviolent recidivist participants). Values for sensitivity and for false-positive rates (1 – specificity) were plotted, and the area under the curve (AUC) represented the probability that the measure correctly classified participants as positive or negative with respect to recidivism. This area theoretically ranges from 0.5 (inaccuracy in discriminating) to 1.0 (perfect accuracy). The following traditional point system is a rough guide for classifying accuracy: (a) .90-1.0=excellent, (b) .80-.90=good, (c) .70-.80=fair, (d) .60-.70=poor, and (e) .50-.60=failure.
The ROC analysis carried out on the SAQ total score revealed an AUC of .80 (95% CI [0.73, 0.87]), showing acceptable accuracy discriminating between violent and nonviolent recidivist. Thus, there would be an 80% probability that the diagnosis of a violent recidivist was correct. Figure 1 presents the ROC curve for SAQ total score and violent recidivism.
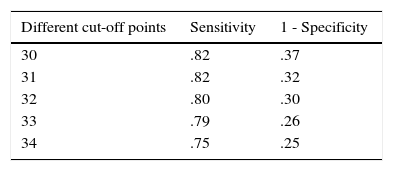
The best cut-off point that discriminated between violent and nonviolent recidivists was 32 (see Table 6), with a sensitivity of 80% and a 1-specificity of 30%. Thus, in eighty percent of the cases, a score of 32 correctly classified 80% percent of the violent offenders and 70% of the nonviolent recidivist group.
Figure 2 presents the ROC curves comparing the predictive efficiency of the SAQ, the PCL-R, and the VRAG for violent recidivism. The AUC of the PCL-R (AUC=.63) was lower than that of the SAQ (AUC=.80), whereas the VRAG obtained the highest AUC (.87).
DiscussionThe main aim of this study was to analyze the concurrent and predictive validity of the SAQ in a Spanish sample of offenders. The analysis of the SAQ revealed adequate levels of reliability. In particular, the overall internal consistency of the total score of the SAQ was high (.92). Nevertheless, subscales with fewer than eight items (antisocial personality, criminal history and antisocial associates) showed lower internal consistency than the commonly accepted standards (.70 and above). On the one hand, the low internal consistency of these subscales could be attributable to the small number of items on them. On the other hand, Kubiak et al. (2014), Loza, Neo, Shahinfar, and Loza-Fanous (2005), and Mitchell, Caudy, and MacKenzie (2013) found similar issues and pointed to small sample sizes and low inter-item correlations as possible explanations for low internal consistency. That the findings of the present research replicate these problems may point to the need for further developmental work on the SAQ subscales.
The results of this research regarding the concurrent validity of the SAQ were similar to those found by Loza et al. (2000) and other studies conducted with different type of populations (Loza et al., 2004; Loza et al., 2005; Summers & Loza, 2004), when the SAQ total and subscale scores were correlated and compared with risk assessment instruments such as the VRAG (Harris et al., 1993) and the PCL-R (Hare, 1991). Overall, the results obtained in our study highlight that the SAQ is a useful self-report instrument for violence risk prediction.
Following the original studies of Loza et al. (2005), recidivism is used as a criterion to assess the predictive validity of the SAQ, and this has proven to be a crucial factor to predict the risk of violence (Andrews & Bonta, 2010; Arbach & Andrés-Pueyo, 2007; Loinaz, Irureta, & Domenech, 2011). According to the criteria established by Andrés-Pueyo and Echeburúa (2010), the rate of violent recidivism was determined by participants who re-entered prison due to the new commission of a violent crime over a 5-year period during the 9 years in which this research was conducted. In the present study, this procedure allowed finding a violent recidivism rate of 10.1%, similar to the violent recidivism rates described by other studies in Spain, which ranged from 10 to 18% (Andrés-Pueyo & Echeburúa, 2010).
The results of this study indicated that violent recidivists obtain a high score in the total SAQ and in all the subscales when compared to the group of nonviolent recidivists. The high effect size found for the total score of SAQ and its subscales, particularly the criminal history and drug and alcohol abuse, emphasizes this result. Indeed, these factors have been highlighted in numerous studies for their high capacity to increase the risk of criminal violence (Andrés-Pueyo & Echeburúa, 2010; Andreu, Graña, Peña, & Ballesteros, 2013; Andrews & Bonta, 2010; Hanson, 2009; Soler & García, 2007).
With regard to the predictive efficiency of the instrument, it was analyzed by the ROC curve to determine the discriminant ability of the SAQ when distinguishing recidivist offenders from those who were not recidivists. In the case of violent prison recidivism, the AUC obtained was .80; a high AUC value indicates adequate discriminant ability of the instrument. Indeed, after a follow-up period of two years, Loza and Loza-Fanous (2000) found that the total SAQ score for general recidivism had an AUC of .80, and of .75 for violent recidivism, a lower value than that found in the current investigation. However, Loza and Loza-Fanous (2003) found higher sensitivity indices of predictive validity for the SAQ, reaching 85%, and specificity of 70%, when predicting future violent crimes in follow-up periods up to five years after the offenders’ release.
In the present study, the cut-off score of the instrument was selected as reflecting a better balance between sensitivity (true positive rate of repeat offenders) and specificity (true negative rate of offenders). In the case of violent recidivism, the most suitable point for the SAQ was a cut-off score that ranked 32 and 80% of those who show violent recidivism (true positives), but this cut-off yielded 30% of false positives.
Findings of this study suggest that the SAQ results were quite similar to other predictive validation analyses (Loza et al., 2000; Loza & Green, 2003). According to our results, it can be concluded that the SAQ total score is a reliable and valid measure for predicting violence risk in Spanish offenders. Nevertheless, it is not recommended that the SAQ be considered a replacement for more comprehensive violence risk instruments, but rather that the SAQ fills a gap for delinquents who would otherwise not be assessed and may act as a supplement to offer case management staff new information. It is important to highlight that the Spanish version of the SAQ only provides information for a complementary use in violence risk assessment, and convergence with other instruments validated for the prediction of violence should be sought. Nevertheless, an important limitation of this study is its retrospective design because this type of design does not allow predicting recidivism among violent offenders after their release. Therefore, estimation of predictive validity of the SAQ should be performed using a longitudinal design with prospective offenders’ data collection.
To sum up, the SAQ would meet virtually most of the guidelines postulated by Singh, Yang, Mulvey, and the RAGGE group (2015), who have recently proposed a list of criteria as a guide for assessing the applicability, practicality, and effectiveness of studies on the predictive validity of violence risk. Thus, the risk assessment provided by this instrument is useful for predicting violence risk and managing such risk in Spanish offenders by incorporating dynamic factors of interest as well as technical guidance for developing security measures and specific interventions in offenders. Ultimately, the present study provides psychologists with a quality self-report tool for the prediction and management of violence risk in forensic and prison settings.
Conflict of InterestThe authors of this article declare no conflict of interest.
We would like to thank the students from the Master's Degree in Clinical, Legal and Forensic Psychology of the Complutense University of Madrid (Spain) who collaborated in the empirical data recollection.
Frist prize of the 22nd “Rafael Burgaleta” Applied Psychology Awards 2015.


