


The objectives of this study were to investigate the underlying mechanism of PPARα, LXRα, ChREBP, and SREBP-1c at the level of gene and protein expression with high-energy diets in liver and skeletal muscle.
Materials and methodsMetabolic changes with consumption of high fat (Hfat), high sucrose (Hsuc) and high fructose (Hfru) diets were assessed. Levels of mRNA and protein of PPARα, LXRα, ChREBP, and SREBP-1c were investigated. Body weight changes, histological structure of liver and plasma levels of some parameters were also examined.
ResultsIn Hfru group, body weights were higher than other groups (P<0.05). In liver, LXRα levels of Hsuc and Hfru groups were upregulated as 1.87±0.30 (P<0.05) and 2.01±0.29 (P<0.01). SREBP-1c levels were upregulated as 4.52±1.25 (P<0.05); 4.05±1.11 (P<0.05) and 3.85±1.04 (P<0.05) in Hfat, Hsuc, and Hfru groups, respectively. In skeletal muscle, LXRα and SREBP-1c were upregulated as 1.77±0.30 (P<0.05) and 2.71±0.56 (P<0.05), in the Hfru group. Protein levels of ChREBP (33.92±8.84ng/mg protein (P<0.05)) and SREBP-1c (135.16±15.57ng/mg protein (P<0.001)) in liver were higher in Hfru group. In skeletal muscle, LXRα, ChREBP and SREBP-1c in Hfru group were 6.67±0.60, 7.11±1.29 and 43.17±6.37ng/mg, respectively (P<0.05; P<0.01; P<0.05). The rats in Hfru group had the most damaged livers.
ConclusionBesides liver, fructose consumption significantly effects skeletal muscle and leads to weight gain, triggers lipogenesis and metabolic disorders.
Human beings, who have been on earth approximately for 200 thousand years, gave up hunter–gatherer lifestyle and turned to agriculture and animal husbandry 10–12 thousand years ago [1,2]. In the meantime, the integration of modern technology into food, agriculture and livestock industries has facilitated access to foodstuffs and this has caused some changes in human health. Changes in lifestyle (like reduced activity and mobility) and dietary changes have triggered various metabolic diseases [3,4].
Sustainable healthy life is possible with balanced and continuous consumption of essential nutrients, coupled with numerous factors. The dietary components and the proportions of these substances play an important role on the regulation of homeostasis by affecting many tissues in organism [5,6]. Obesity is associated with excessive consumption of food containing high fat, sucrose and/or fructose [7,8]. While dietary high fat intake has long been recognized to trigger obesity-related diseases, studies in recent years have revealed that carbohydrates are responsible for the formation of these diseases [9].
As a result of increasing population, demand for food and hence the demand for sucrose and fructose have gradually increased. Therefore, much more sucrose and fructose are produced day by day [10]. While world sugar production was 250 thousand tons per year in mid-19th century, production quantity of sugar has reached 8 million tons in the 20th century [4]. Today, approximately 170 million tons of sucrose and 15 million tons of HFCS (High Fructose Corn Syrup) are produced annually [11].
High amounts of sucrose and fructose used in diets cause more calorie intake. Higher calorie intake than the organism needs from simple carbohydrates triggers the development of metabolic disorders [12]. Sucrose and fructose have same metabolic energy (3950kcal/kg and 3750kcal/kg, respectively), but fructose has become more preferred than sucrose in production due to being more economical and sweeter (1.73 times sweeter than sucrose). HFCS has been presented as an alternative sweetener to diabetic patients due its low glycemic index. However, subsequent studies have shown that fructose, consumed abundantly via HFCS, is metabolized independently of insulin, triggering triglyceride production and lipogenesis. Chronic activation of lipogenesis pathway induces chronic metabolic disorders [13,14].
Fructose is metabolized independently of insulin in mammals. Furthermore, phosphofructokinase, the rate-limiting enzyme, is not involved in the metabolism of fructose. These factors lead to faster metabolization of fructose in the organism. Recent studies have shown that chronic fructose consumption leads to non-alcoholic fatty liver disease. Some of the researchers claim that in addition to high blood glucose and triglyceride levels, hypertension, abdominal obesity, insulin resistance and glucose intolerance arise with the consumption of fructose [4,12,13].
Scientific debates about the proportion of carbohydrate and fat sources in diet are ongoing. In this study, metabolic changes with consumption of high fat, high sucrose and high fructose diets for 90 days were investigated at molecular, biochemical and histopathological levels in rats. Levels of mRNA and protein of PPARα (Peroxisome Proliferator Activated Receptor alpha), LXRα (Liver X Receptor alpha), ChREBP (Carbohydrate Response Element Binding Protein), and SREBP-1c (Sterol Regulatory Element Binding Protein) were investigated in liver and skeletal muscle. Histology of liver tissue was also assessed.
2Methods and materials2.1Animals and dietsThis study was ethically approved by Hatay Mustafa Kemal University Animal Experiments Local Ethics Committee (Decision number: 2016/2-8). Approximately 3 months old (10–12 weeks old) male Wistar albino rats were used. The rats were allocated into 4 groups (Con: Control group, Hfat: High fat group, Hsuc: High sucrose group, and Hfru: High fructose group). Each group had 8 animals and there was no statistically significant difference among groups in terms of body weight.
The animals were subjected to acclimation to environmental conditions for a week before the start of the experimental protocol. The rats were housed in transparent cages consisting of polycarbonate material (4 rats in per cage). During the study, room conditions were as follows: 12-h light/dark schedule (07:00am to 07:00pm light, 07:00pm to 07:00am dark), 55% humidity, ambient temperature at 21±2°C. All rats were checked at least twice a day (morning and evening) until the end of the experimental period. Animals were given food and fresh water and ad libitum.
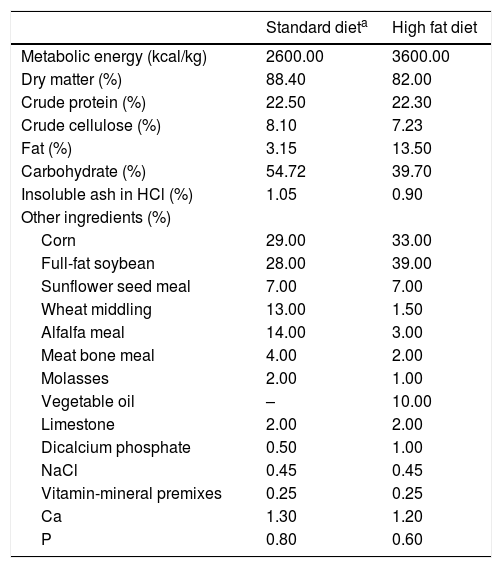
The daily energy amounts to be received by the rats in the experimental groups were planned similarly according to requirements [15]. Con, Hsuc and Hfru groups were provided with basic diets (2600kcal/kg). In addition to the basic diet, Hsuc and Hfru groups consumed sucrose and fructose solutions with 1kcal/mL metabolic energy in water. The solutions were presented in cage and allowed ad libitum consumption. Hfat diet was given a basic diet with the addition of sunflower oil (3600kcal/kg) (Table 1). The diets ingredients were calculated and given in Table 1. Hfat diet was prepared 3 days ago and stored at +4°C before being given to Hfat groups. Besides the basic diet, animals in the Hsuc and Hfru groups consumed the same percentage of sucrose and fructose solution (Solutions concentrations were approximately 27%).
Standard chow diet and fatty diet contents.
| Standard dieta | High fat diet | |
|---|---|---|
| Metabolic energy (kcal/kg) | 2600.00 | 3600.00 |
| Dry matter (%) | 88.40 | 82.00 |
| Crude protein (%) | 22.50 | 22.30 |
| Crude cellulose (%) | 8.10 | 7.23 |
| Fat (%) | 3.15 | 13.50 |
| Carbohydrate (%) | 54.72 | 39.70 |
| Insoluble ash in HCl (%) | 1.05 | 0.90 |
| Other ingredients (%) | ||
| Corn | 29.00 | 33.00 |
| Full-fat soybean | 28.00 | 39.00 |
| Sunflower seed meal | 7.00 | 7.00 |
| Wheat middling | 13.00 | 1.50 |
| Alfalfa meal | 14.00 | 3.00 |
| Meat bone meal | 4.00 | 2.00 |
| Molasses | 2.00 | 1.00 |
| Vegetable oil | – | 10.00 |
| Limestone | 2.00 | 2.00 |
| Dicalcium phosphate | 0.50 | 1.00 |
| NaCl | 0.45 | 0.45 |
| Vitamin-mineral premixes | 0.25 | 0.25 |
| Ca | 1.30 | 1.20 |
| P | 0.80 | 0.60 |
During the feeding period, body weight changes and consumed diet and water were recorded. After the feeding period, rats were deprived of food for 12h, but they were given ad libitum water. Euthanasia was performed by taking blood from the heart under anesthesia (80mg/kg Ketamine and 12mg/kg Xylazine, IP). Liver and skeletal muscle (left leg, M. Gluteus) tissues were rapidly collected to be frozen in liquid nitrogen. After freezing, tissues were stored at −86°C until gene expression and protein quantification analysis [16]. Liver samples for histopathological analysis were taken and fixed in 10% buffered formalin.
2.3Plasma analysesBlood samples taken during euthanasia were centrifuged at +4°C for 15min, plasma was obtained and stored at −86°C until biochemical analysis. Biochemical parameters were detected with autoanalyzer (Architect c8000 Chemistry Analyzer, Abbott Laboratories). Insulin levels of plasma samples were measured with rat specific kit (Sunred Bio, China) with ELISA Reader (Multiskan GO Microplate Spectrophotometer, ThermoFisher Scientific, USA).
2.4RNA extraction and cDNA synthesisApproximately 50mg tissue was used for RNA extraction. Tissue samples were immediately placed in RNase/DNase free sterile tubes and TRI-Reagent (Sigma-Aldrich, USA) was added without any waiting period. Total RNA extraction was performed according to TRI-Reagent kit protocol. RNA purity and concentration were checked with SMA-1000 Spectrophotometer (Merinton) and A260/A280 rates were >1.70. RNA quality was assessed with 1% agarose gel in electrophoresis, integrity was checked at rates of 28S and 18S rRNA subunits (at 100V and 25min).
After DNase treatment with DNase kit (DNase I, RNase free, ThermoFisher Scientific, USA), RNA samples were converted to cDNA with commercial kit (Revertaid First Strand cDNA Synthesis Kit, Thermo Fisher Scientific, USA). In thermal cycler, kit protocol was 60min at 42°C, 5min at 25°C and 5min at 70°C, respectively. Last volume of cDNA samples were filled up to 100μL with DEPC-treated water.
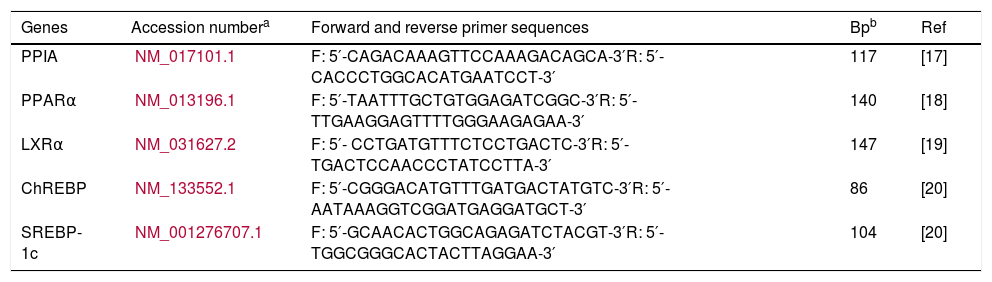
2.5Quantitative real-time PCRAfter isolating and converting total RNA samples from liver and skeletal muscle to cDNA, gene expression levels of PPARα, LXRα, ChREBP, and SREBP-1c were determined with commercial kit which contained SYBR green dye (Maxima SYBR Green/ROX qPCR Master Mix, ThermoFisher Scientific, USA). RT-qPCR (Rotor-Gene Q, Qiagen) protocol was as follows: 15s at 95°C, 60s at 60°C and 30s at 72°C for 40 cycles, after 15s at 95°C. Primers used for amplification of gene sequences were checked with Primer-Blast (NCBI) program (Table 2). PPIA (Peptidyl Prolyl Isomerase A) was used for internal control. All qPCR product lengths were checked with 1.5% agarose gel.
Sequences of target genes primers for qPCR.
| Genes | Accession numbera | Forward and reverse primer sequences | Bpb | Ref |
|---|---|---|---|---|
| PPIA | NM_017101.1 | F: 5′-CAGACAAAGTTCCAAAGACAGCA-3′R: 5′-CACCCTGGCACATGAATCCT-3′ | 117 | [17] |
| PPARα | NM_013196.1 | F: 5′-TAATTTGCTGTGGAGATCGGC-3′R: 5′-TTGAAGGAGTTTTGGGAAGAGAA-3′ | 140 | [18] |
| LXRα | NM_031627.2 | F: 5′- CCTGATGTTTCTCCTGACTC-3′R: 5′- TGACTCCAACCCTATCCTTA-3′ | 147 | [19] |
| ChREBP | NM_133552.1 | F: 5′-CGGGACATGTTTGATGACTATGTC-3′R: 5′-AATAAAGGTCGGATGAGGATGCT-3′ | 86 | [20] |
| SREBP-1c | NM_001276707.1 | F: 5′-GCAACACTGGCAGAGATCTACGT-3′R: 5′-TGGCGGGCACTACTTAGGAA-3′ | 104 | [20] |
Protein levels of PPARα, LXRα, ChREBP, and SREBP-1c were detected with rat specific ELISA kits (SunRed Bio, China). Total protein amounts of tissue samples were quantified with Lowry’s method [21].
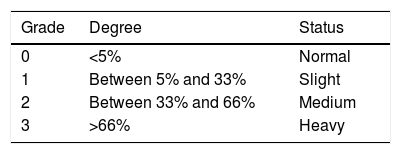
2.7HistopathologyApproximately 5μm thickness of fixed liver tissues in 10% buffered formalin was deparaffinized in xyloid. After being passed through a series of 100%, 96%, 80%, and 70% alcohol treatments, tissues were stained with Hematoxylin and Eosin [22]. After Hematoxylin and Eosin stain, microphotographs (Olympus DP12) of tissues were obtained under light microscope (Olympus CX31). Histopathological changes were assessed with inflammation, fatness, passive hyperemia, degenerative and necrotic changes (Table 3) [23].
2.8Statistical analysisSPSS package program (Version 22.0) was used for statistical calculations. Statistical differences between groups were determined by One Way ANOVA and Tukey test and P<0.05 were used as the cutoff for significance. Correlation between tissues PPARα, LXRα, ChREBP, SREBP-1c protein levels and biochemical parameters were assessed using Pearson's correlation analysis. The relative expression levels of genes normalized with internal control (PPIA) were calculated with 2−ΔΔCt method and given as fold change [24]. Peak value in histopathological findings was taken as score averages in groups.
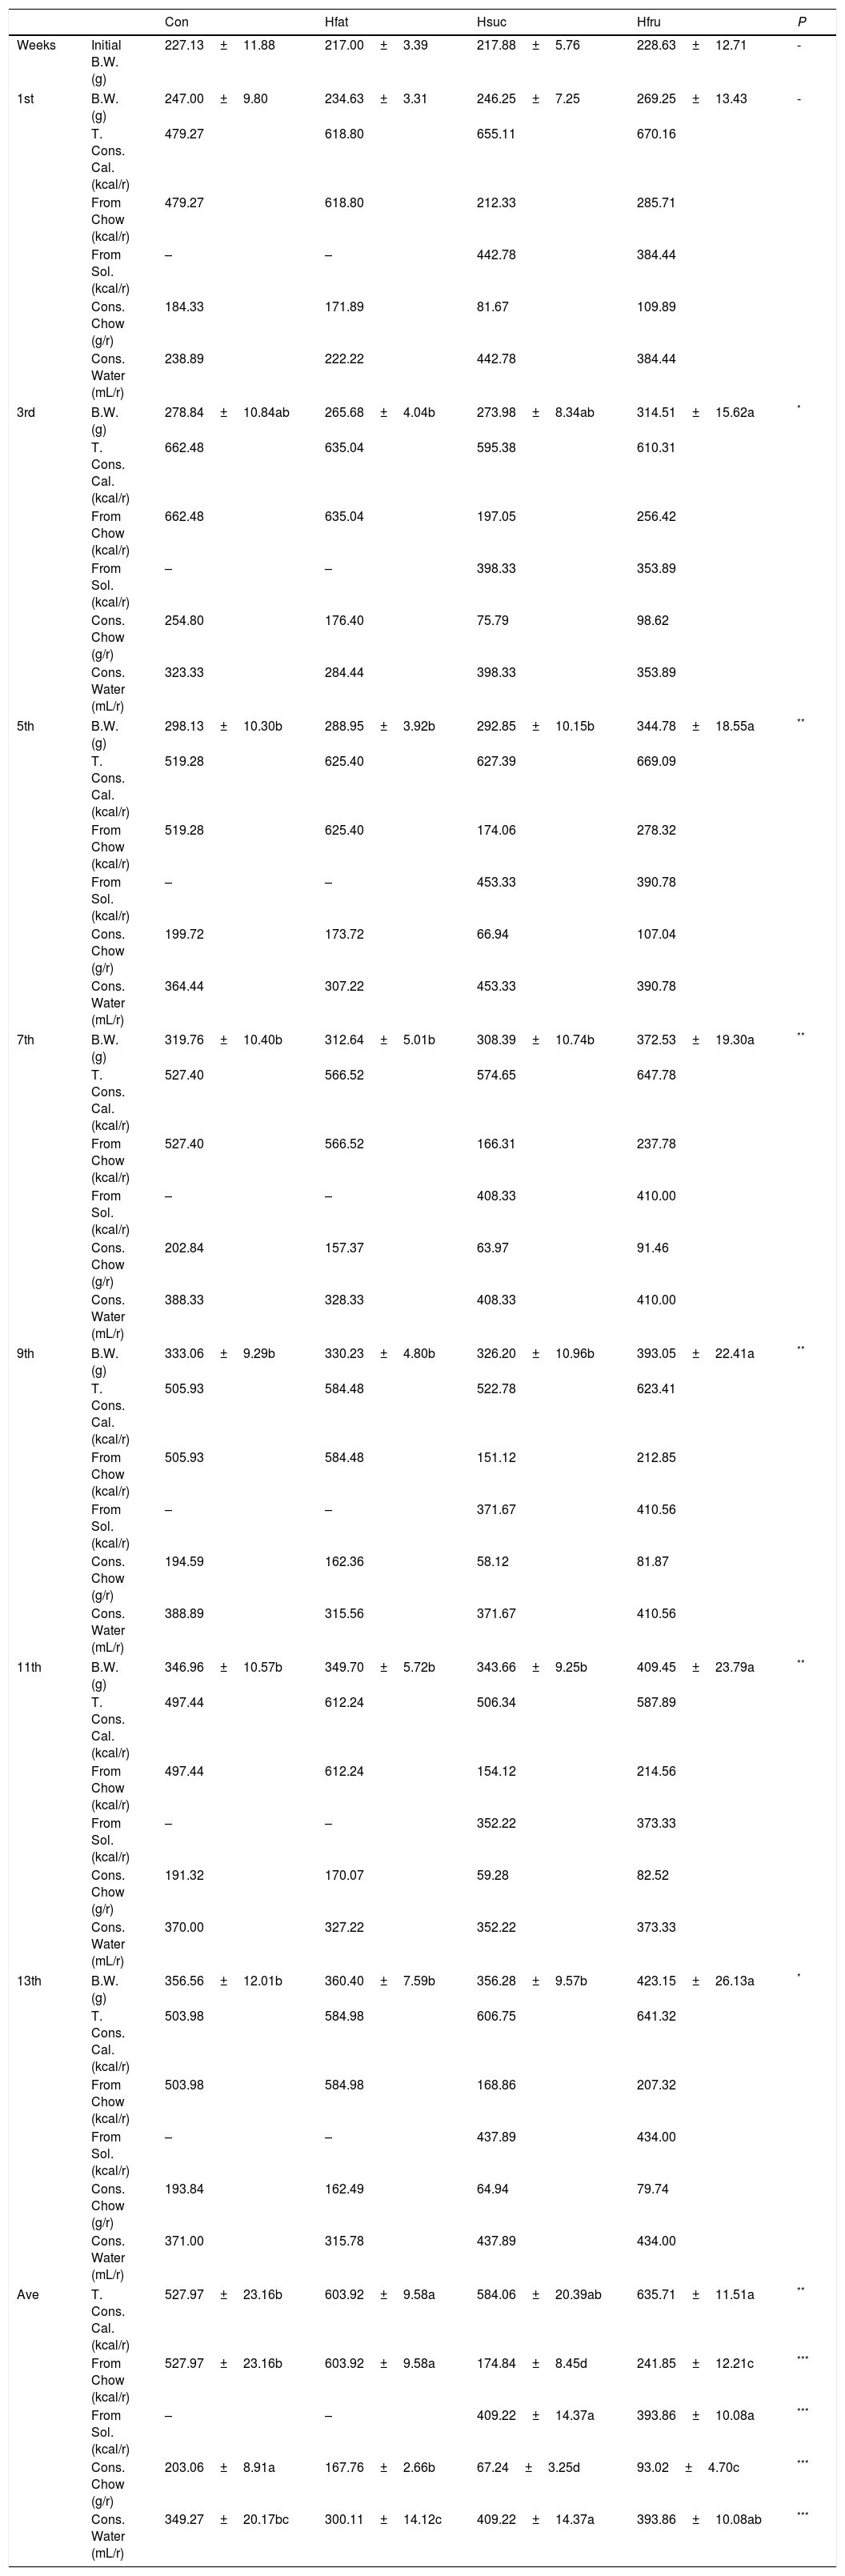
3Results3.1Food intake and body weightAverage metabolic energy received by Con, Hfat, Hsuc and Hfru groups were 527.97±23.16; 603.92±9.58; 584.06±20.39 and 635.71±11.51kcal/rat/week, respectively (P<0.05). Obtained energy from chow was 527.97±23.16; 603.92±9.58; 174.84±8.45 and 241.85±12.21kcal/rat/week. On the other hand, sucrose and fructose solutions were consumed weekly at 409.22±14.37 and 393.86±10.08mL/rat (average) by Hsuc and Hfru groups (P<0.001). Water consumption of groups was 349.27±20.17; 300.11±14.12; 409.22±14.37 and 393.86±10.08mL/rat/week. Most of the time in the feeding period, Hfru group was found to take more calories than other groups (average=635.71kcal/rat/week) (Table 4).
Body weight changes, consumed calorie (total, from chow and solution), consumed chow and water in all groups (X¯±Sx¯).
| Con | Hfat | Hsuc | Hfru | P | ||
|---|---|---|---|---|---|---|
| Weeks | Initial B.W. (g) | 227.13±11.88 | 217.00±3.39 | 217.88±5.76 | 228.63±12.71 | - |
| 1st | B.W. (g) | 247.00±9.80 | 234.63±3.31 | 246.25±7.25 | 269.25±13.43 | - |
| T. Cons. Cal. (kcal/r) | 479.27 | 618.80 | 655.11 | 670.16 | ||
| From Chow (kcal/r) | 479.27 | 618.80 | 212.33 | 285.71 | ||
| From Sol. (kcal/r) | – | – | 442.78 | 384.44 | ||
| Cons. Chow (g/r) | 184.33 | 171.89 | 81.67 | 109.89 | ||
| Cons. Water (mL/r) | 238.89 | 222.22 | 442.78 | 384.44 | ||
| 3rd | B.W. (g) | 278.84±10.84ab | 265.68±4.04b | 273.98±8.34ab | 314.51±15.62a | * |
| T. Cons. Cal. (kcal/r) | 662.48 | 635.04 | 595.38 | 610.31 | ||
| From Chow (kcal/r) | 662.48 | 635.04 | 197.05 | 256.42 | ||
| From Sol. (kcal/r) | – | – | 398.33 | 353.89 | ||
| Cons. Chow (g/r) | 254.80 | 176.40 | 75.79 | 98.62 | ||
| Cons. Water (mL/r) | 323.33 | 284.44 | 398.33 | 353.89 | ||
| 5th | B.W. (g) | 298.13±10.30b | 288.95±3.92b | 292.85±10.15b | 344.78±18.55a | ** |
| T. Cons. Cal. (kcal/r) | 519.28 | 625.40 | 627.39 | 669.09 | ||
| From Chow (kcal/r) | 519.28 | 625.40 | 174.06 | 278.32 | ||
| From Sol. (kcal/r) | – | – | 453.33 | 390.78 | ||
| Cons. Chow (g/r) | 199.72 | 173.72 | 66.94 | 107.04 | ||
| Cons. Water (mL/r) | 364.44 | 307.22 | 453.33 | 390.78 | ||
| 7th | B.W. (g) | 319.76±10.40b | 312.64±5.01b | 308.39±10.74b | 372.53±19.30a | ** |
| T. Cons. Cal. (kcal/r) | 527.40 | 566.52 | 574.65 | 647.78 | ||
| From Chow (kcal/r) | 527.40 | 566.52 | 166.31 | 237.78 | ||
| From Sol. (kcal/r) | – | – | 408.33 | 410.00 | ||
| Cons. Chow (g/r) | 202.84 | 157.37 | 63.97 | 91.46 | ||
| Cons. Water (mL/r) | 388.33 | 328.33 | 408.33 | 410.00 | ||
| 9th | B.W. (g) | 333.06±9.29b | 330.23±4.80b | 326.20±10.96b | 393.05±22.41a | ** |
| T. Cons. Cal. (kcal/r) | 505.93 | 584.48 | 522.78 | 623.41 | ||
| From Chow (kcal/r) | 505.93 | 584.48 | 151.12 | 212.85 | ||
| From Sol. (kcal/r) | – | – | 371.67 | 410.56 | ||
| Cons. Chow (g/r) | 194.59 | 162.36 | 58.12 | 81.87 | ||
| Cons. Water (mL/r) | 388.89 | 315.56 | 371.67 | 410.56 | ||
| 11th | B.W. (g) | 346.96±10.57b | 349.70±5.72b | 343.66±9.25b | 409.45±23.79a | ** |
| T. Cons. Cal. (kcal/r) | 497.44 | 612.24 | 506.34 | 587.89 | ||
| From Chow (kcal/r) | 497.44 | 612.24 | 154.12 | 214.56 | ||
| From Sol. (kcal/r) | – | – | 352.22 | 373.33 | ||
| Cons. Chow (g/r) | 191.32 | 170.07 | 59.28 | 82.52 | ||
| Cons. Water (mL/r) | 370.00 | 327.22 | 352.22 | 373.33 | ||
| 13th | B.W. (g) | 356.56±12.01b | 360.40±7.59b | 356.28±9.57b | 423.15±26.13a | * |
| T. Cons. Cal. (kcal/r) | 503.98 | 584.98 | 606.75 | 641.32 | ||
| From Chow (kcal/r) | 503.98 | 584.98 | 168.86 | 207.32 | ||
| From Sol. (kcal/r) | – | – | 437.89 | 434.00 | ||
| Cons. Chow (g/r) | 193.84 | 162.49 | 64.94 | 79.74 | ||
| Cons. Water (mL/r) | 371.00 | 315.78 | 437.89 | 434.00 | ||
| Ave | T. Cons. Cal. (kcal/r) | 527.97±23.16b | 603.92±9.58a | 584.06±20.39ab | 635.71±11.51a | ** |
| From Chow (kcal/r) | 527.97±23.16b | 603.92±9.58a | 174.84±8.45d | 241.85±12.21c | *** | |
| From Sol. (kcal/r) | – | – | 409.22±14.37a | 393.86±10.08a | *** | |
| Cons. Chow (g/r) | 203.06±8.91a | 167.76±2.66b | 67.24±3.25d | 93.02±4.70c | *** | |
| Cons. Water (mL/r) | 349.27±20.17bc | 300.11±14.12c | 409.22±14.37a | 393.86±10.08ab | *** | |
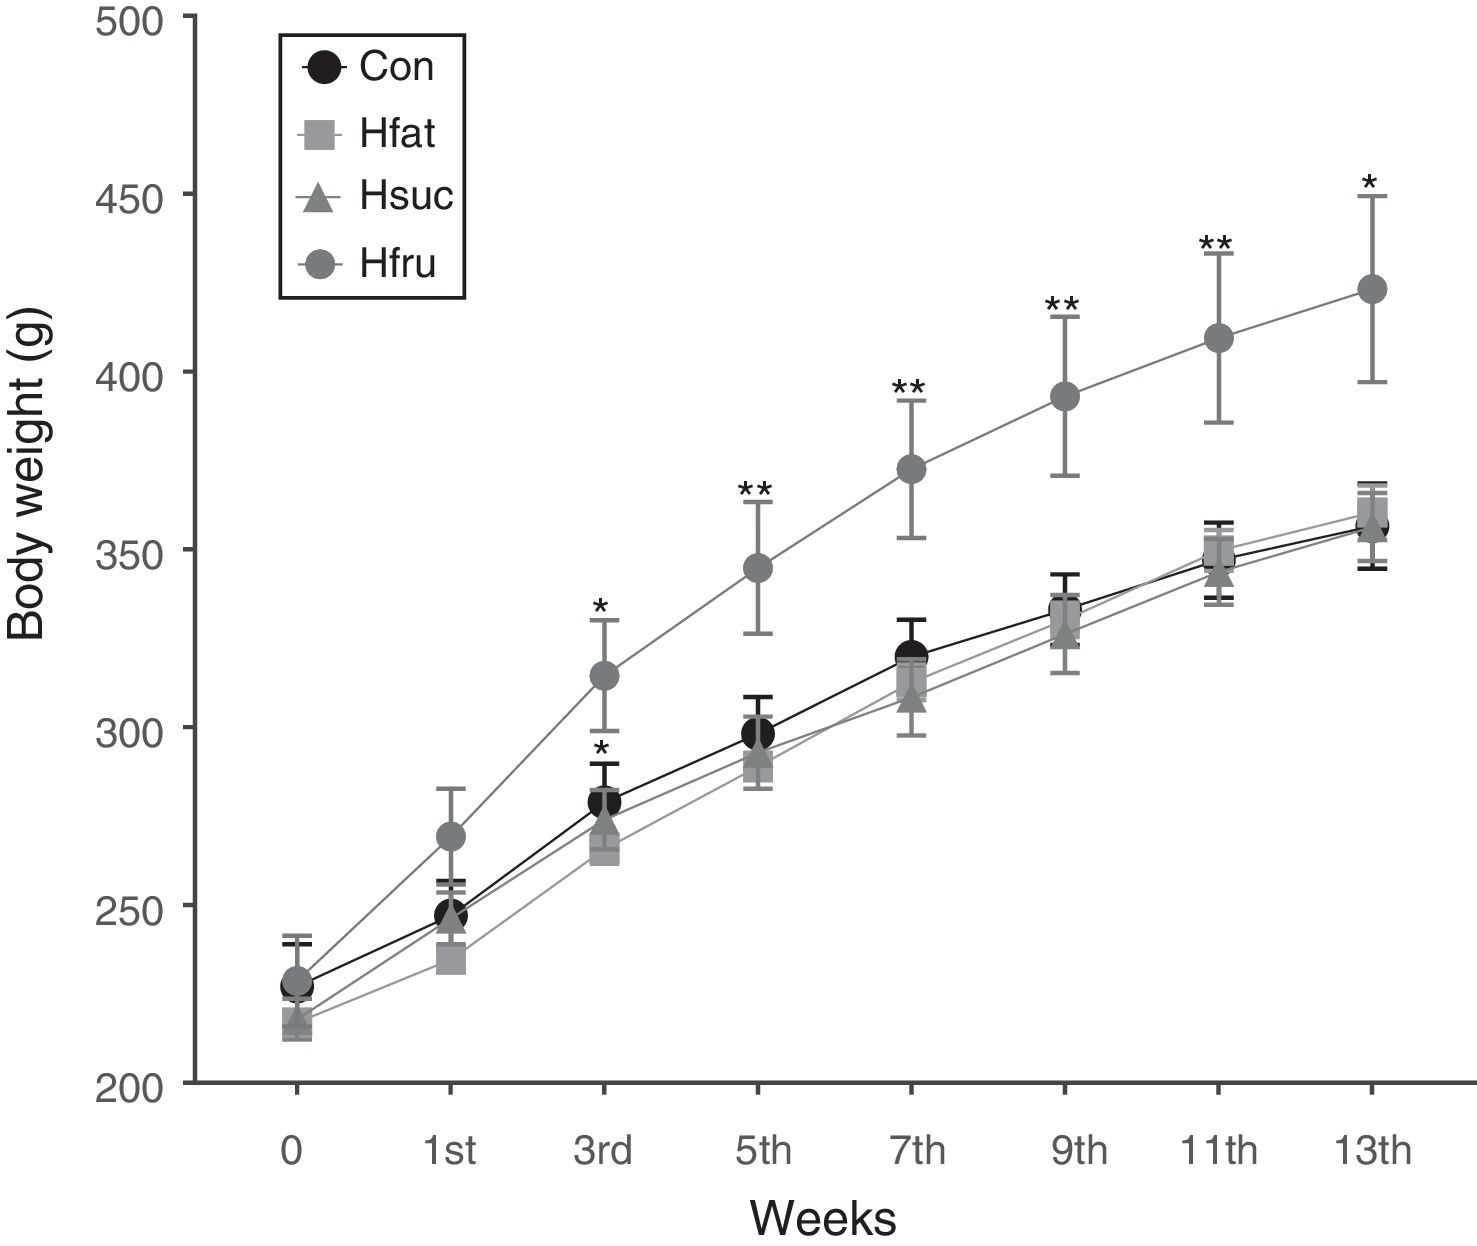
In the beginning of the study, while body weight averages were not statistically important among groups, Hfru group rats began to display higher values in body weight than the other groups at the 3rd week (P<0.05). These differences continued until the end of the study with different values of significance (P<0.05 and P<0.01). However, there was no difference in body weight among Con, Hfat and Hsuc groups in the whole feeding period (Fig. 1).
3.2Gene expression and tissue protein levels
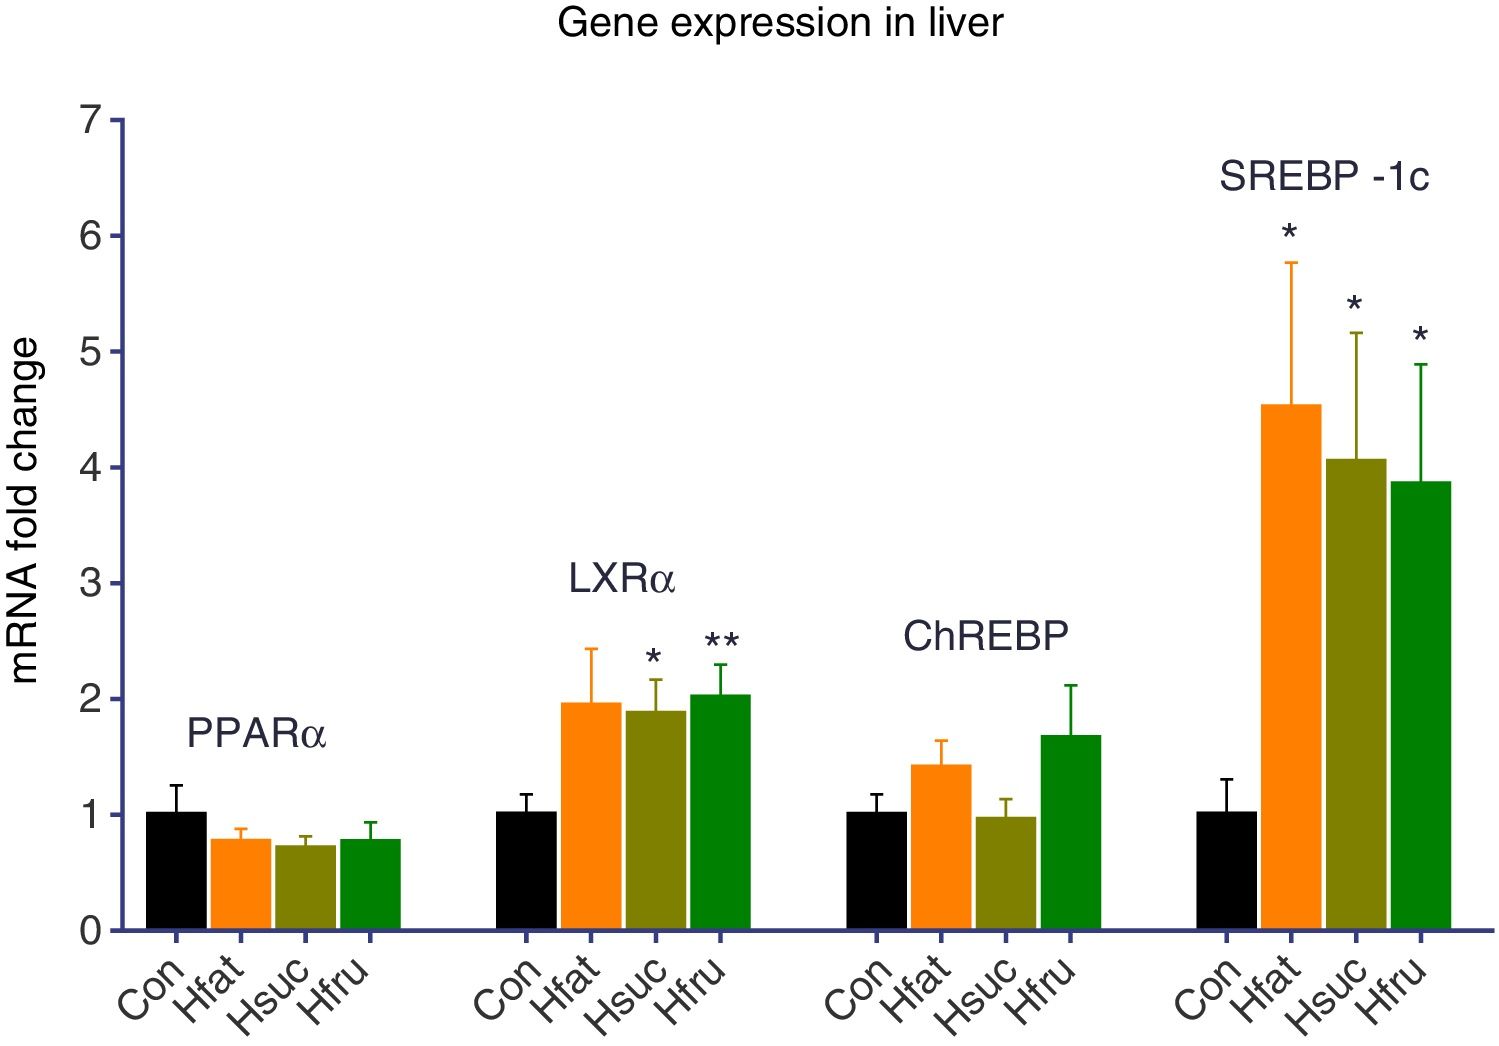
There was no upregulation of PPARα and ChREBP in experimental groups (Hfat, Hsuc and Hfru) for liver tissues. On the other hand, LXRα was upregulated 2 folds in all experimental groups according to Con group. Statistical upregulation for LXRα was observed only in Hsuc and Hfru groups (P<0.05). Also, SREBP-1c expression levels were 4 folds more in Hfat, Hsuc and Hfru groups than Con group (P<0.05) (Fig. 2).
 and Hfru (2.01±0.29) groups. SREBP-1c levels upregulated more than 3 folds in Hfat (4.52±1.25), Hsuc (4.05±1.11) and Hfru (3.85±1.04) groups (*P<0.05, **P<0.01).")
Gene expression results of liver tissue. Groups were compared with Con group. No significant differences were found between groups for PPARα and ChREBP genes. On the other hand, LXRα expression levels upregulated approximately 2 folds in Hsuc (1.87±0.30) and Hfru (2.01±0.29) groups. SREBP-1c levels upregulated more than 3 folds in Hfat (4.52±1.25), Hsuc (4.05±1.11) and Hfru (3.85±1.04) groups (*P<0.05, **P<0.01).
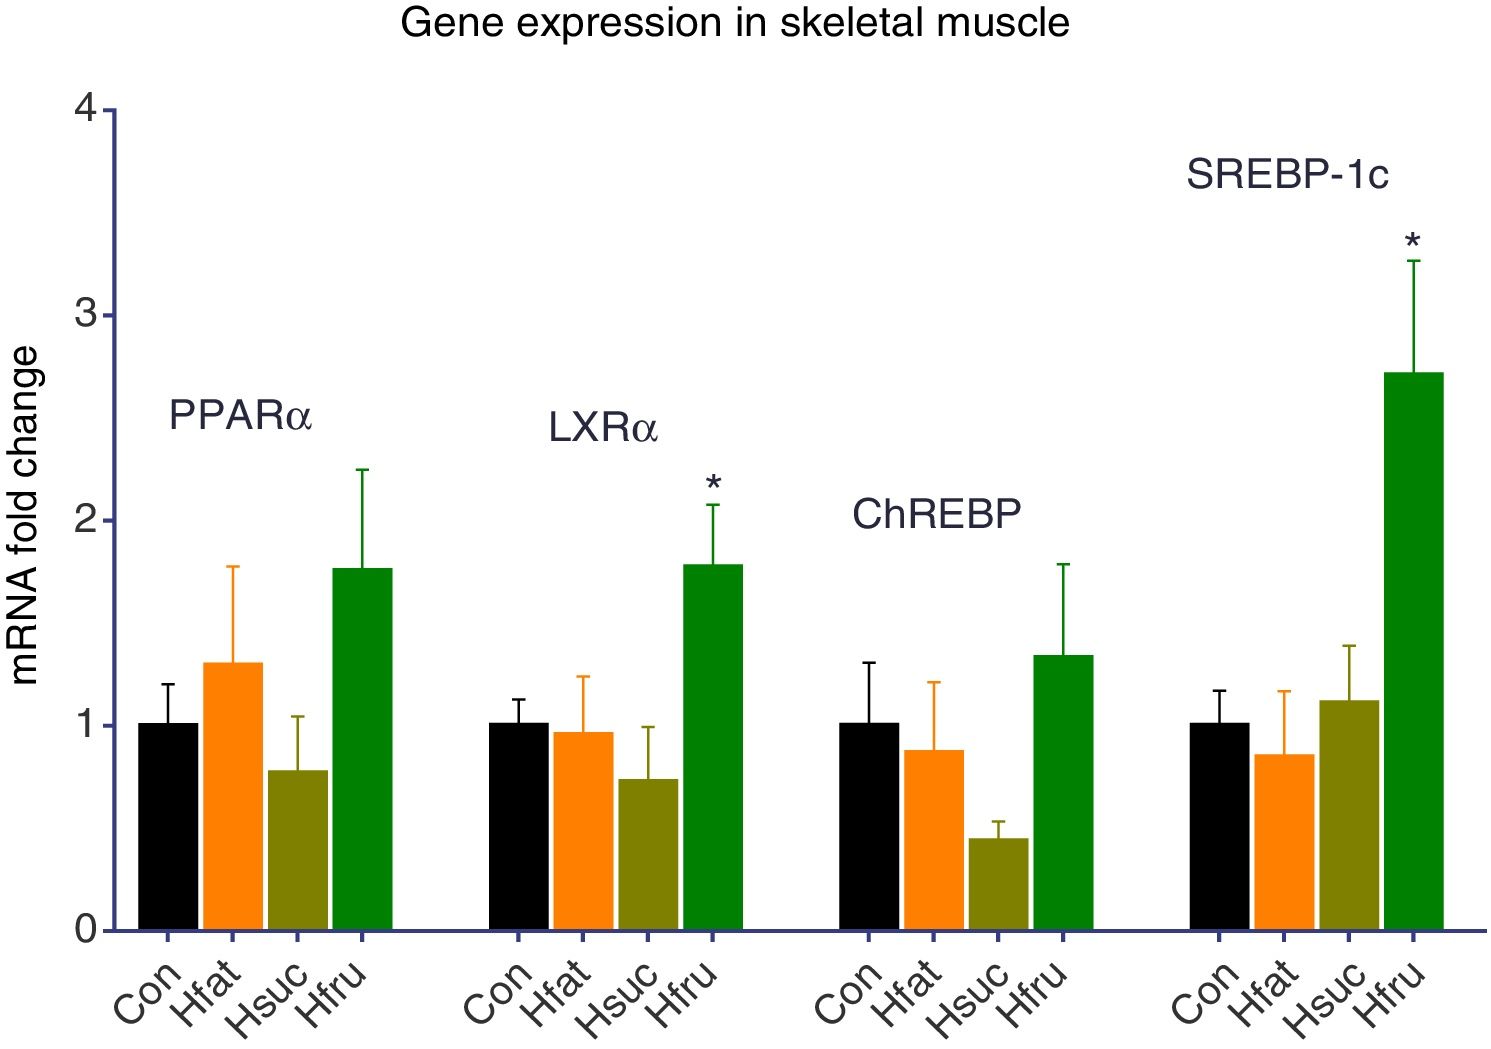
In skeletal muscles like liver, PPARα and ChREBP expression levels did not change. On the other hand, PPARα was expressed approximately 1.76-fold higher in the skeletal muscle in Hfru groups. LXRα gene expression result was found approximately 2 folds more in Hfru groups (P<0.05). At the same time, SREBP-1c expression levels were same in Con with Hfat and Hsuc, but almost 3 folds more in Hfru group (P<0.05) (Fig. 3).
3.3ELISA and SREBP-1c (2.71±0.56) expression levels upregulated (*P<0.05).")
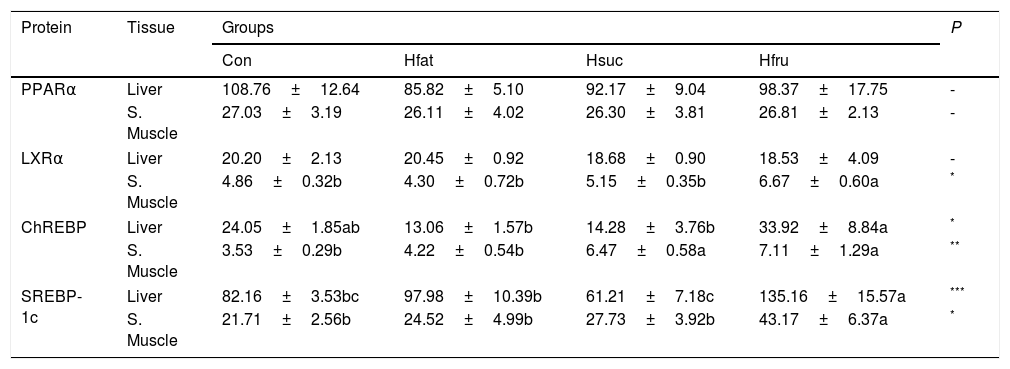
PPARα protein was found to be the same in all groups in liver and skeletal muscle. On the other hand, ChREBP and SREBP-1c protein contents of tissues were significantly different (P<0.05). In Hfru group, ChREBP and SREBP-1c showed the highest concentration in both tissues (Table 5).
Amounts of PPARα, LXRα, ChREBP, and SREBP-1c proteins in liver and skeletal muscle (ng/mg protein) (X¯±Sx¯).
| Protein | Tissue | Groups | P | |||
|---|---|---|---|---|---|---|
| Con | Hfat | Hsuc | Hfru | |||
| PPARα | Liver | 108.76±12.64 | 85.82±5.10 | 92.17±9.04 | 98.37±17.75 | - |
| S. Muscle | 27.03±3.19 | 26.11±4.02 | 26.30±3.81 | 26.81±2.13 | - | |
| LXRα | Liver | 20.20±2.13 | 20.45±0.92 | 18.68±0.90 | 18.53±4.09 | - |
| S. Muscle | 4.86±0.32b | 4.30±0.72b | 5.15±0.35b | 6.67±0.60a | * | |
| ChREBP | Liver | 24.05±1.85ab | 13.06±1.57b | 14.28±3.76b | 33.92±8.84a | * |
| S. Muscle | 3.53±0.29b | 4.22±0.54b | 6.47±0.58a | 7.11±1.29a | ** | |
| SREBP-1c | Liver | 82.16±3.53bc | 97.98±10.39b | 61.21±7.18c | 135.16±15.57a | *** |
| S. Muscle | 21.71±2.56b | 24.52±4.99b | 27.73±3.92b | 43.17±6.37a | * | |
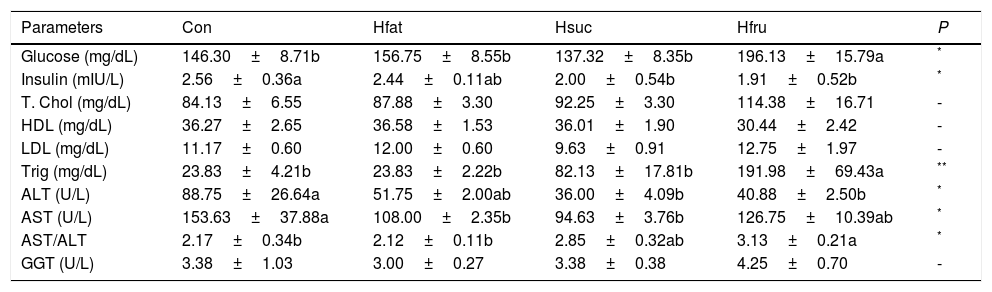
Plasma glucose and total cholesterol concentrations were the highest in Hfru group, and plasma glucose concentration was the lowest in Hsuc group (P<0.05). On the other hand, plasma glucose levels of Con, Hfat and Hsuc groups were the same. HDL, LDL and GGT levels were same in all groups. Triglyceride was significantly higher in Hfru group (P<0.05). Also, ALT and AST were found to be higher in Con and Hfru groups, but AST/ALT ratio was the highest value in the Hfru group (Table 6).
Biochemical parameters in plasma.
| Parameters | Con | Hfat | Hsuc | Hfru | P |
|---|---|---|---|---|---|
| Glucose (mg/dL) | 146.30±8.71b | 156.75±8.55b | 137.32±8.35b | 196.13±15.79a | * |
| Insulin (mIU/L) | 2.56±0.36a | 2.44±0.11ab | 2.00±0.54b | 1.91±0.52b | * |
| T. Chol (mg/dL) | 84.13±6.55 | 87.88±3.30 | 92.25±3.30 | 114.38±16.71 | - |
| HDL (mg/dL) | 36.27±2.65 | 36.58±1.53 | 36.01±1.90 | 30.44±2.42 | - |
| LDL (mg/dL) | 11.17±0.60 | 12.00±0.60 | 9.63±0.91 | 12.75±1.97 | - |
| Trig (mg/dL) | 23.83±4.21b | 23.83±2.22b | 82.13±17.81b | 191.98±69.43a | ** |
| ALT (U/L) | 88.75±26.64a | 51.75±2.00ab | 36.00±4.09b | 40.88±2.50b | * |
| AST (U/L) | 153.63±37.88a | 108.00±2.35b | 94.63±3.76b | 126.75±10.39ab | * |
| AST/ALT | 2.17±0.34b | 2.12±0.11b | 2.85±0.32ab | 3.13±0.21a | * |
| GGT (U/L) | 3.38±1.03 | 3.00±0.27 | 3.38±0.38 | 4.25±0.70 | - |
T. Chol: Total Cholesterol; Trig: Triglyceride.
a, b, c, d: Means with different letters in rows differ significantly.
Pearson's correlation analysis was performed to determine whether there were correlations between tissue protein levels of PPARα, LXRα, ChREBP, SREBP-1c and biochemical parameters.
In liver, significant positive correlation were observed between ChREBP protein levels and glucose (r=0.455, P<0.05), cholesterol (r=0.522, P<0.01), triglyceride (r=0.660, P<0.01) levels. On the other hand, a significant negative correlation was found between ChREBP protein levels and HDL (r=−0.419, P<0.05). Another significant correlations were observed between LXRα protein levels and ALT (r=0.446, P<0.05) and AST/ALT ratio (r=−0.398, P<0.05).
In skeletal muscle, LXRα (r=0.419, P<0.05), ChREBP (r=0.480, P<0.01) and SREBP-1c (r=0.433, P<0.05) protein levels correlated with AST/ALT ratio. SREBP-1c levels correlated positively with most of the biochemical parameters (glucose (r=0.581, P<0.01), cholesterol (r=0.469, P<0.01), LDL (r=0.443, P<0.05), triglyceride (r=0.473, P<0.01)) in skeletal muscle. Also, LXRα and blood glucose levels were found correlated (r=0.378, P<0.05). No significant correlation was found between any of the other parameters.
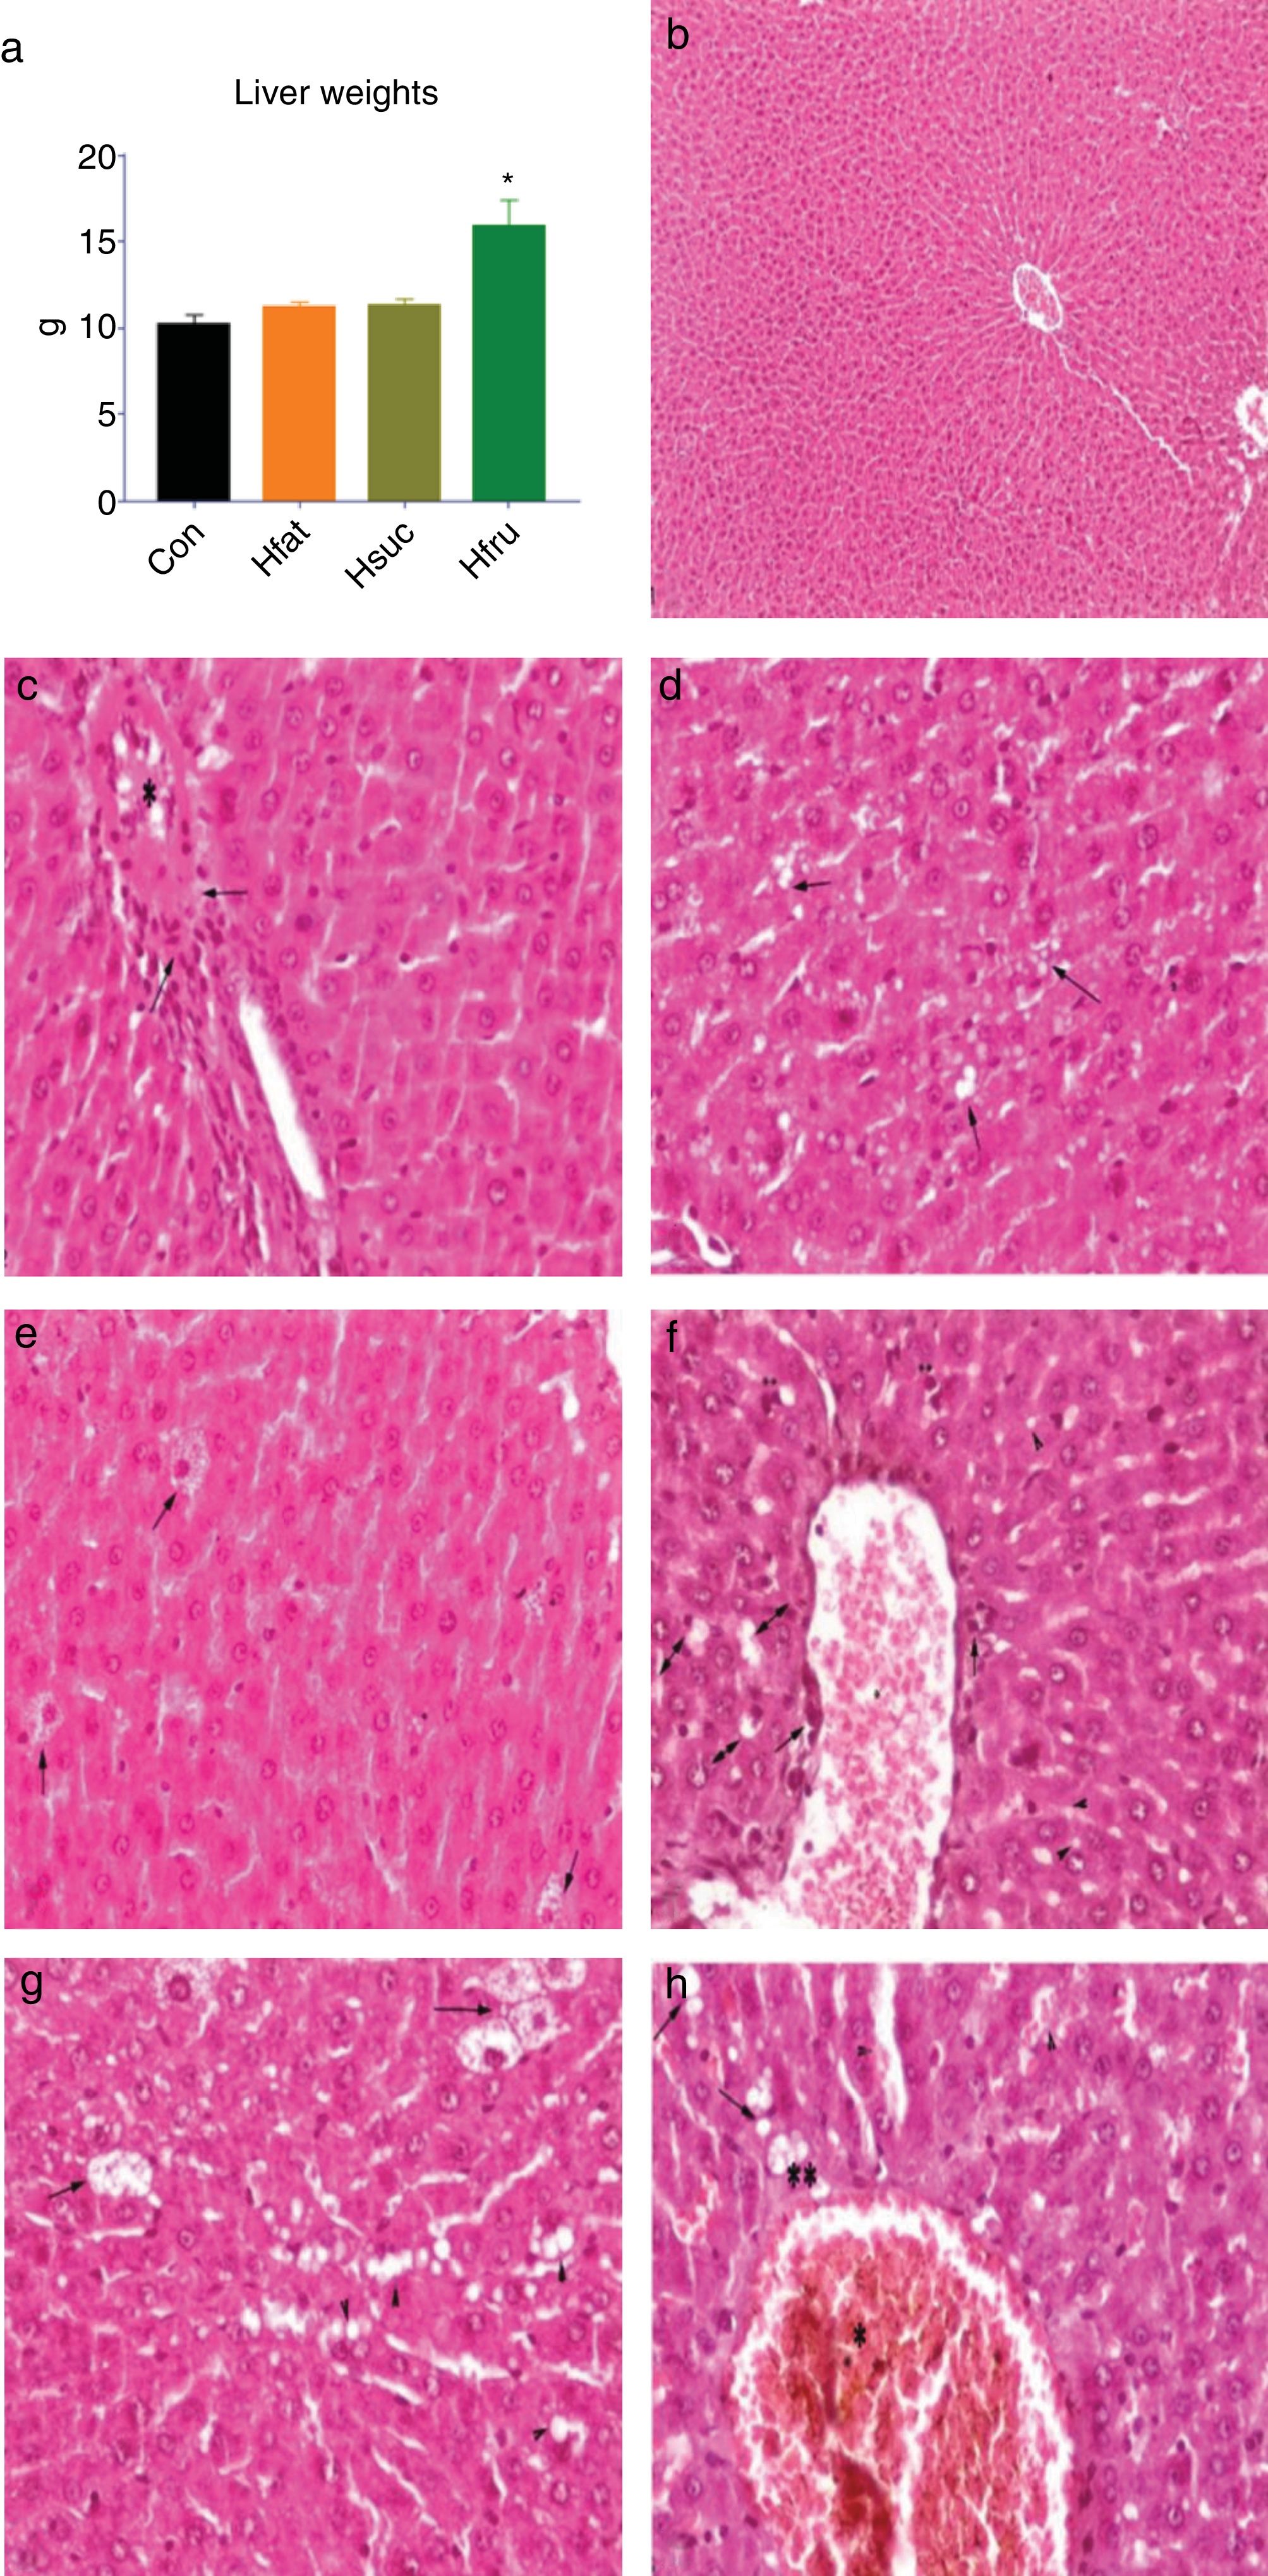
3.5HistopathologyLiver weight averages of Con, Hfat and Hsuc were similar (10.19±0.58; 11.19±0.32; 11.30±0.39, respectively), but Hfru group value was higher than other groups (15.90±1.52) (P<0.05) (Fig. 4a).
 Liver weights; (b) normal and healthy liver histology of Con group (H&E × 100μm); (c) hyalinous material and erythrocytes in vena centralis (*) and infiltration of inflammation cells (arrows) in Hfat group, H&E × 20μm; (d) sharp limited fat vacuoles in hepatocyte cytoplasm (arrows), in Hfat groups, H&E × 20μm; (e) balloon degeneration in hepatocytes (arrows) in Hsuc group, H&E × 20μm; (f) eosinophilia in hepatocytes and hyperchromasia in cytoplasm (**), erythrocytes in vena centralis (*) and inflammatory cell infiltration in the periphery (arrows), hydropic degeneration in hepatocytes (double arrows) and fat vacuoles in Hsuc group, H&E X 20μm; (g) fat vacuoles in hepatocytes (arrow heads), balloon degeneration (arrows) in Hfru group, H&E × 20μm; (h) hyalinous substance and erythrocyte accumulation in vena centralis (*), erythrocyte accumulation in sinusoidal spaces and expansion (arrow heads), lubrication (arrows), hydropic degeneration (**) in Hfru group, H&E × 20μm.")
(a) Liver weights; (b) normal and healthy liver histology of Con group (H&E × 100μm); (c) hyalinous material and erythrocytes in vena centralis (*) and infiltration of inflammation cells (arrows) in Hfat group, H&E × 20μm; (d) sharp limited fat vacuoles in hepatocyte cytoplasm (arrows), in Hfat groups, H&E × 20μm; (e) balloon degeneration in hepatocytes (arrows) in Hsuc group, H&E × 20μm; (f) eosinophilia in hepatocytes and hyperchromasia in cytoplasm (**), erythrocytes in vena centralis (*) and inflammatory cell infiltration in the periphery (arrows), hydropic degeneration in hepatocytes (double arrows) and fat vacuoles in Hsuc group, H&E X 20μm; (g) fat vacuoles in hepatocytes (arrow heads), balloon degeneration (arrows) in Hfru group, H&E × 20μm; (h) hyalinous substance and erythrocyte accumulation in vena centralis (*), erythrocyte accumulation in sinusoidal spaces and expansion (arrow heads), lubrication (arrows), hydropic degeneration (**) in Hfru group, H&E × 20μm.
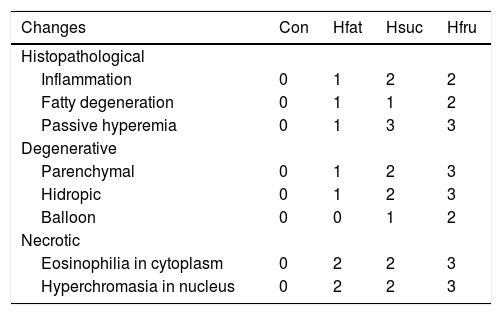
In Con group, hepatocytes, hepatic cords, and hepatic central vein were in normal histological structure (Fig. 4b). It was noted that vena centralis expanded with hyalinous material and erythrocytes, and there were mononuclear-like inflammatory cell infiltrations in the periphery of some portal veins in Hfat group. Also, eosinophilia had increased in some hepatocyte cytoplasms with occasional enlargement in the sinusoidal spaces between hepatocytes and nucleus has a darker blue color with hematoxylin (picnotic changes). In addition to these findings, degenerative changes were observed in the cytoplasm of some hepatocytes in focal areas, with sharp-limited fatty vacuoles (steatosis) (Fig. 4c and d). In Hsuc group, portal venules and sinusoidal regions were observed to expand due to erythrocyte accumulation (passive hyperemia) and there was a balloon degeneration in some hepatocytes with sharp limited fat vacuoles around the vena centralis in the focal areas. Additionally, degenerative (parenchyma to hydropic) and picnotic changes with a small amount of pericentrally localized mononuclear inflammatory cell infiltration were detected in hepatocytes (Fig. 4e and f). In Hfru group, hepatic cords were found to lose their order and intensive hyalinous material and erythrocyte accumulation were detected in venous lumens and pericentral placement of mononuclear cellular infiltration was seen. Because of the accumulation of erythrocytes, expansion was noticed in the sinusoidal spaces (passive hyperemia). Compared to Hfat and Hsuc groups, sharper, greater, limited, and diffusely distributed fat vacuoles (steatosis) were detected in Hfru group (Fig. 4g and h). The cytoplasm was more eosinophilic and hyperchromasia was detected in hepatocytes in Hfru group. Balloon degeneration was detected in the cytoplasm of some hepatocytes, and hepatocytes were severely affected by significant parenchyma and hydropic degeneration (at higher levels than Hsuc) (Table 7).
General histopathological changes in liver.
| Changes | Con | Hfat | Hsuc | Hfru |
|---|---|---|---|---|
| Histopathological | ||||
| Inflammation | 0 | 1 | 2 | 2 |
| Fatty degeneration | 0 | 1 | 1 | 2 |
| Passive hyperemia | 0 | 1 | 3 | 3 |
| Degenerative | ||||
| Parenchymal | 0 | 1 | 2 | 3 |
| Hidropic | 0 | 1 | 2 | 3 |
| Balloon | 0 | 0 | 1 | 2 |
| Necrotic | ||||
| Eosinophilia in cytoplasm | 0 | 2 | 2 | 3 |
| Hyperchromasia in nucleus | 0 | 2 | 2 | 3 |
Obesity and complications related to obesity may be triggered by the consumption of fructose in addition to the consumption of fatty diets with high saturated fatty acid [25–27]. It is general knowledge that high fat in the diet triggers weight gain, but the fatty acid ingredient of the diet is also important [28]. In a study [27], it has been reported that rats consumed chow diet and sucrose solution (35%) for 9 months and their body weights and consumption of chow diet did not change. This finding was believed to be related to the structure of sucrose. Sucrose is metabolized with insulin-dependent pathways due to glucose. Because of its insulin-independent metabolism, fructose does not suppress food intake and creates a hyperlipidemic effect which leads to a significant increase in body weight as noted by this study and also other studies (Table 4) [29].
Fructose is metabolized mainly in the liver since most tissues do not have fructose transport systems. Glucose-6-phosphate formed from glucose cannot be converted to triglyceride as it is regulated by phosphofructokinase, but it is possible for fructose since it becomes ready to convert triglyceride after converting fructose-1-phosphate. This causes lipid production by fructose faster than glucose in the liver. Furthermore, this difference in metabolism results in an increase in circulating triglyceride level due to fructose (Tables 6 and 7) [30,31].
Dietary high calorie intake triggers adipogenesis by suppressing PPARα activity [32]. Studies conducted with different concentrations of fructose solutions have shown that diets with sufficient energy content do not change the activity of PPARα [33–35]. Although studies indicate that the activity of PPARα in muscle tissue is suppressed if the content of sucrose and/or fructose used in the diet is high and feeding time with these carbohydrates is long, in this study, PPARα protein results in both tissues confirmed gene expression results in accordance with literature [33–35].
LXRα is reported to be mainly expressed in the liver and it is a reasonably important transcription factor on lipogenesis. LXRα is responsible for converting more carbohydrates to lipid and regulating the expression levels of ChREBP and SREBP-1c [8,36,37]. This transcription factor, determined as a glucose sensor by cell culture studies, is used as a potential therapeutic target in diabetes mellitus, dyslipidemia and cardiovascular diseases [38]. In accordance with the literature, the activity of LXRα depends on the amount of dietary energy and content of sucrose and fructose. In this study, activity of this transcription factor was at similar rates with other studies [8,35]. Both liver and skeletal muscle activity of LXRα gene was found to notably increase, especially in Hfru group. On the other hand, protein amounts of this transcription factor did not significantly change in any of the groups in the study. Although LXRα is an increased transcription factor in liver due to feeding, it is thought that its activity may be restricted by some post translational mechanisms such as miR-613 [39]. It has been reported that miR-613, which has been shown to be active by SREBP-1c promotor control, performs this function by some kind of negative feed-back mechanism [39,40]. In muscle tissue, the amount of LXRα protein in Hfru group confirmed gene expression results. Activation of LXRα in muscle tissue is an important factor for carbohydrate and lipid metabolism [41]. Some researchers claim that activity of this transcription factor is increased in skeletal muscle with lipid and carbohydrate related disorders [42]. This study shows that fructose is an important energy source that triggers lipogenic mechanisms through LXRα in liver as well as in muscle tissue. Skeletal muscle protein results suggest fructose may be more dangerous than sucrose in terms of disorders that may develop due to changes in lipid metabolism.
It is known that most of the genes associated with glucose metabolism in the liver are activated via ChREBP. Lipogenesis is largely mediated through ChREBP and SREBP-1c [43–45]. Experimental animal studies have shown that expression levels of lipogenic genes are reduced in response to glycosylation of ChREBP gene, resulting in decreased lipid production at significant levels [46]. It is conceivable that the amount of ChREBP protein may be low due to miRNA-613 in Hfat and Hsuc groups [40,47]. Significantly increased ChREBP activity in relation to the consumption of fructose in liver has also been shown in many studies [48–50]. In the case of excess production of ChREBP protein, the genes responsible genes expression levels for fatty acid and triglyceride synthesis are increased and hepatic steatosis is triggered [51]. In this study, it was determined that the amount of ChREBP protein in the Hsuc and Hfru groups was significantly higher than the other groups, although there was no difference on gene expression. There is not sufficient information about ChREBP activity in muscle tissue. It is thought that high amount carbohydrates in diets may have regulated the metabolic activity in skeletal muscle through ChREBP protein [52,53].
In the liver, SREBP-1c was upregulated about 4-fold in all experimental groups and it is understood that this upregulation may occur regardless of the energy source, it can increase if the dietary energy is high [44,54]. However, the amount of SREBP-1c protein is the highest in Hfru group and the lowest in Hsuc group (P<0.05) indicating that there was no equal protein translation with gene expression and this may have been controlled by post-translational mechanisms. It is reported that feed-back mechanisms, such as insig-1 and insig-2 which control the production of SREBP-1c proteins, play an important role for the control of lipid synthesis by insulin-mediated pathways [55]. It is also known that SREBP-1c mediated lipogenesis with dietary high fructose. It is triggered with the absence of miRNAs such as miR-145-3p, miR-7-1-5p, miR-33, and miR-613 [56,57]. Excess fat stored in muscle tissue may be associated with SREBP-1c and some post-translational factors activities [58]. It was seen in the current study that high fructose induced lipogenesis by increasing SREBP-1c-stimulatation in muscle tissues. With high fructose diets, SREBP-1c gene and protein may show activity in many tissues without insulin requirements [59,60].
Chronic consumption of fructose can lead to metabolic disorders such as insulin resistance, hypertriglyceridemia, and hypertension [61]. The fact that long-term consumption of high-energy diets deteriorates glucose regulation has been identified in a number of studies [62,63]. Depending on the diet, insulin mechanisms are continuously activated by glucose and trigger lipogenesis. In Hfru group, detected high plasma glucose and triglyceride concentration confirmed that fructose triggered lipogenesis (Tables 6 and 7 and Fig. 4g, h). Hfru group plasma glucose results were found to be the same as many other studies [62–64]. On the other hand, there was no difference in plasma insulin levels among the experimental groups. Although animals were hyperglycemic in Hfru group, it is thought that the reason of similar amount of insulin may have been be related to the percentage of fructose in diet and the feeding period.
Plasma cholesterol levels can vary depending on diet ingredients. Nevertheless, the results have been found to be compatible with similar studies in which plasma cholesterol levels of rats exposed to high-energy diets for 90 days did not significantly change during the study [56,65]. Plasma HDL and LDL results were similar to those found in the relevant literature [66–68]. It was observed in the study that carbohydrate content of diet was not as important as fat content for HDL and LDL regulation. But the amount of energy sources could affect these parameters and insulin resistance, diabetes and other metabolic disorders begin with hyperlipidemia [69,70]. Plasma triglycerides were significantly higher in Hfru group and it confirmed that fructose was hyperlipidemic.
AST and ALT may be within limits, even if pathology develops in liver. It was reported in a study that fructose-fed rats had lower AST and ALT values than control animals [71]. But, the ratio of AST and ALT levels may be a more decisive criterion to have an idea of liver damage while investigating the effects of diets on the liver. It is reported that in humans, this ratio is greater than 2 with alcohol-induced liver damage [72]. Also, some studies show that consumption of high fructose led to an increase in AST/ALT ratio [73,74]. In this study, AST/ALT ratio was the highest in Hsuc and Hfru groups. However, there was no significant difference between the Hsuc, Con and Hfat groups (Table 6). Hfru group's AST/ALT ratio had the highest value. Therefore, it was observed that AST/ALT ratio may be a determining criterion for detecting damage to the liver due to high energy intake. This was also confirmed by the histopathological findings of the study. There was no significant change in plasma GGT levels due to high energy intake for 90 days.
In the present study, correlations between protein and biochemical parameters showed that dietary carbohydrate levels significantly effect the metabolic activity in liver and also skeletal muscle at molecular levels. Biochemical markers in plasma may give important information about liver physiology via ChREBP and LXRα activities. LXRα, ChREBP and SREBP-1c proteins activities in skeletal muscle were found significantly correlated with AST/ALT ratio. The correlation between these proteins and biochemical markers suggests an idea of metabolic activity and physiology of muscle tissue. This means liver health and skeletal muscle metabolism closely related. Some of the biochemical parameters (glucose, LDL, triglyseride) in plasma give information about protein levels of SREBP-1c in skeletal muscle. Thus, it is possible to have an idea about skeletal muscle metabolic activity.
Liver weights in Hfru group were significantly higher than the liver weights in the other experimental groups, possibly due to fat deposition of liver. Fatty liver and degeneration of hepatocytes were detected in Hsuc group, but it was better than Hfru. The reason for this was the rate of sucrose used in diet and the feeding period. On the other hand, Haubert et al. detected microscopically severe degeneration with fatness in liver in rats fed with a diet containing 70% sucrose [75]. These results show that the rate of sucrose in diets is also important for metabolism related diseases. Ackerman et al. claimed that compared to sucrose, fructose has negative effects on fatty liver that are stronger and speedier and causes degeneration of hepatocytes [76]. Also, Vilà et al. found that consumption of 10% fructose solution in addition to normal diet for just 2 weeks caused necrotic areas in the liver in Sprague-Dawley rats [50]. It was microscopically determined that the rats in Hfru group had the most damaged livers. The most severe form of degeneration, balloon degeneration, was clearly identified in the Hfru group and fattening of liver in this group was more severe than others. Sucrose and fructose have been found to cause significant inflammation as well as destructive effects in hepatocytes. This may make liver tissue more susceptible to secondary bacterial infections and increase oxidative damage. A common finding in the experimental groups (Hfat, Hsuc and Hfru) was the stagnation of erythrocytes in the central veins and sinusoidal regions. It is thought that degenerative and necrotic changes in hepatocytes may cause the foreground by forming an anoxic and hypoxic environment in liver tissue.
5ConclusionThis study found that fructose triggers lipogenesis more than sucrose and sunflower oil. This is thought to be due to the fact that fructose consumption does not particularly affect insulin secretion. Results have showed that fatty liver disease and related complications can be caused by using 27% fructose solution beside normal diets in rats in 90 days. Furthermore, the feeding period can be shortened by using high concentration fructose solution for metabolic disorder model studies.
LXRα and SREBP-1c are important molecular markers for lipogenesis in both liver and muscle tissue. The activities of SREBP-1c in these tissues are closely related to biochemical parameters as triglyceride production and body weight changes with lipogenesis. It has been understood that the relationship between ChREBP and lipogenesis needs to be further investigated depending on the feeding with fructose. Further studies are needed to understand the relationship between ChREBP and PPARα in muscle tissue. SREBP-1c is a transcription factor on lipogenesis pathway and can be activated by many energy sources, but checking protein levels of this transcription factor is more important than gene expression levels. On the other hand, AST/ALT can be used as a more specific parameter for diagnosis about liver pathology and therefore this ratio may be evaluated together with other parameters.
As a result, it can be said that fructose triggers lipogenesis, weight gain and metabolic disorders more and therefore it is metabolically more dangerous than sucrose and sunflower oil as energy resourcesAbbreviationsHFCS High Fructose Corn Syrup Peroxisome Proliferator Activated Receptor alpha Liver X Receptor alpha Carbohydrate Response Element Binding Protein Sterol Regulatory Element Binding Protein 1c Musculus Gluteus Ribosomal RNA Complementer DNA Micro RNA Peptidylprolyl isomerase A High Density Lipoprotein Low Density Lipoprotein Gamma-Glutamyl Transferase Aspartate Aminotransferase Alanine Aminotransferase
This research was funded by Scientific Research Council of Hatay Mustafa Kemal University with 16380 project number.
Conflict of interestThe authors have no conflicts of interest to declare.
The manuscript is part of a PhD thesis of Hatay Mustafa Kemal University.


