
The first wave of the SARS-CoV-2 pandemic exerted enormous stress on the healthcare system. Community of Madrid hospitals responded by restructuring and scaling their capacity to adapt to the high demand for care.
MethodsThis was a retrospective observational study conducted between 18 March and 21 June 2020 with data from public and private hospitals in CoM, Spain. Absolute and relative frequencies were calculated for inpatients with and without COVID-19, available and occupied beds in intensive care unit (ICU) and non-ICU wards, daily new admissions (NA), individuals awaiting hospitalisation in the emergency department (ED), and discharges.
ResultsCompared to pre-pandemic years, during the maximum care pressure period (18 March–17 April 2020), the average number of total available and occupied beds increased by 27% and 36%, respectively. Also, the average number of available and occupied ICU beds increased by 174% and 257% respectively, and average occupancy was 81%. The average daily NAs were 1,503 (90% from the ED) and 949 (63% due to COVID-19), and of these, 61 (6.4%) were admitted to the ICU. On average, at 6:00p.m., 1112 patients were waiting in the ED to be admitted and 299 (26.8%) patients waited for more than 24h. Discharges due to death for COVID-19 inpatients in the non-ICU and ICU wards were 16% and 36%, respectively.
ConclusionsThis study confirmed the critical role of the ICU and ED, especially in the care of patients before being hospitalizated, in pandemic or health crisis scenarios.
La primera ola producida por SARS-CoV-2 ejerció mucha presión sobre el sistema sanitario. Los hospitales de la Comunidad de Madrid reestructuraron sus espacios y aumentaron su capacidad para atender la alta demanda asistencial.
MétodosEstudio observacional retrospectivo realizado entre el 18 de marzo y el 21 de junio de 2020, con datos de hospitales públicos y privados. Se calculan las frecuencias absolutas y relativas de pacientes hospitalizados con y sin COVID-19, camas disponibles y ocupadas en la unidad de cuidados intensivos (UCI) y no UCI (NUCI), de nuevos ingresos (NI) diarios, de pacientes en espera de ingreso en el servicio de urgencias (SU) y de las altas.
ResultadosCon respecto al período prepandemia, entre el 18 de marzo y 17 de abril de 2020 (período de máxima presión hospitalaria), el promedio de camas disponibles y ocupadas aumentó un 27% y 36%, respectivamente. Así mismo, las camas UCI crecieron un 174% y un 257%, respectivamente, con una ocupación media del 81%. La media diaria de NI fue de 1.503 (90% desde SU), y 949 (63%) por COVID-19, de los cuales 61 (6,4%) ingresaron en UCI. De media, a las 18:00 horas, 1.112 pacientes esperaban en SU para ingresar y 299 (26,8%) superaban las 24 horas de espera. Los fallecimientos en hospitalizados por COVID-19 en NUCI y UCI fueron del 16% y del 36%.
ConclusionesEste estudio reafirma el papel crítico de las UCI y los SU, especialmente atendiendo a los pacientes hasta su hospitalización, en situaciones de pandemia u otras crisis sanitarias.
Health crises such as pandemics and natural or human-made disasters lead to a sudden and unexpected increased demand for care in hospitals. Thus, for example, seasonal influenza, in 2018, accounted for more than 27.7 million medical visits, 959,000 hospitalisations, and 79,400 deaths in the US1; between 2011 and 2018, health systems and the people who depend on them suffered the consequences of the 1483 epidemic events tracked by the World Health Organization in 172 countries2; and Fukushima (Japan), in 2011, was struck by a triple disaster: an earthquake, tsunamis, and a nuclear accident.3
The limited ability of hospitals to cope with an unexpected and endless demand for care leads to a decrease in the quality of patient care,4–6 which contributes to heightened rates of nosocomial infections and patient mortality.7,8 This clinical knowledge has led to the development of a few models with the aim of providing useful information to adapt hospital facilities in case of epidemic outbreaks or catastrophic events.9,10 These models can play a crucial role in managing future pandemic waves. However, to build such models, robust data on the use of intensive care unit (ICU) and non-intensive care unit (non-ICU) beds is needed. Several articles have been published with data or proposals for structural improvements in Italy,10,11 Germany,12,13 and Sweden,14 trying to provide the medical community and policymakers with insights on dealing with hospital pressure in a pandemic situation.
On 31 March 2020, Community of Madrid (CoM) hospitals were running at overcapacity, as reflected by the high number of patients hospitalised due to coronavirus disease (COVID-19) in ICUs and non-ICUs (Table 1). On 4 May 2020, when the curve was flattened, the CoM had accumulated 61,577 cases of COVID-19, standing for 29.17% of the total cases recorded in Spain (211,077).15
Comparative assessment profile of occupancy and incidence rates on 31 March 2020.
| Region/country | 14-Day cumulative incidence of cases16 | Deaths per 100,000 habitants16 | Occupied ICU beds17 | Occupied ICU beds per 100,000 habitants | Occupied non-ICU beds17 | Occupied non-ICU beds per 100,000 habitants |
|---|---|---|---|---|---|---|
| Community of Madrid | 363.22 | 57.7 | 1,514 | 22.3 | 13,713 | 202.3 |
| Spain | 192.3 | 17.3 | 5,872 | 12.4 | 45,546 | 96.2 |
| Italy | 122.2 | 13.4 | 4,023 | 6.7 | 32,215 | 53.3 |
| France | 56.6 | 6.2 | 5,496 | 8.5 | 22,672 | 35.1 |
| Belgium | 103 | 14.8 | 1,088 | 9.4 | 4,989 | 43.2 |
ICU: intensive care unit.
Given the impact of the first wave of the severe acute respiratory syndrome coronavirus 2 (SARS-CoV-2) pandemic in CoM hospitals and the limited publications that exist in this regard, the current paper aims to describe how structure and capacity in CoM hospitals were impacted during the first wave of COVID-19 pandemic. It highlights how hospitals ensured the safety of patients and staff, the measures in the form of escalation of ICU and non-ICU beds in response to the unceasing arrival of patients at the hospitals.
Material and methodsSettingThe study was conducted in private and public CoM hospitals. The Spanish National Health System (Sistema Nacional de Salud [SNS]) is decentralised, with autonomous communities responsible for the day-to-day administration and provision of healthcare in each region. The CoM has 6.7 million inhabitants.18 Its public health system (Servicio Madrileño de Salud [SERMAS]) has 34 hospitals with various levels of complexity and a total of 12,770 available hospital beds.19 During the first wave of the pandemic, 41 private hospitals were involved in dealing with the health crisis, supplying 5280 extra beds. Therefore, based on the latest official data, it can be assumed that, at the beginning of March 2020, the base capacity of the CoM's public and private hospitals was approximately 18,050 available hospital beds (AHB): 700 ICU beds and 17,350 non-ICU beds.20 Of note, the annual average occupancy rates of AHB and ICU beds, in previous years, were 80%9 and 62%,21 respectively. Hence, the average number of beds occupied daily, if the COVID-19 pandemic had not existed, would have been 14,440 and 434 beds for non-ICU and ICU wards respectively. The daily average of new admissions (NA) in CoM public hospitals, in 2018 and 2019, was 1440, 67% from the emergency department.22 A field hospital was deployed in the building of Institución Ferial de Madrid (IFEMA)23,24 convention centre, opened on 22 March 2020, and was fully operative by 3 April 2020. This field hospital supplied 1150 more non-ICU beds and 10 ICU beds.
Data sourcesThe data analysed in this paper came from the daily information that SERMAS and hospitals sent in the digital format to the COVID-19 Control Centre (CCC). On 13 March 2020, the CCC was created25 by the CoM Government due to the rapid emergency generated by SARS-CoV-2. CCC, after processing, debugging, and analysing the information using business intelligence tools, generated a dashboard and a report on the global situation and on each of the hospitals that were mailed daily. Decision-making was not part of their tasks. The data analysed on the origin of the new admissions (urgent versus scheduled), as well as those related to the number of patients who were waiting in the ED to be hospitalised, came exclusively from public hospitals.
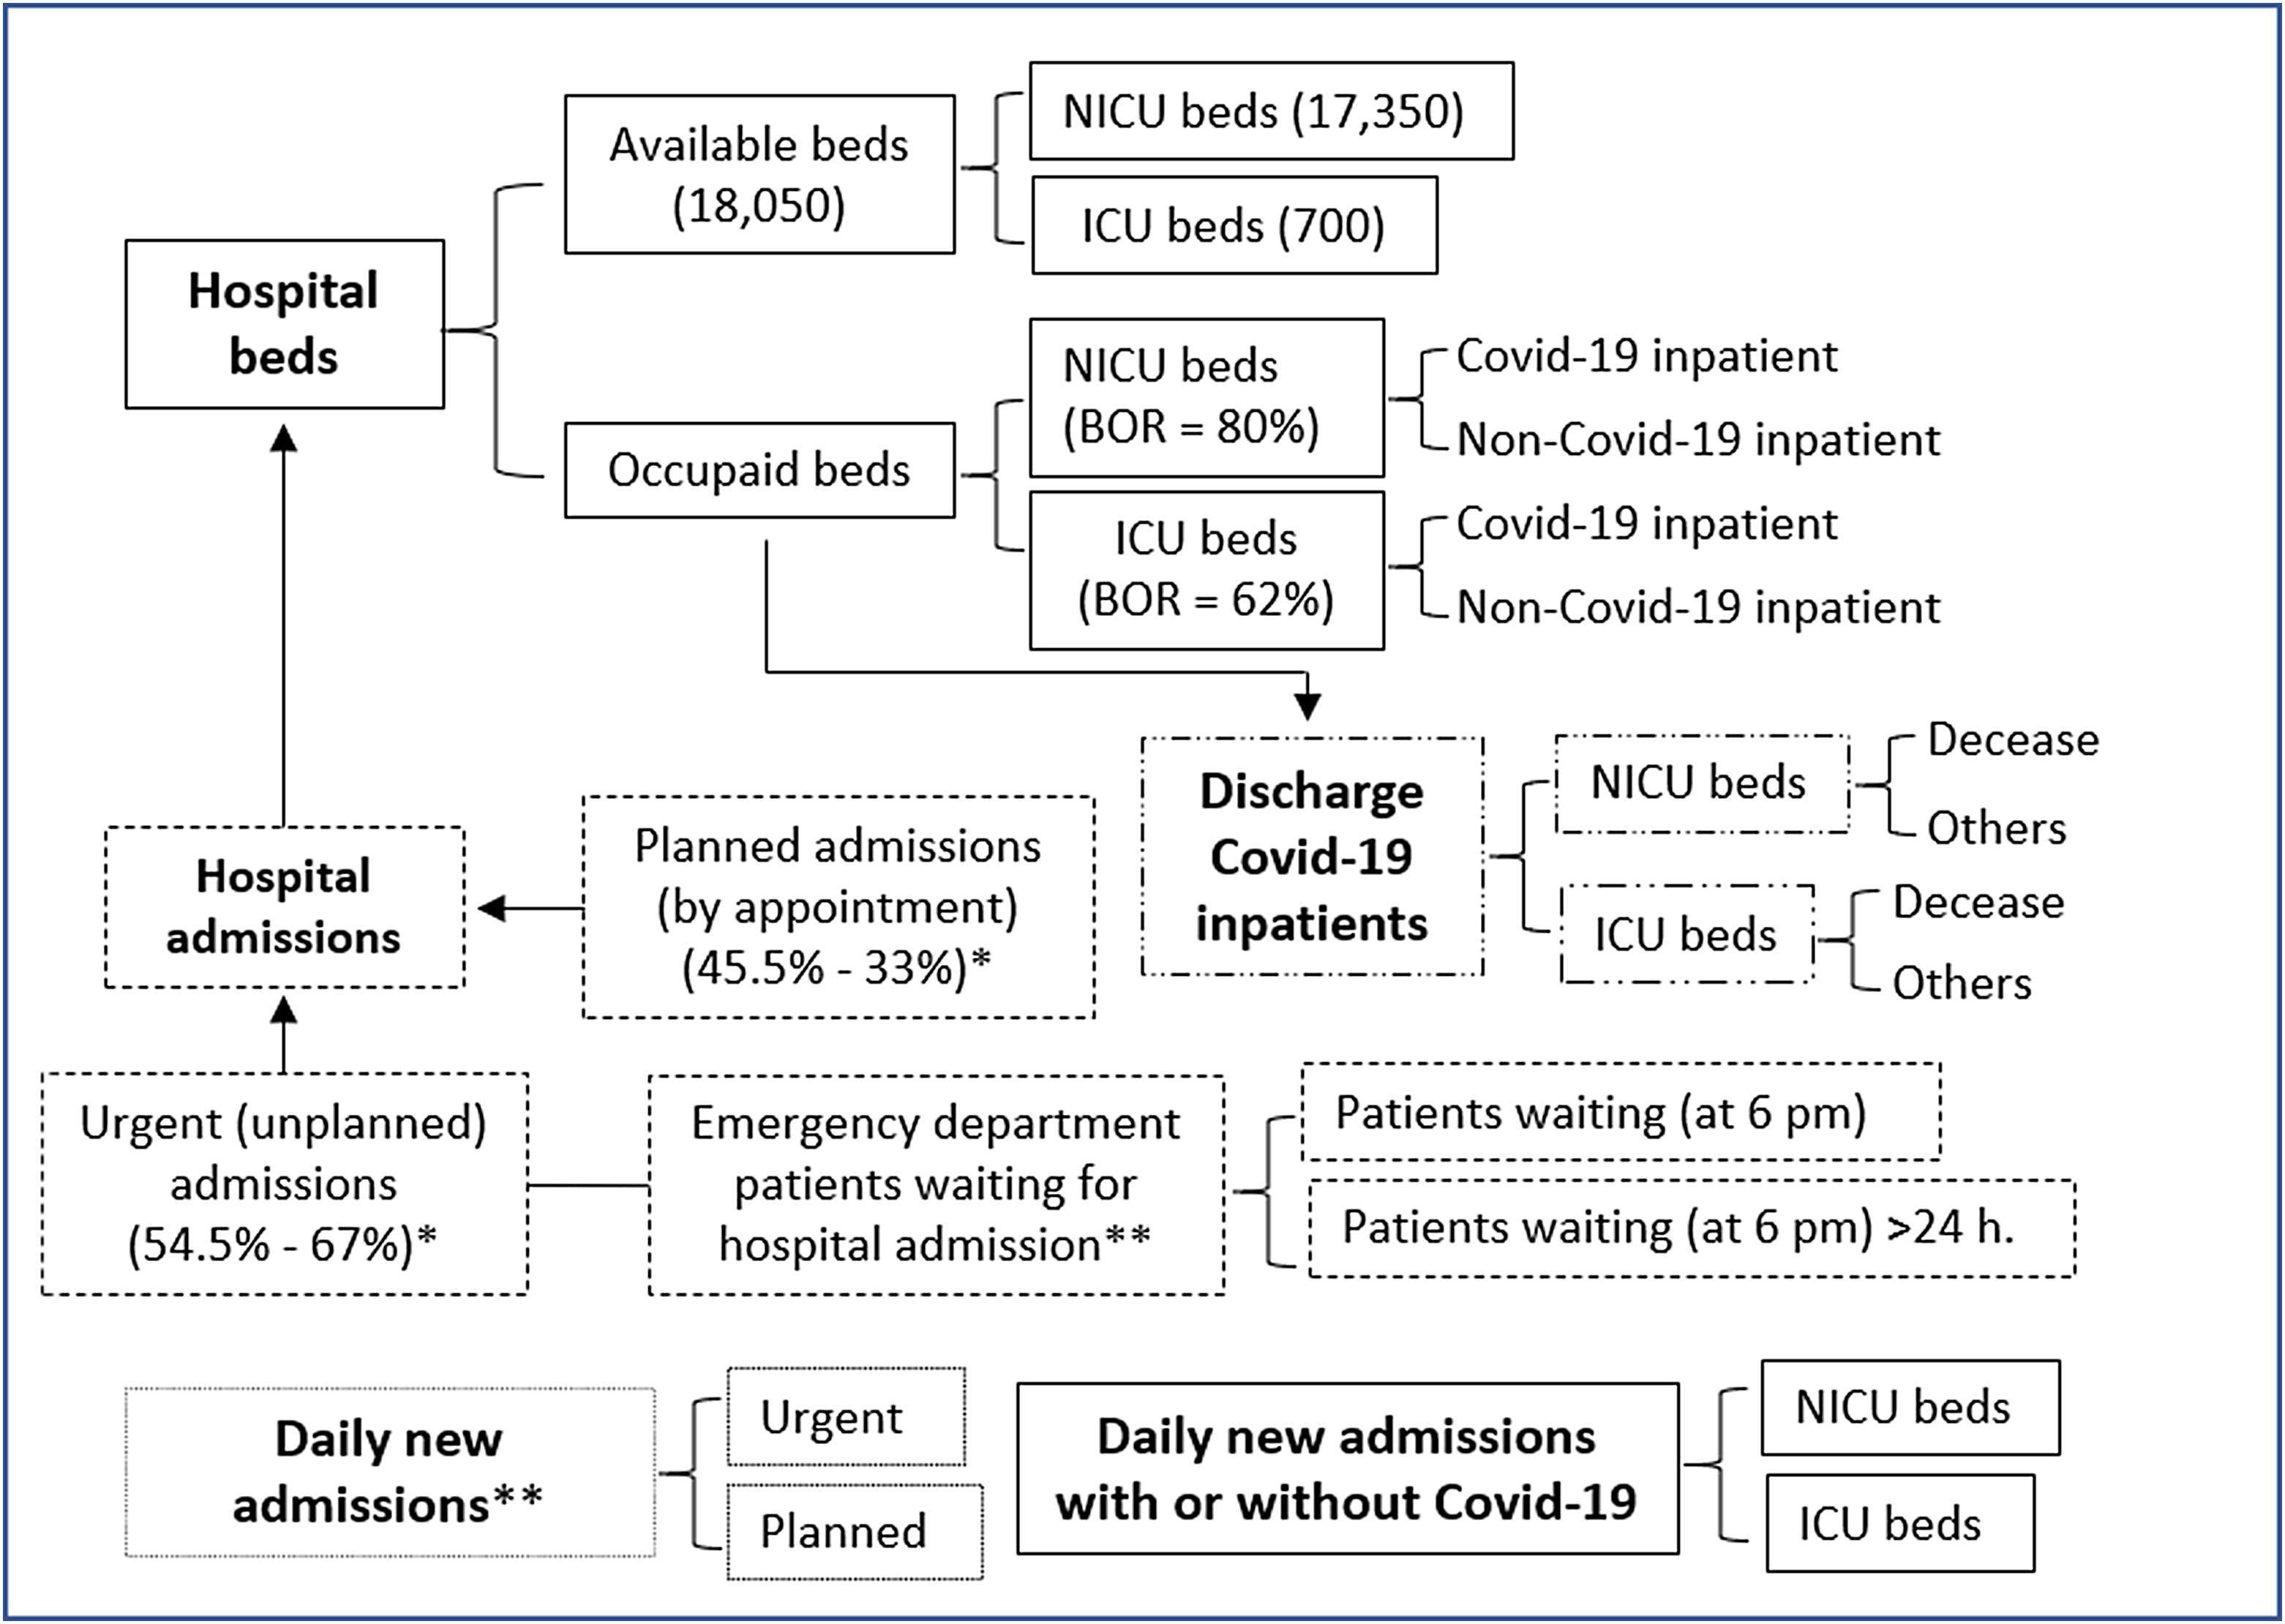
DesignWe conducted a retrospective, observational study based on anonymous information collected in the CCC between 18 March and 21 June 2020, an interval of time referred to as the “analysed period”. The CCC received daily information from public (N=34) and private (N=41) hospitals structured according to the categories shown in Fig. 1. Beds were classified into two broad categories: “available”, those with the necessary equipment and staff to fulfil their function, and “occupied”. According to their function, beds were classified as ICU beds and non-ICU beds. And finally, a distinction was made between patients with or without COVID-19. The last division did not apply to patients waiting (PW) in the ED to be hospitalised, since the hospitals only reported on the total of individuals pending admission at 6:00p.m., and those who waited longer 24h. Daily discharge figures were also described.
 beds=all dedicated intensive care beds regardless of location. NICU (non-ICU)=all beds dedicated to non-critical inpatients. Covid-19 inpatient=patients hospitalised for Covid-19. Non-Covid-19 inpatient=patients hospitalised for a pathology other than Covid-19. BOR=Bed occupancy rate. (*) Before the pandemic, in CoM hospitals, the emergency admissions rate was 54.5%; in public hospitals, 67%. (**) Our data about daily new admissions did not distinguish between patients with or without Covid-19, this classification was carried out at the time of hospitalization.")
Organization and capacity of CoM hospitals to manage patients with or without Covid-19 during the first wave of the Covid-19 pandemic. The figures in parentheses represent the average values recorded before the pandemic started. Available bed=bed with the necessary equipment and staff to fulfill its function. ICU (intensive care unit) beds=all dedicated intensive care beds regardless of location. NICU (non-ICU)=all beds dedicated to non-critical inpatients. Covid-19 inpatient=patients hospitalised for Covid-19. Non-Covid-19 inpatient=patients hospitalised for a pathology other than Covid-19. BOR=Bed occupancy rate. (*) Before the pandemic, in CoM hospitals, the emergency admissions rate was 54.5%; in public hospitals, 67%. (**) Our data about daily new admissions did not distinguish between patients with or without Covid-19, this classification was carried out at the time of hospitalization.
Based on the information reported to the CCC, the variables are described making use of means and absolute and relative frequencies. Given this was a descriptive study, no inferential statistics were calculated.
EthicsData did not include personal identifiers or any information regarding patient health status. For the preparation of this article, we have followed the guidelines of Ethics in publication and have the approval of the Clinical Research Ethics Committee (CREC) of Hospital Clínico San Carlos, 28040-Madrid, Spain (code: 21/198).
ResultsAs of 18 March 2020, for COVID-19, there were 6,777 reported cumulative cases (39.5% of Spain), with a cumulative incidence in the last 14 days of 100.35 (35.96 in Spain); 498 deaths (65% of Spain); 590 patients hospitalised in ICU (63% of Spain); and an increase in infections of 20% compared to the previous day (25% in Spain).
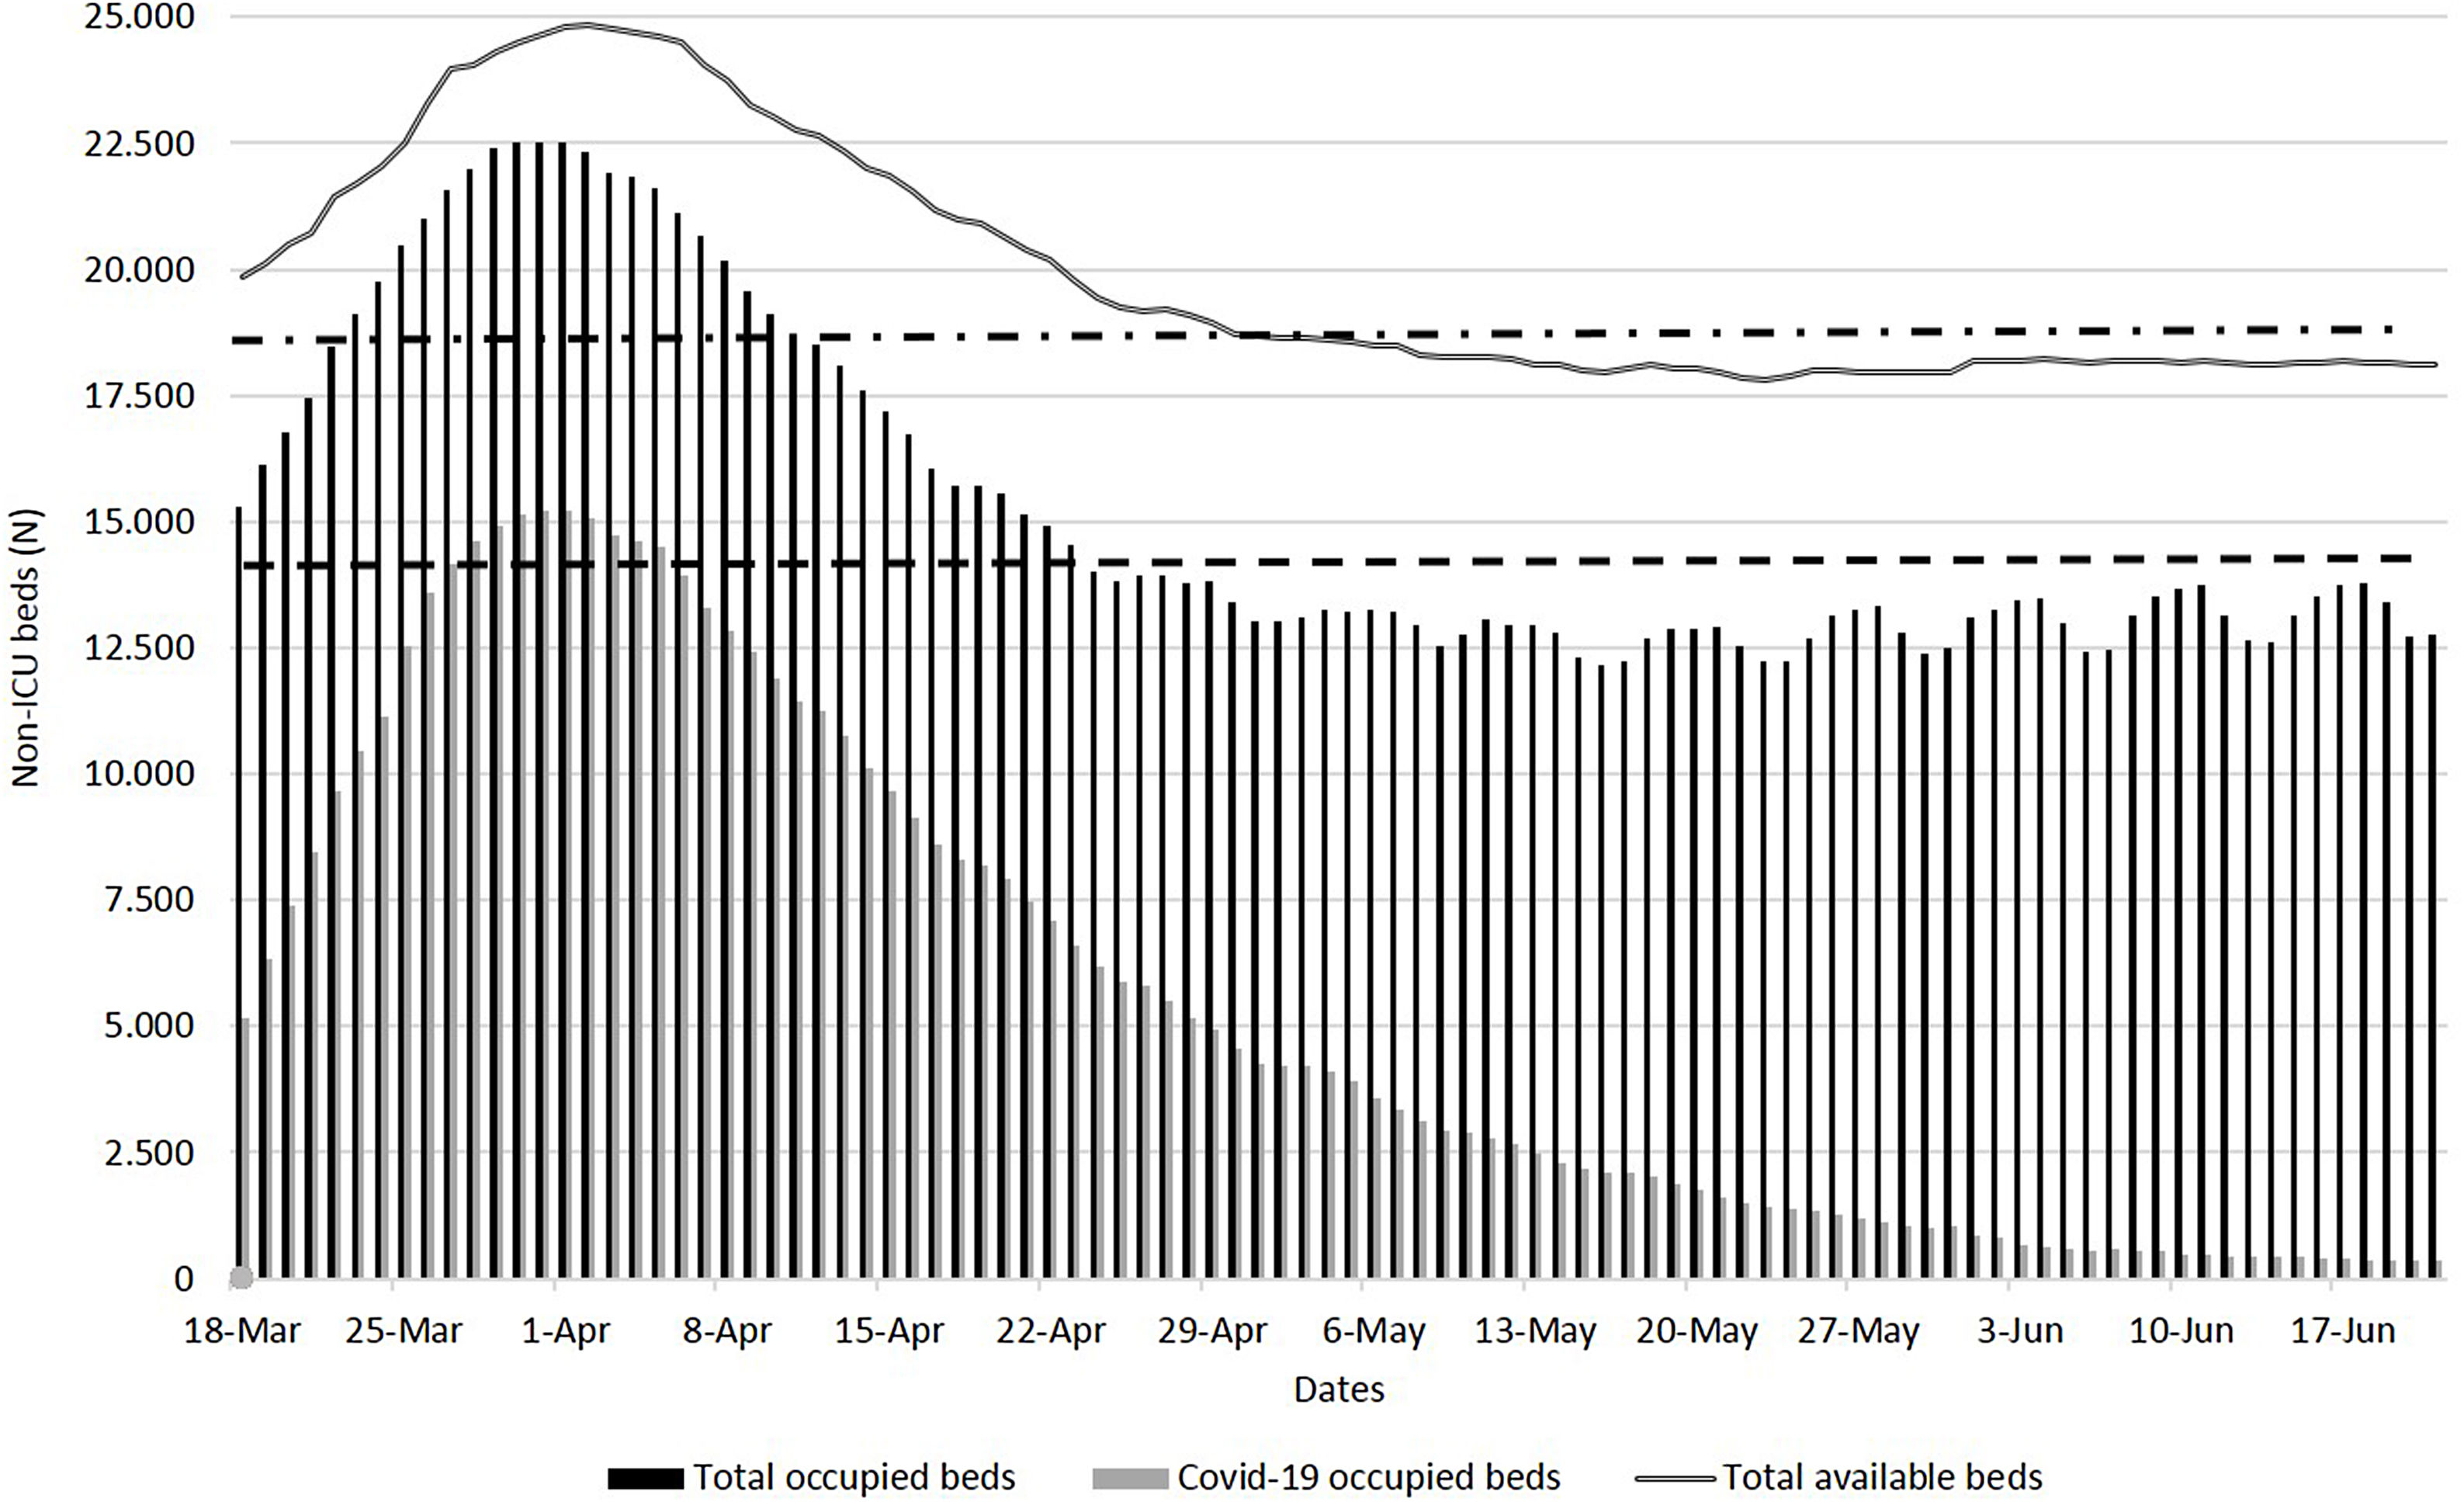
The escalation and de-escalation of beds (AHB, non-ICU, and ICU) and their occupation with or without COVID-19 inpatients, during the period analysed, are described in Figs. 2 and 3.
. Lower dashed line: daily average occupied beds before the pandemic (14,440).")
Total available and occupied beds in CoM hospitals, between 18 March and 21 June 2020. Black line: total available beds. Black bars: total beds occupied by inpatients with and without Covid-19. Grey bars: total beds occupied by Covid-19 inpatients. Upper dashed line: total available beds before the pandemic (18,050). Lower dashed line: daily average occupied beds before the pandemic (14,440).
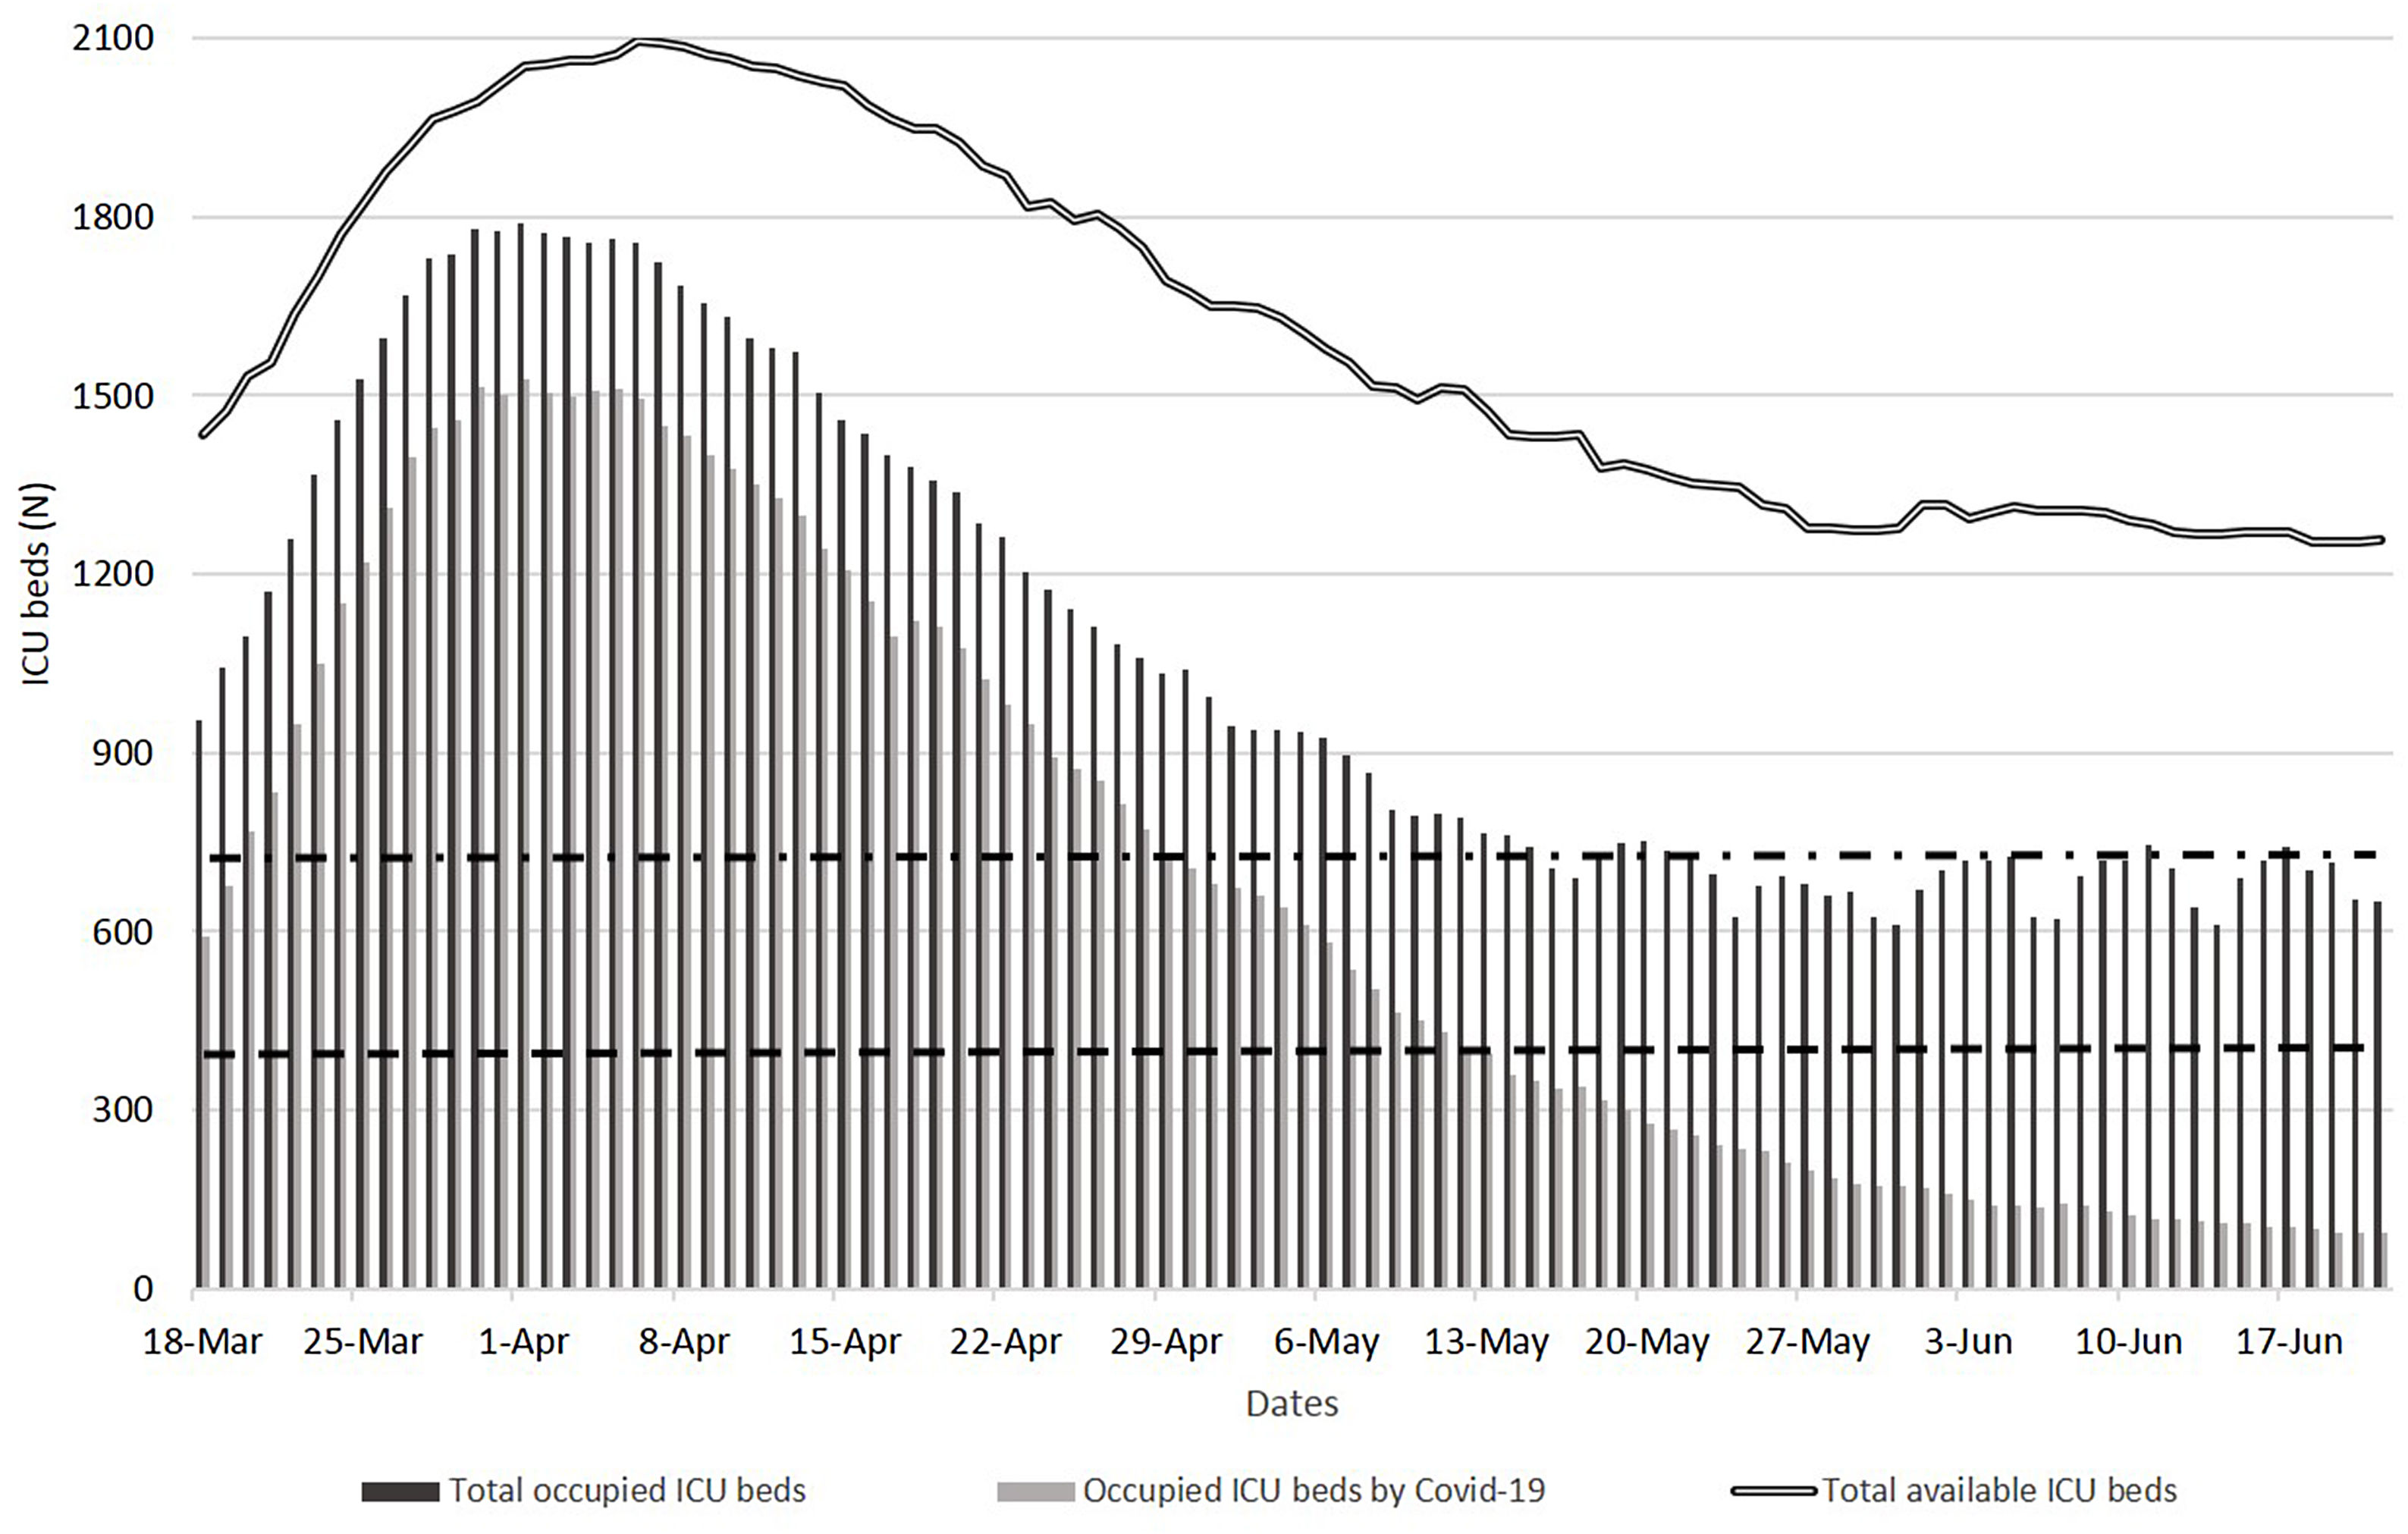
 before the pandemic. Lower dashed line: daily average occupied ICU beds (434) before the pandemic.")
Total available and occupied ICU beds in CoM hospitals, between 18 March and 21 June 2020. Black line: total available ICU beds. Black bars: ICU beds occupied by inpatients with and without Covid-19. Grey bars: occupied ICU beds by Covid-19 inpatients. Upper dashed line: total available ICU beds (700) before the pandemic. Lower dashed line: daily average occupied ICU beds (434) before the pandemic.
The daily breakdown of total non-ICU and ICU bed occupancy (COVID-19 and non-COVID-19) is detailed in Table 1 of the supplementary material.
On 2 April 2020, the AHB reached the highest value (24,823 beds), and, on 31 March 2020, the maximum occupation (22,526 beds) – indicating an increment of 25% and 47% of beds in comparison to 18 March 2020. The highest percentage (92%) of occupied AHB occurred on 29 March 2020. Looking at the period with the extreme healthcare pressure in CoM hospitals (18 March to 17 April 2020; maximum care pressure period), the average number of AHB and occupied beds, compared to pre-pandemic years, increased by 27% and 36%, respectively.
On 6 April 2020, the maximum number of available ICU beds (2,096) was reached, and the highest number of occupied ICU beds (1,789) reached on 1 April 2020. The highest occupancy of ICU beds (89%) occurred on 30 March 2020. From 18 March to 17 April 2020, the average daily number of available (1,921) and occupied (1,549) ICU beds increased by 174% and 257%, respectively, compared to pre-pandemic figures. The daily average occupancy of ICU beds was 81%.
On 2 April 2020, the maximum number of available non-ICU beds (22,766) was reached, and the highest occupancy of ICU beds (20,748) was observed on 31 March 2020. The highest percentage of occupied non-ICU beds (92%) occurred on 25 March 2020. Between 18 March and 17 April 2020, the average daily number of available (20,990) and occupied (18,096) non-ICU beds increased by 21% and 30.4%, respectively, compared to the pre-pandemic years.
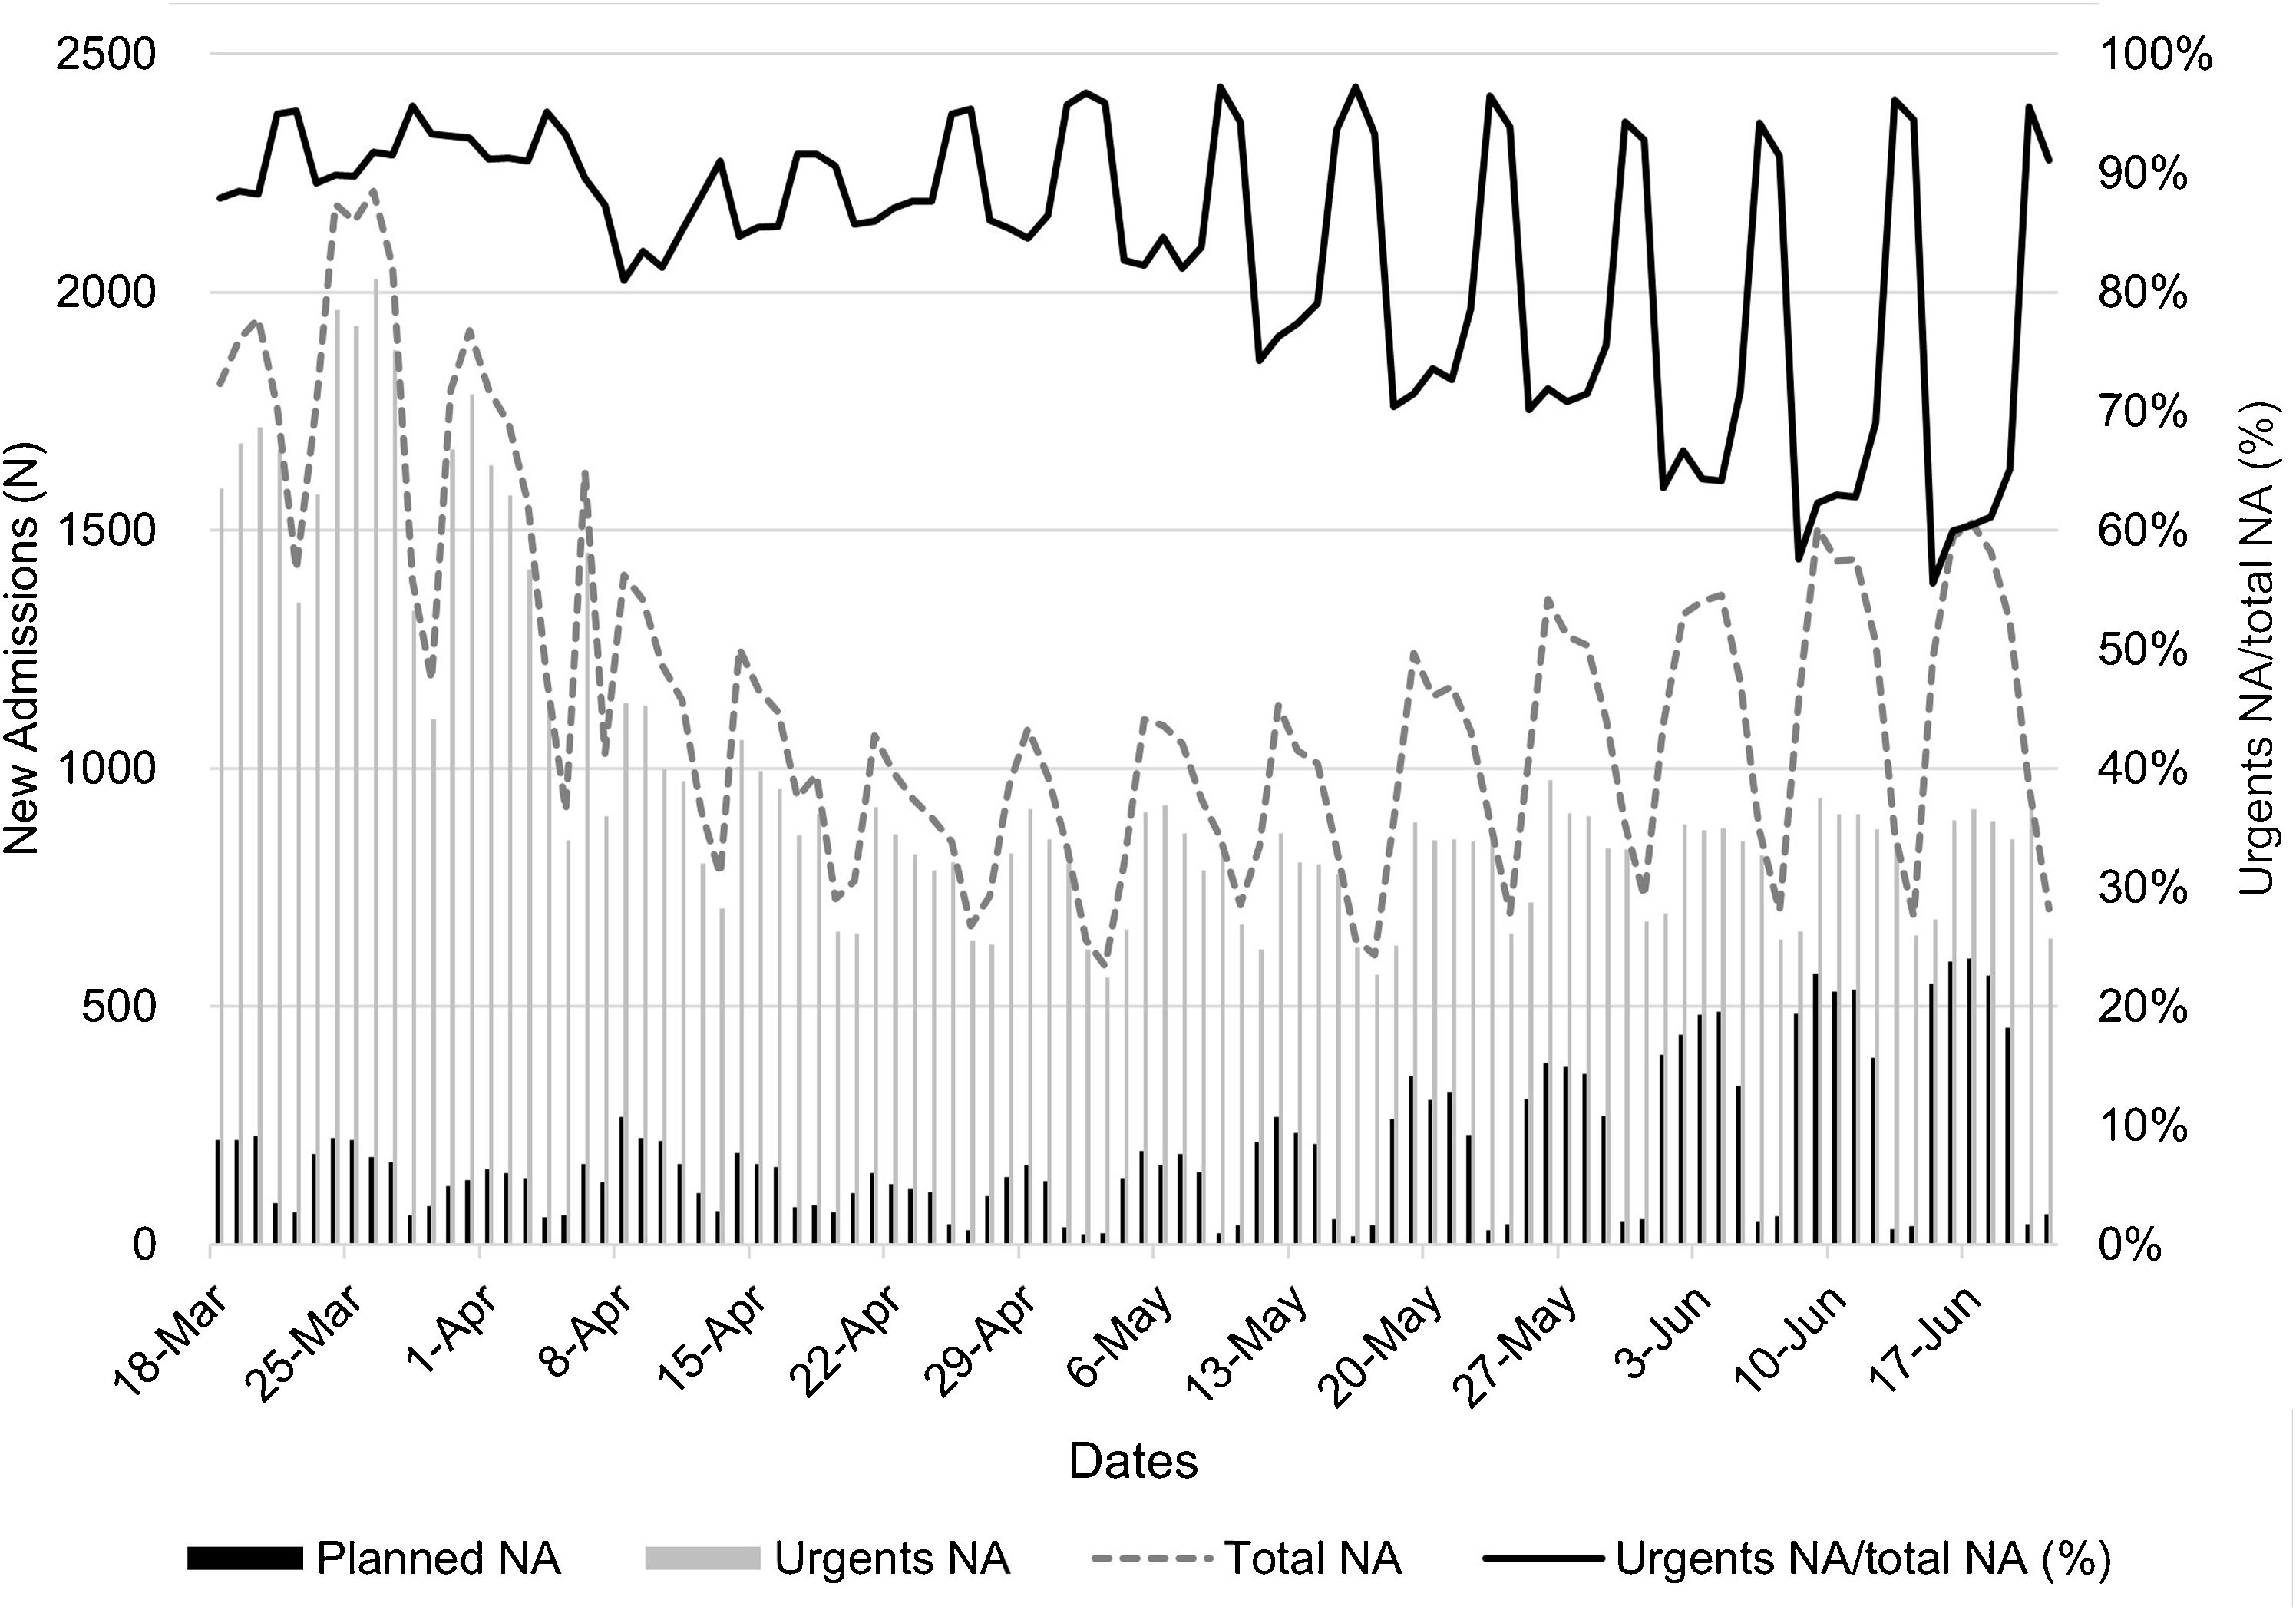
During the period analysed, of all the NA in public hospitals (112,553), 93,350 (83%) came from the ED and 34,861 (31%) were COVID-19 patients; of these, 7% (2482) were admitted to ICU (Fig. 4). In maximum care pressure period, the average daily NA was 1503 (90% from the ED) and 949 (63%) due to Covid-19; of these, 61 (6.4%) were admitted to ICU. The total planned and urgent daily NA and daily NA for COVID-19 to non-ICUB and ICUB in CoM hospitals is detailed in Table 2 of the supplementary material. Public and private hospitals registered a total of 44,098 NA for COVID-19, of which 3046 (6.9%) were admitted to ICU. Private hospitals admitted a total of 9237 patients with Covid-19, 564 (6.1%) of them in the ICU.
 in CoM public hospitals, between 18 March and 21 June 2020. Black line (left axis)=daily new admitted (NA) patients. Dashed grey line (right axis)=percentage of urgent NA with respect to the total NA. Grey bars=urgent NA. Black bars=planned NA.")
Evolution of daily NA for all pathologies (planned, urgent and total) in CoM public hospitals, between 18 March and 21 June 2020. Black line (left axis)=daily new admitted (NA) patients. Dashed grey line (right axis)=percentage of urgent NA with respect to the total NA. Grey bars=urgent NA. Black bars=planned NA.
Regarding the evolution of PW for a hospital bed (at 6:00 p.m.) in the ED of public hospitals and those that at that hour had been waiting for more than 24h (PW24), on 26 March 2020, there were 3329 PW and three days later there were 1200 PW24. The daily average of PW during the analysis period was 465, of which 110 (23.5%) had been waiting for more than 24h. During the maximum care pressure period, the average daily number of PW was 1112, and that of PW24, 299 (26.8%).
In the analysed period, for public and private hospitals, the number of discharges among inpatients with COVID-19 were 58,104, of which 8916 (15%) were due to death. In non-ICU, total discharges were 54,529, of which 7681 (14%) were due to death. While for the ICU, total discharges were 3575, of which 1235 (35%) were due to death. In maximum care pressure period, the total discharges in AHB (41,464), non-ICU (39,389), and ICU (2075). The discharges due to deaths in AHB, non-ICU and ICU were 17% (6871), 16% (6119), and 36% (752), respectively.
DiscussionHealth crises or emergencies have a marked impact on the 4S's of the healthcare system: staff (exhaustion and shortages of personnel), stuff (short supply of medical equipment, personal protective equipment, medicines, etc.), structure (transformation of previously non-clinical areas into spaces for inpatients), and strategy (surge plans for wards beds and spaces in the ED to face care demand). The aforesaid epigraphs explain why the increase in beds “to be occupied” has a limit. There is a point at which an additional increase in infrastructure is no longer possible, as reflected in a previous work.26 Thus, when, between 18 March and 17 April 2020, the average daily number of available and occupied ICU beds increased by 174% and 257%, respectively, in relation to pre-pandemic figures, the hospitals did not have another way out than postponing nonurgent care and scheduled appointments. They referred COVID-19 patients with mild clinical conditions and/or a difficult social situation to hotels with medical supervision; opened a large field hospital (IFEMA in Madrid or ExCel Convention Centre in London), etc. In Lombardy (the other epicentre of the COVID-19 pandemic), ICU beds grew from 900 to 1755 (95%).27 These notable escalations indicate that rising ICU admission rates and the increase of in at-risk population are the most important indicators used to watch the evolution of the epidemic, both at the regional and hospital levels.9,28
Given that there is information on the average daily occupancy of beds in CoM hospitals in 2019, the number of avoided hospitalisations can be easily deduced in the context of the pandemic. The reduction in hospital admissions for non-COVID-19 diseases, compared to previous years, opens a line of research on the possible deterioration caused to people's health due to the current pandemic. For example, in Spain, the number of organ transplants in 2020, compared to the previous year, fell by 21% (kidney), 20% (lung), 16% (liver), and 7% (heart).29
There are significant differences between emergency and scheduled hospital admissions, in terms of patient characteristics, use of hospital resources, and care planning.30 As is known, a pandemic does not give truces at weekends. It is striking, as seen in Fig. 4 (detailed data in Table 2, supplementary material), that in the toughest phases of the pandemic, the usual pattern of admissions was maintained, consisting of a rise at the beginning of the week to a collapse over the weekend. It cannot be ruled out that this pattern was in some way the consequence of inadequate data collection at weekends. On the other hand, scheduled admissions increased as the virulence of the first wave abated.
Also noteworthy is the number of PW in the ED to be hospitalised. There are two major determinants of ED overcrowding: a high number of seriously ill patients requiring immediate treatment and a low hospital capacity to admit them. In general, delays in admissions are due to five fundamental causes: percentage of occupied beds; time that elapses from the moment of discharge until the bed is ready to be occupied again; difficulty of evacuating patients from the hospital upon discharge; delays in registering discharges and communicating bed readiness to the ED. In the same way that a high occupancy of hospital beds reduces the ability of staff to provide high-quality care due to wear and fatigue, a jam in the flow of patients in the ED, too, reduces quality.31 In health crises, the saturation of the ED causes uncertainty in the staff and a constant adjustment of plans, as, for example, it must have happened on 26 March 2020, when there were 3329 PW to be hospitalised (at 6:00p.m.).
The key strengths of our study are the data used is first-hand since they were obtained from hospitals by the CCC. The information it provides is unprecedented and deals with how hospital admissions, emergency rooms, and inpatients with or without COVID-19 were handled during the first wave of the SARS-CoV-2 pandemic at CoM hospitals. The study also sheds light on the discharge numbers during the first wave of the SARS-CoV-2 pandemic. Another strength of this study is the relative simplicity of the analyses, and day to day pattern of various attributes.
Although the study data can project the situation of public and private hospitals that cooperated in the face the pandemic, we do acknowledge certain limitations of our study that concern the data set and our analysis. The data in the study gave a daily snapshot (at 6p.m.); and does not capture the nuances of hospitals performance. Notification artefacts may exist and there are data that, at the time of the current analysis, was missing, e.g., what percentage of individuals cared for in the ED were sick with COVID-19? What was the exact number of the available and occupied ICU and non-ICU beds at the beginning of March 2020? But these limitations are partly explicable in a situation as extreme and unprecedented as the first wave of the current SARS-CoV-2 pandemic.
ConclusionThe SARS-CoV-2 pandemic and, especially the first wave, was a stress test for the CoM health system, due to the enormous virulence it had in this European region. The hospitals attended to huge numbers of patients, and the 4S's (staff, supplies, structure, and strategy) of the healthcare system, faced great challenges. The data provided in this article highlight factors that have been key in the reorganisation that hospitals underwent to ensure the safety of inpatients and the staff who cared them, the astonishing speed with which hospitals scaled ICU beds, and the role that EDs played in providing care to patients until they could be admitted to wards. This knowledge is of great value for the design of contingency plans. Finally, this paper contains an intangible that cannot be ignored: the data presented raise questions that invite further research, especially those aimed at better understanding the aftermath of this pandemic in relation to the health of citizens.
FundingThis project has received assistance from “Actuaciones Coronavirus” (Community of Madrid, Spain), project number: 2020/000164.
Conflict of interestThe authors have no conflict of interests to declare.
The following are the supplementary data to this article: