


Introduction and aim. The impact of type of liver disease on parity rates hasn’t been described. Our aim was to assess the parity rates among women with CLD.
Material and methods. The National Health and Nutrition Examination Survey-III (19881994) data were used to identify adult female participants with a diagnosis of CLD. Participants were asked about their reproductive health status. Parity was defined as having at least one live birth. Hepatic ultrasound, serologic, medical examination and clinical data were available to determine the presence and type of CLD. Body mass index (kg/m2) was divided into 3 categories (< 30; 3035; 36+).
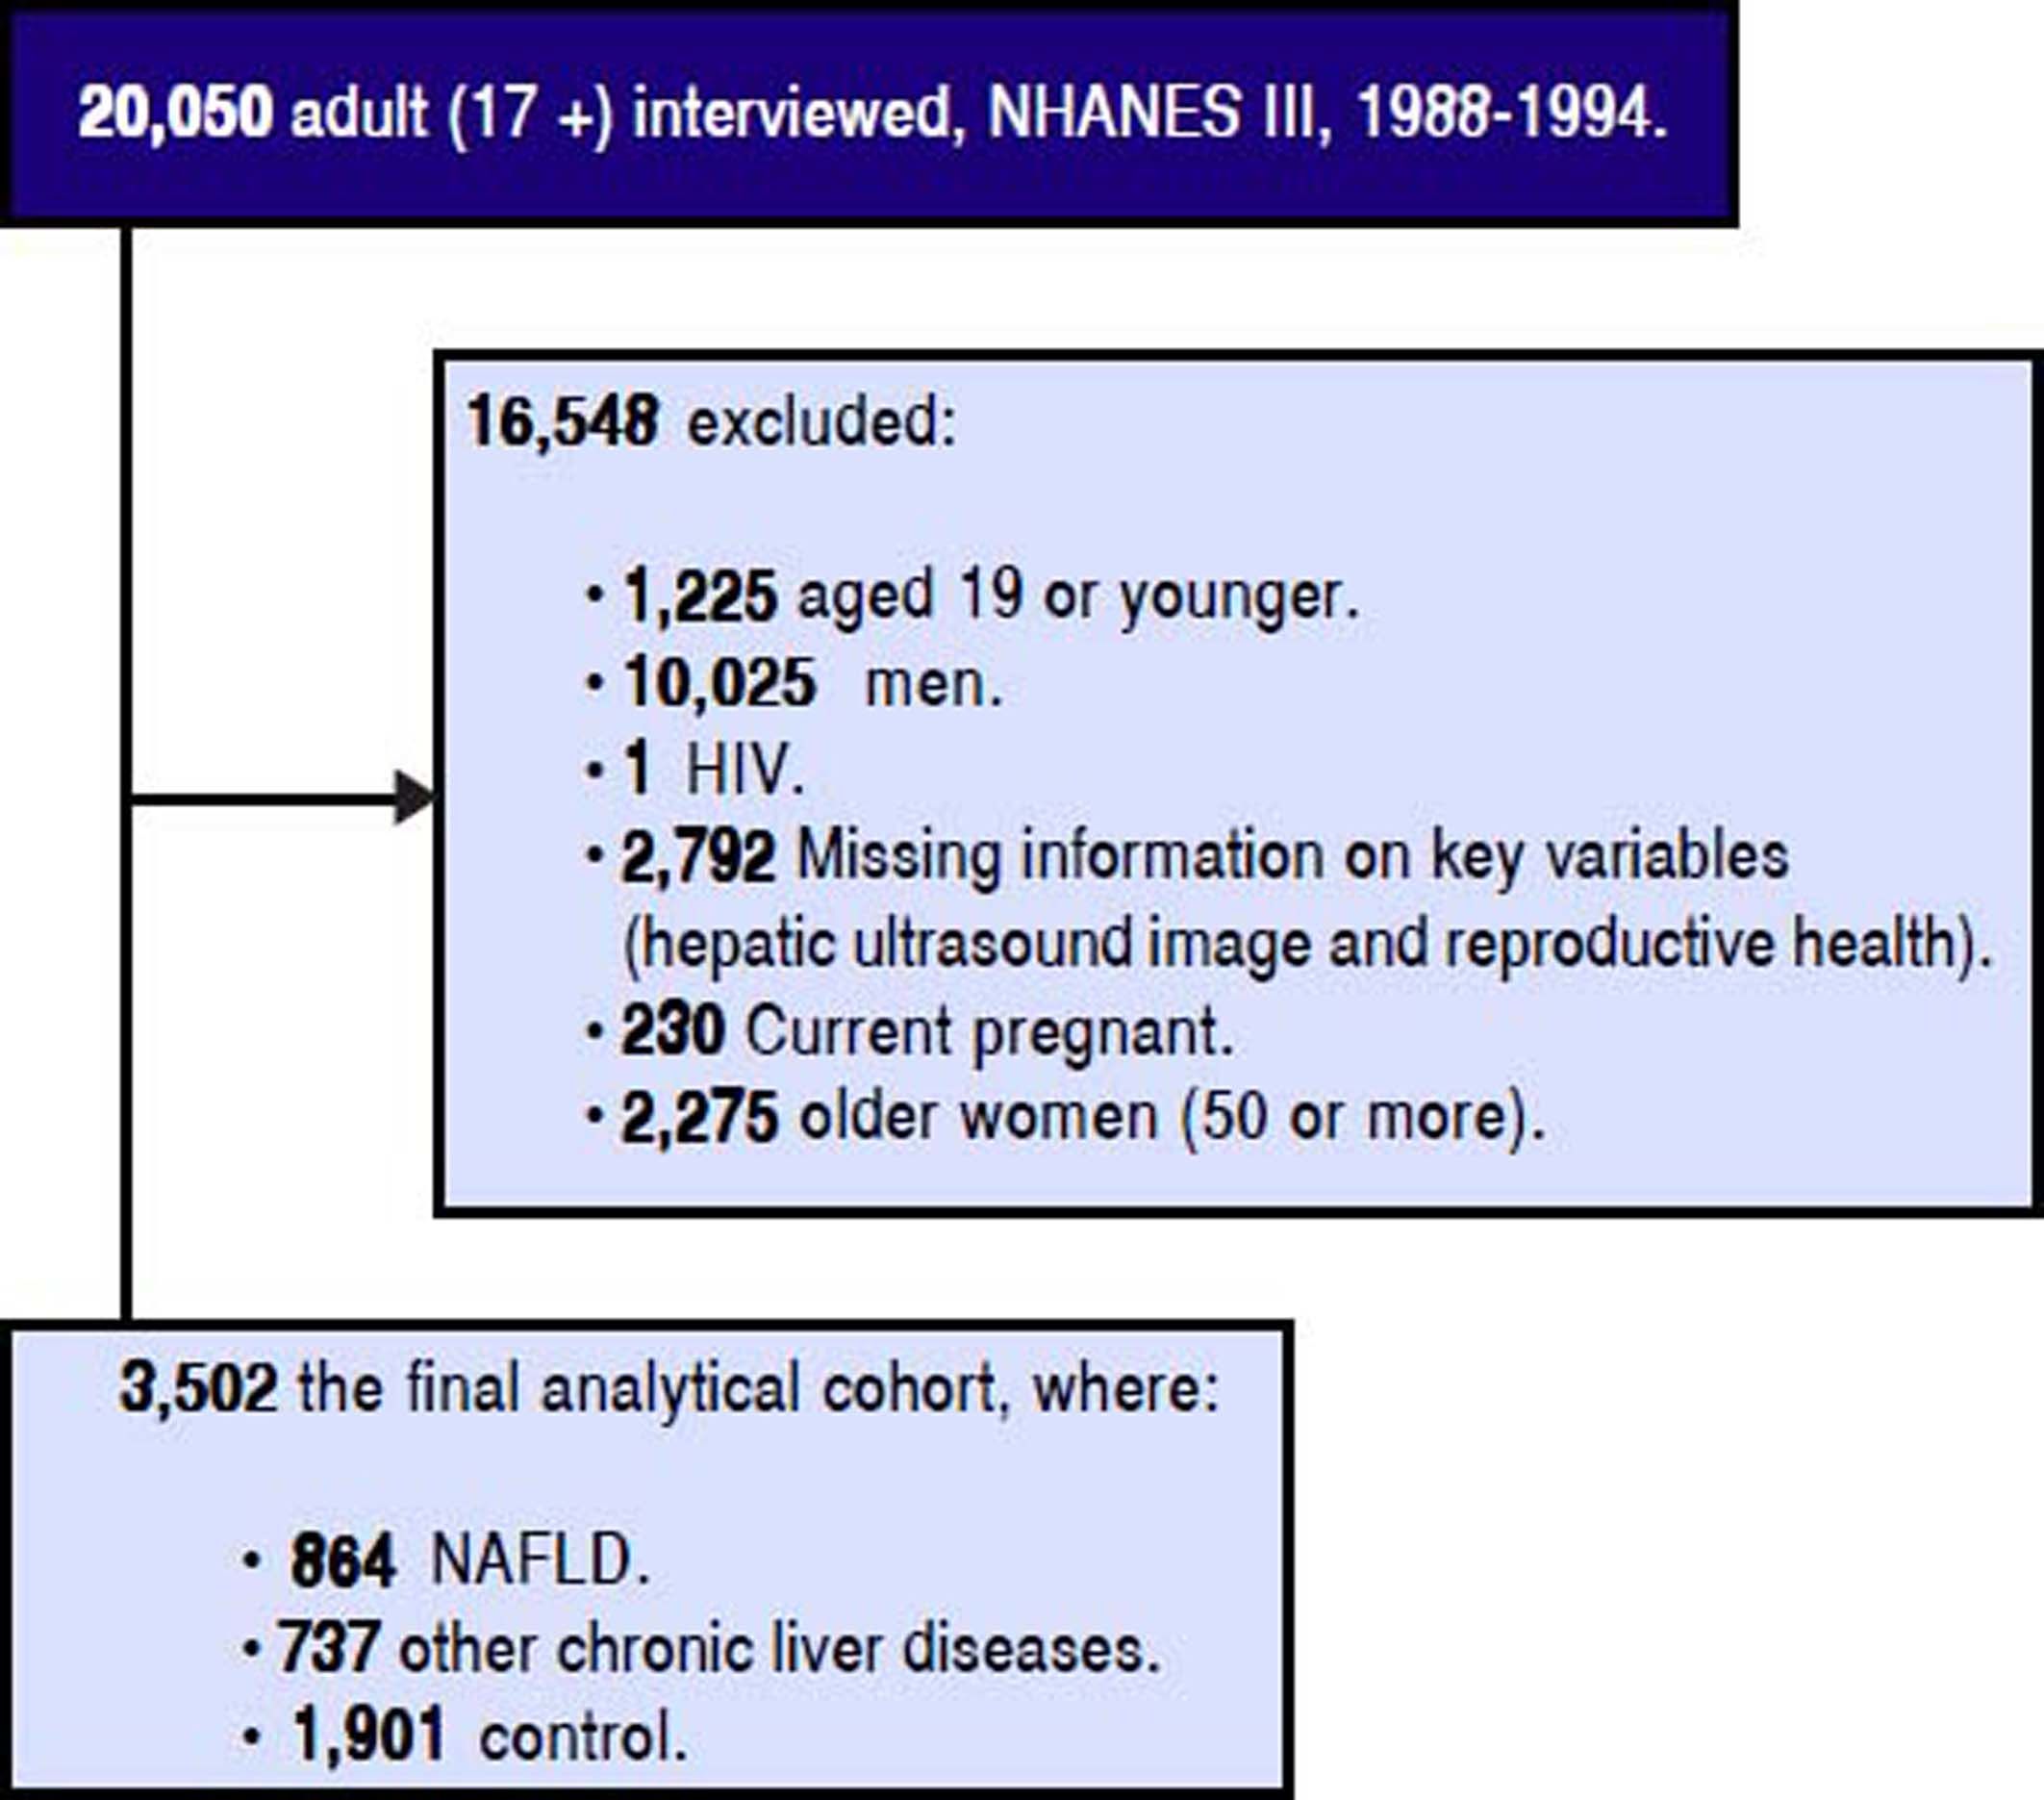
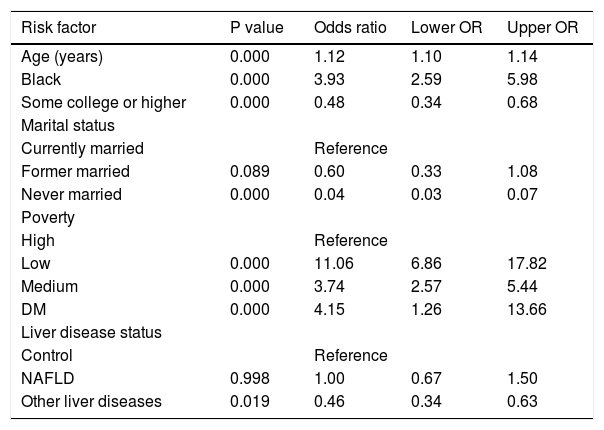
Results. A total of 3,502 (865 NAFLD, 737 other CLD, 1,901 control) subjects were included. Patients with NAFLD were more likely to have at least one live birth than patients with other CLD and controls (77% in NAFLD vs. 72% in controls). Multivariate analysis revealed that presence of CLD other than NAFLD (OR: 0.46 [95% CI, 0.34-0.63]) and having a college or higher degree (OR: 0.48 [95% CI, 0.34-0.68]) were negatively associated while having low income (OR: 11.06 [95% CI, 6.86-17.82]) and being African American (OR: 3.93 [95% CI, 2.59-5.98]) were positively associated with having at least one live birth.
Conclusions. This study revealed that patients with CLD other than NAFLD were less likely to have at least one live birth. NAFLD and obesity were associated with higher rates of live births which can potentially be explained by weight gain post live birth leading to obesity and its associated-NAFLD.
Chronic liver disease (CLD) has been increasingly prevalent and became a major cause of morbidity and mortality worldwide.1,2 The most common causes of chronic liver disease include infections with Hepatitis B (HBV) and C (HCV) viruses, alcoholic liver disease (ALD) and non-alcoholic fatty liver disease (NAFLD).3,4 Although HBV is more common than HCV from the global perspective, HCV is the most common cause of chronic liver disease in the United States (US), accounting for nearly 40% of all newly diagnosed cases of CLD.5 Additionally, NAFLD and its progressive form, non-alcoholic steatohepatitis (NASH) have now been recognized as the leading cause of cirrhosis and advanced liver disease, worldwide. In fact, because of obesity epidemic, the prevalence of NAFLD has doubled during the last two decades, whereas the prevalence of other causes of chronic liver disease has remained stable.6 A recent meta-analysis showed that the prevalence of NAFLD has reached to 25% in the global adult population.7 In this context, it is highly accepted that NAFLD and metabolic syndrome share a common underlying pathophysiological path, insulin resistance, and NAFLD is usually regarded as the hepatic manifestation of the metabolic syndrome.8–11 Although patients with advanced liver disease have lower parity rates, this issue is not very well known for patients with earlier stages of liver disease. Furthermore, the impact of type of liver disease on parity rates is not known. In this study, our aim was to assess the parity rates among women with chronic liver disease according to their type of liver disease.
Material and MethodsStudy Design and PopulationThe population-based NHANES III study used a complex sampling design to produce a representative sample of the U.S. noninstitutionalized population and conducted by the Centers for Disease Control and Prevention.12 Data collection includes a participant’s home interviewer-administered questionnaire by trained interviewers and health measures (medical examination and laboratory samples) at equipped mobile examination centers.13 A total of 20,050 adult participants (17 or older) were interviewed and examined. For the objectives of this study, participants who were child bearing non-pregnant women between the ages of 20 and 50 and who completed the adult reproductive health component of the self-reported questionnaire were included, see detailed cohort selection criteria figure 1. A set of socio-demographic, medical history, and reproductive health measures was self-reported in the interview-administered questionnaire. Age was as a continuous variable (years); gender, education (high school/less than high school vs. some college/higher), health problems (indicating if a participant ever diagnosed the following conditions: cardiovascular disease (CVD), diabetes mellitus (DM), hypertension, and hyperlipidemia by self-reported medical history questionnaire) were all coded as binary variables; and race (White, Black, and Mexican/ Other), marital status (currently married, divorced, and never married), poverty (if the ratio of the family income to the poverty level, DMPPIR < 1.9 as low, 1.9-3.4 as medium, and > 3.5 as high) and liver disease (NAFLD, other chronic LD, and control) were all coded in three level; and household annual income (< $10,000, $10,000 -$24,999, $25,000 - $49,999, and > $50,000) was coded in four level.
Reproductive Health Status: Identification of Parity Status
The outcome in this analysis was parity status. The survey reproductive health part asked those following: (a) “Have you ever been pregnant? Please include miscarriages, stillbirths, tubal pregnancies, abortions, live births, and current pregnancy”; (b) “How many times have you been pregnant? Again, be sure to count all your pregnancies whether they ended in miscarriage, stillbirth, tubal pregnancy, abortion, or live birth”; (c) “What is the total number of live births (live-born children) you have had?”; and (d) “Did you breastfeed (your child/any of your children)?”
Using above questions (a, b, and c), we identified binary parity status variable (no live or never give a birth as coded “0” and at least one or more live birth as coded “1”). Also, we identified breastfeed in those who had at least one or more live birth; however, 54% had missing information on breastfeed.
Definition of Liver DiseasesUsing a Toshiba Sonolayer SSA-90A and Toshiba hepatic ultrasound video recorders, the investigators graded the amount of fat within the hepatic parenchyma was as: (1) normal, (2) mild, (3) moderate, (4) or severe. Quality control and assurance procedures were used to standardize the reading from three ultrasound readers, who had no access to any other participant data. Based on the hepatic ultrasound data, NAFLD was determined to be present if there was mild to severe hepatic steatosis and no other cause of other chronic liver diseases [excessive alcohol use, use if 10 or more grams per day in women and 20 or more grams per day in men based on self-reported daily amount of alcohol consumption, elevated transferrin saturation if transferrin saturation 50% or more), a positive hepatitis B surface antigen (HBsAg), a positive hepatitis B core antibody (anti-HBc), or positive HCV tests (anti-HCV by ELISA and HCV RNA by PCR)]. A grade of “Normal” on the hepatic ultrasound with the absence of the above listed chronic liver disease was defined as control.
Statistical AnalysisTrend analyses by body mass index (BMI) (categorized into: < 30, 30-34.9, 35 and more) were examined. Linear trends test for numerical variables and Wald CHISQ test for categorical variables were tested. BMI determined categories were based on range of BMI and obesity/morbidity obesity. For having at least one live birth, simple logistic regression models with linearized estimated and weighting utilized to obtain population-representative findings.12 BMI groups were not associated with live birth at least once in the independent factors adjusted models. Further, we examined effect modifications whether associations varied by BMI categories with each independent risk factors and we did not find any effect modifications. All analyses computed in SAS version 9.3 (SAS Institute).
ResultsOf the 3,502 eligible non-pregnant women, the average age was 34 years, the average BMI was 26 kg/m2, 78% were White, 65% were married, 22% had NAFLD, and 22% had other CLD. Among those who had other CLD, participants with a higher household income (4th quartile) were more likely to be White (92% as compared 1st Q: 51% White) and less likely to have at least one live birth (54 vs. 65%), and DM (0.2 vs. 3%), and similar about obesity (BMI < 30, 88% vs. 82%) (data not shown). On the other hand, among those who had NAFLD, participants with a higher household income (4th quartile) were more likely to be White (87% as compared 1st Q: 47% White), more likely to have at least one live birth (73 vs. 67%), less likely to have DM (2 vs. 6%), and not likely to be obese (BMI < 30, 73% vs. 47%). The proportion of other CLDs were 44% alcoholic LD, 19% iron overload, 9% HCV, and 2% HBV in cohort of other LD.
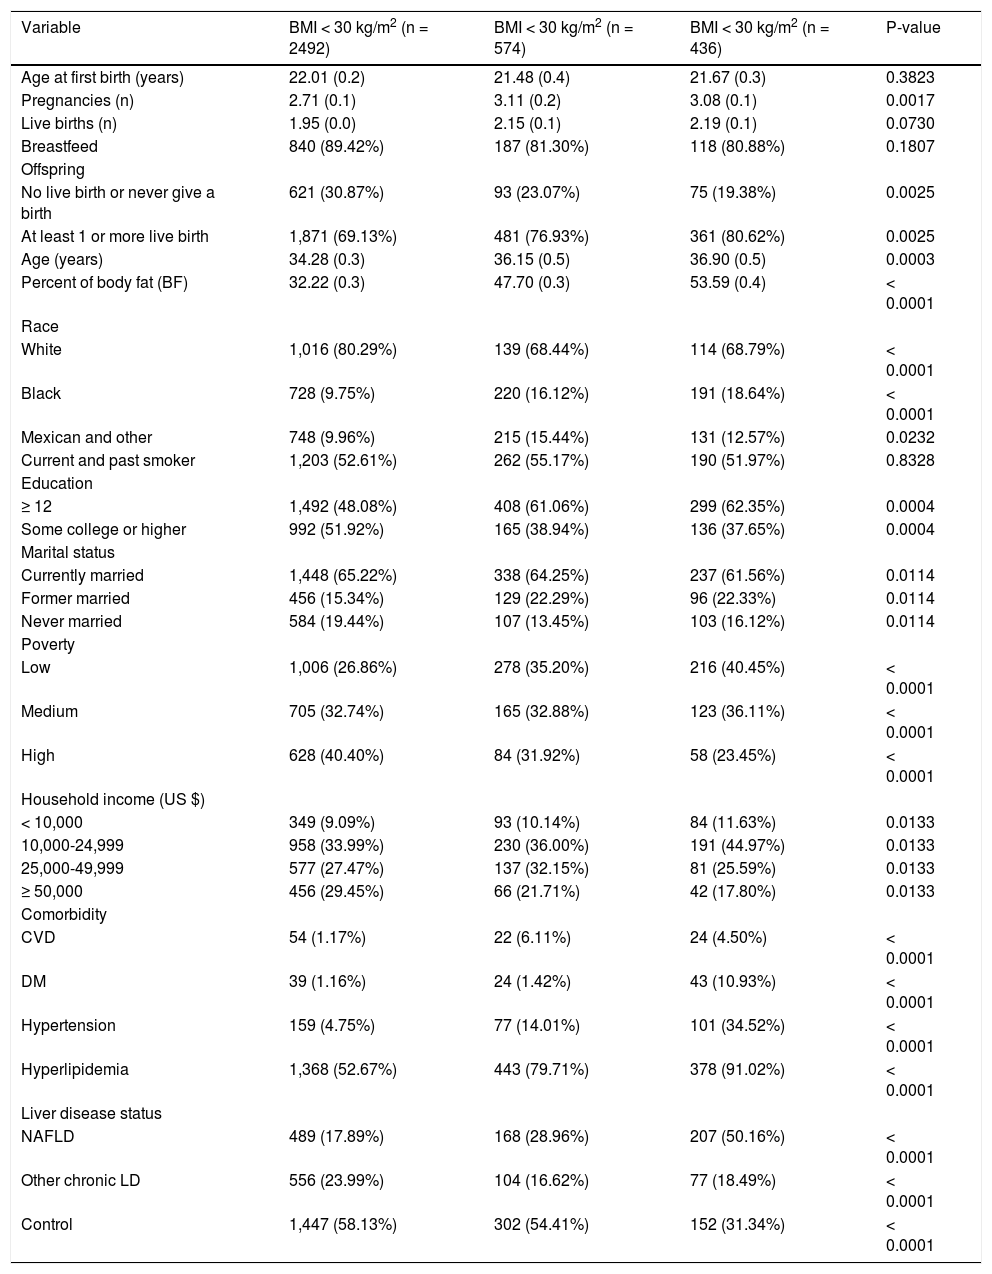
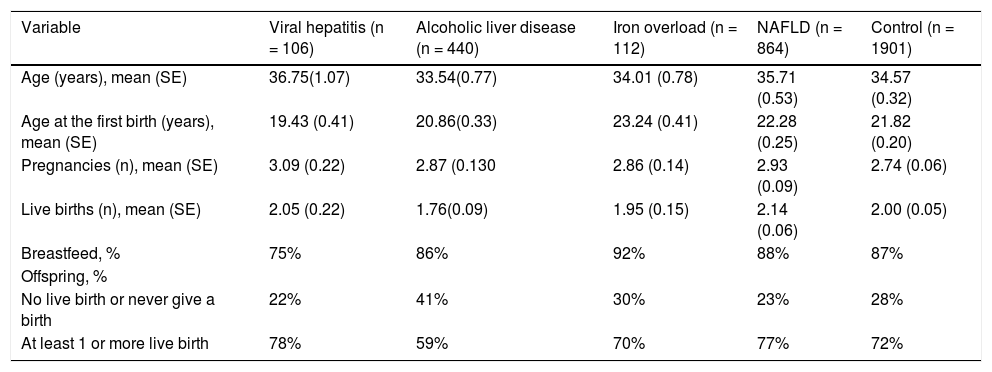
The study characteristics presented across BMI groups were shown in table 1. Compared to obese groups (BMI > 30) a higher percentage of participants in not obese (BMI < 30) group were White, less likely to have live births, had lower prevalence of diabetes, and NAFLD (P < 0.05). Table 2 shows the reproductive health status stratified by each LD status. The proportions of having live births were higher in NAFLD (77%) and hepatitis B / Hepatitis C (78%) than other LD (59% in alcoholic LD and 70% in iron overload) and Control (72%). On the other hand, after controlling for covariates using adjusted logistic regression model, older age (OR: 1.12 [95% CI, 1.10-1.14]), Black race (OR: 3.93 [95% CI, 2.59-5.98]), and poverty (ref: high vs. low, OR: 3.74 [95% CI, 2.57-5.44]) were positively associated with having live births (Table 3). In this model, having other type of CLD was inversely associated with having live births (OR: 0.46 [95% CI, 0.34-0.63]). In fact, after controlling for confounders, NAFLD or high BMI were not associated with parity as measured by this study.
Characteristics of the total study women according to BMI.
| Variable | BMI < 30 kg/m2 (n = 2492) | BMI < 30 kg/m2 (n = 574) | BMI < 30 kg/m2 (n = 436) | P-value |
|---|---|---|---|---|
| Age at first birth (years) | 22.01 (0.2) | 21.48 (0.4) | 21.67 (0.3) | 0.3823 |
| Pregnancies (n) | 2.71 (0.1) | 3.11 (0.2) | 3.08 (0.1) | 0.0017 |
| Live births (n) | 1.95 (0.0) | 2.15 (0.1) | 2.19 (0.1) | 0.0730 |
| Breastfeed | 840 (89.42%) | 187 (81.30%) | 118 (80.88%) | 0.1807 |
| Offspring | ||||
| No live birth or never give a birth | 621 (30.87%) | 93 (23.07%) | 75 (19.38%) | 0.0025 |
| At least 1 or more live birth | 1,871 (69.13%) | 481 (76.93%) | 361 (80.62%) | 0.0025 |
| Age (years) | 34.28 (0.3) | 36.15 (0.5) | 36.90 (0.5) | 0.0003 |
| Percent of body fat (BF) | 32.22 (0.3) | 47.70 (0.3) | 53.59 (0.4) | < 0.0001 |
| Race | ||||
| White | 1,016 (80.29%) | 139 (68.44%) | 114 (68.79%) | < 0.0001 |
| Black | 728 (9.75%) | 220 (16.12%) | 191 (18.64%) | < 0.0001 |
| Mexican and other | 748 (9.96%) | 215 (15.44%) | 131 (12.57%) | 0.0232 |
| Current and past smoker | 1,203 (52.61%) | 262 (55.17%) | 190 (51.97%) | 0.8328 |
| Education | ||||
| ≥ 12 | 1,492 (48.08%) | 408 (61.06%) | 299 (62.35%) | 0.0004 |
| Some college or higher | 992 (51.92%) | 165 (38.94%) | 136 (37.65%) | 0.0004 |
| Marital status | ||||
| Currently married | 1,448 (65.22%) | 338 (64.25%) | 237 (61.56%) | 0.0114 |
| Former married | 456 (15.34%) | 129 (22.29%) | 96 (22.33%) | 0.0114 |
| Never married | 584 (19.44%) | 107 (13.45%) | 103 (16.12%) | 0.0114 |
| Poverty | ||||
| Low | 1,006 (26.86%) | 278 (35.20%) | 216 (40.45%) | < 0.0001 |
| Medium | 705 (32.74%) | 165 (32.88%) | 123 (36.11%) | < 0.0001 |
| High | 628 (40.40%) | 84 (31.92%) | 58 (23.45%) | < 0.0001 |
| Household income (US $) | ||||
| < 10,000 | 349 (9.09%) | 93 (10.14%) | 84 (11.63%) | 0.0133 |
| 10,000-24,999 | 958 (33.99%) | 230 (36.00%) | 191 (44.97%) | 0.0133 |
| 25,000-49,999 | 577 (27.47%) | 137 (32.15%) | 81 (25.59%) | 0.0133 |
| ≥ 50,000 | 456 (29.45%) | 66 (21.71%) | 42 (17.80%) | 0.0133 |
| Comorbidity | ||||
| CVD | 54 (1.17%) | 22 (6.11%) | 24 (4.50%) | < 0.0001 |
| DM | 39 (1.16%) | 24 (1.42%) | 43 (10.93%) | < 0.0001 |
| Hypertension | 159 (4.75%) | 77 (14.01%) | 101 (34.52%) | < 0.0001 |
| Hyperlipidemia | 1,368 (52.67%) | 443 (79.71%) | 378 (91.02%) | < 0.0001 |
| Liver disease status | ||||
| NAFLD | 489 (17.89%) | 168 (28.96%) | 207 (50.16%) | < 0.0001 |
| Other chronic LD | 556 (23.99%) | 104 (16.62%) | 77 (18.49%) | < 0.0001 |
| Control | 1,447 (58.13%) | 302 (54.41%) | 152 (31.34%) | < 0.0001 |
Data were represented mean (SE) for numerical variables and n (%) for categorical variables. P values reported by linear trend test for numerical variables and χ2 test for categorical variables.
Reproductive health of women according to chronic liver diseases status.
| Variable | Viral hepatitis (n = 106) | Alcoholic liver disease (n = 440) | Iron overload (n = 112) | NAFLD (n = 864) | Control (n = 1901) |
|---|---|---|---|---|---|
| Age (years), mean (SE) | 36.75(1.07) | 33.54(0.77) | 34.01 (0.78) | 35.71 (0.53) | 34.57 (0.32) |
| Age at the first birth (years), mean (SE) | 19.43 (0.41) | 20.86(0.33) | 23.24 (0.41) | 22.28 (0.25) | 21.82 (0.20) |
| Pregnancies (n), mean (SE) | 3.09 (0.22) | 2.87 (0.130 | 2.86 (0.14) | 2.93 (0.09) | 2.74 (0.06) |
| Live births (n), mean (SE) | 2.05 (0.22) | 1.76(0.09) | 1.95 (0.15) | 2.14 (0.06) | 2.00 (0.05) |
| Breastfeed, % | 75% | 86% | 92% | 88% | 87% |
| Offspring, % | |||||
| No live birth or never give a birth | 22% | 41% | 30% | 23% | 28% |
| At least 1 or more live birth | 78% | 59% | 70% | 77% | 72% |
Data were represented mean (SE) for numerical variables and n (%) for categorical variables. P values reported by t tests for numerical variables and χ2 tests for categorical variables.
Multivariate logistics model on having at least one live birth vs never/no live birth.
| Risk factor | P value | Odds ratio | Lower OR | Upper OR |
|---|---|---|---|---|
| Age (years) | 0.000 | 1.12 | 1.10 | 1.14 |
| Black | 0.000 | 3.93 | 2.59 | 5.98 |
| Some college or higher | 0.000 | 0.48 | 0.34 | 0.68 |
| Marital status | ||||
| Currently married | Reference | |||
| Former married | 0.089 | 0.60 | 0.33 | 1.08 |
| Never married | 0.000 | 0.04 | 0.03 | 0.07 |
| Poverty | ||||
| High | Reference | |||
| Low | 0.000 | 11.06 | 6.86 | 17.82 |
| Medium | 0.000 | 3.74 | 2.57 | 5.44 |
| DM | 0.000 | 4.15 | 1.26 | 13.66 |
| Liver disease status | ||||
| Control | Reference | |||
| NAFLD | 0.998 | 1.00 | 0.67 | 1.50 |
| Other liver diseases | 0.019 | 0.46 | 0.34 | 0.63 |
Data were represented mean (SE) for numerical variables and N (%) for categorical variables. P values reported by t tests for numerical variables and χ2 tests for categorical variables.
This study revealed some intriguing findings in means of parity rates among patients with different types of liver diseases. First, live births were associated with known socio-demographic factors. Second, BMI and NAFLD did show some association with increased number of live births, but this was not confirmed after controlling for confounders. In contrast, having other liver diseases was associated with lower parity.
The association of higher BMI and NAFLD with higher parity is interesting. The prevalence of overweight and obesity increased substantially in the last decades and this trend is true for the entire population, women in child-bearing age. In fact, pregnancy may promote temporary obesity, which could remain an important challenge post-partum. Studies have revealed that between 30 - 50% of women become either overweight or obese during early pregnancy.14,15 In fact, in a recent study from Wisconsin, United States, nearly half of mothers in 2011 had a BMI > 25 kg/m2 just prior to pregnancy.16 This study, as well as others, has suggested that being multiparous and multi-gravidous are associated with being overweight.17,18 In this context, higher numbers of pregnancies and live births seem to be associated with the increasing levels of BMI. This is most likely due to the excess weight retained after giving birth. In fact, some studies have suggested that the range of weight gain can be as high as 20 kg in some women.19–24 Furthermore, about 40% of overweight women became obese 12 months post-partum and 18% of normal weight women moved to overweight category.25,26 More importantly, the more children a woman had, the more likely she was to become obese and the short inter-pregnancy interval was another factor for developing obesity in multiparous women.18,27,28 These facts can be an explanation for the higher likelihood of having at least 1 or more live births in women with a BMI > 35 than < 30. This is the first study that provided some evidence associating risk of NAFLD in patients with higher rates of live births.
Another important finding of our study was the significant difference in live birth rates among patients with chronic liver disease. The mean number of live births was higher in patients with NAFLD (2.14) and hepatitis (2.05) than patients with alcoholic liver disease (1.76). Similarly, the proportion of patients with at least one live birth was higher in patients with NAFLD (77%) and hepatitis (78%) than alcoholic liver disease (59%). Indeed, an explanation for this difference, other than becoming more overweight after successive deliveries, could be the different response to ethanol among females. It was previously shown that alcoholic liver injury is more serious and rapidly developing in women than men, even with a lower daily intake.29,30 In premenopausal women, chronic ethanol consumption increases the frequency of menstrual disturbances, abortions, miscarriages, and leads to early menopause, even before the liver disease is present,31 which might have an effect for the lower rates in our study.
Multivariate analysis established a significant association between the presence of a chronic liver disease other than NAFLD and lower likelihood of having a live birth. In fact, although the effects of chronic liver disease on parity were studied previously, no concrete conclusion was achieved in this topic. Lee at al. reported that in chronic liver disease, amenorrhea and anovulation usually go hand in hand, which may decrease parity rates. But, it was also noted that women with early and mild liver disease, in the absence of cirrhosis, or who were in remission could expect normal parity rates.32 In a historical study, Varma, et al. stated that patients with chronic hepatitis B and C infection with a mild liver disease had virtually no alterations in parity rates.33 Other studies reported that pregnancy was relatively rare in patients with autoimmune hepatitis34 but could occur in women who had good control of disease.35 In our study, the presence of a chronic liver disease other than NAFLD was associated with a lower likelihood of having at least one live birth.
On the other hand, the proportion of women with no live birth was significantly lower in patients with NAFLD compared to patients with other chronic liver diseases and controls. Because of the common pathways, NAFLD has always been associated with metabolic syndrome and disorders related to insulin resistance, such as polycystic ovary syndrome (PCOS).36,37 Previous studies clearly demonstrated that patients with PCOS experience reproductive abnormalities, which worsen with increasing abdominal obesity.38–40 Because of this relation, it could be hypothesized that patients with NAFLD could have lower parity rates than healthy individuals. However, even though our study did not find such an association between parity rates and NAFLD, our findings should be interpreted considering the effect of pregnancies, mostly more than one, on women’s weight and possible transformation to NAFLD.
Our study also has some limitations. First of all, we utilized the NHANES database in assessing the effect of chronic liver diseases on parity rates. Although NHANES database reveals strong and accountable data on participants’ nutritional and health status for decades,41 the presence of NAFLD and other liver diseases were assessed at the time of interview. In this manner, we cannot state if participants with liver disease had their disease before their reproductive ages. Moreover, as stated previously, socio-economic factors and psychology have a major role in parity rates, and it is possible that women with viral hepatitis might have lower parity given the concern for transmitting the infection to child. Similarly, women with alcoholic liver disease frequently have very poor socioeconomic status, which would negatively impact their parity rates, rather than their ability to get pregnant. Finally, as we discussed the effect of weight retention after pregnancies, NAFLD may be a consequence of pregnancy, rather than a factor prior to it.
In conclusion, this study showed that compared to control group, the likelihood of having at least one live birth was significantly lower in patients with a liver disease other than NAFLD. Education level and financial status of women were found to be strong confounders of having at least one live birth. More studies are needed to better understand the effect of liver diseases on women’s reproductive health.
Abbreviations- •
ALD: alcoholic liver disease.
- •
BMI: body mass index.
- •
CLD: chronic liver disease.
- •
CVD: cardiovascular disease.
- •
DM: diabetes mellitus.
- •
HBV: hepatitis B virus.
- •
HCV: hepatitis C virus.
- •
NAFLD: non-alcoholic fatty liver disease.
- •
NASH: non-alcoholic steatohepatitis.
- •
PCOS: polycystic ovary syndrome.
- •
US: United States.
ZMY is a consultant to BMS, Gilead, AbbVie, Intercept, GSK, and Salix.
DeclarationsEthics approval and consent to participate: The study was approved by Inova Institutional Review Board, the approval number is NHANES IRB: 12.1074.
AcknowledgementsThe authors would like to thank Deena Hallaji, Manirath Srishord and Aybike Birerdinc for their great support during study process.


