


Recent evidence indicates that metabolic dysfunction and alcohol-associated steatotic liver disease (MetALD), a newly defined subgroup of steatotic liver disease (SLD), may have a worse prognosis than metabolic dysfunction-associated steatotic liver disease (MASLD). This study examines the clinical factors influencing the severity of MetALD to inform and improve future management strategies.
Patients and MethodsData from the 2017-2020 National Health and Nutrition Examination Surveys (NHANES), involving 7745 adults with valid elastography measurements, were utilized to define and estimate the prevalence of MASLD, MetALD, and alcohol liver disease (ALD). Controlled attenuation parameter (CAP) ≥285 dB/m, liver stiffness measurement (LSM) ≥8 kPa, and ≥12 kPa indicated the presence of hepatic steatosis, clinically significant fibrosis, and advanced fibrosis, respectively.
ResultsThe prevalence of MetALD was 4 % (N=287), compared to 24 % (N=2049) for MASLD and 7 % (N=486) for ALD. The prevalence of significant fibrosis and advanced fibrosis in MetALD was 10.8 % and 3.1 %, respectively, compared to 24.7 % and 9.8 % in MASLD, and 15 % and 8 % in ALD. Logistic regression analysis among MetALD patients showed that higher body mass index (BMI) (odds ratio [OR]: 1.15, 95 % CI: 1.08-1.23, P<0.01) and diabetes mellitus (DM) (OR: 3.0, 95 % CI: 1.06-6.2, P<0.01) were associated with an increased risk of fibrosis. These factors were also identified as independent risk factors for fibrosis in patients with MASLD and ALD.
ConclusionsMetALD had the lowest prevalence and fibrosis severity among the three groups of SLD. Elevated BMI and DM were associated with the severity of liver disease, and these findings provide a rationale for the use of obesity- and diabetes-targeted medications in these individuals.
Since 2020, many international experts have been working to replace the acronym non-alcoholic fatty liver disease (NAFLD) with one that describes the condition more accurately and adequately [1]. In 2023, metabolic dysfunction-associated steatotic liver disease (MASLD) was proposed to replace the old acronym [2]. MASLD was redefined with positive inclusion criteria, including parameters that specifically define metabolic dysfunction [2]. Due to their excellent concordance, MASLD and NAFLD were recommended to be used interchangeably [3]. This change in terminology, however, introduced a new subgroup called metabolic dysfunction and alcohol-associated steatotic liver disease (MetALD) [4]. This subgroup includes those who meet the criteria for steatotic liver disease, along with both metabolic dysfunction and significant alcohol consumption, which was not thoroughly investigated before due to the clear exclusion of significant alcohol consumption in the definition of NAFLD [4]. On the other hand, most patients previously classified as having alcoholic liver disease (ALD) appeared to align with this new patient group [5].
Recent data suggests that those with MetALD may have a worse prognosis and overall mortality rate compared to MASLD patients [6–11]. A population-based Japanese study by Tamaki et al. revealed increased liver-related events and mortality in patients with MetALD compared to those with MASLD (Hazard Ratio [HR]: 1.42 [95 % CI: 1.1–1.8] and HR: 1.13 [95 % CI: 0.98–1.3], respectively) [9]. On the other hand, patients with MetALD were shown to experience fewer cardiovascular events (HR: 0.68 [95 % CI: 0.63–0.73]) [9]. Similarly, the data analysis of NHANES (1988-1994) showed an increased risk of all-cause and cancer-related mortality in MetALD patients compared to MASLD (HR: 1.45 [95 % CI 1.08-1.96] and HR 2.39 [95 % CI 1.36-4.19], respectively) [10]. Similar trends were confirmed in another analysis of this population [12]. In another long-term outcome study, MetALD group was associated with increased all-cause (HR:1.41 [95 % CI:1.05-1.89], P=0.022), cancer- (HR: 2.35 [95 % CI: 1.33-4.16], P=0.004) and liver- (HR:15.04 [95 % CI: 2.96-76.35], P=0.002) related mortality compared to non-SLD population [11]. This trend was not observed in the MASLD population alone [11]. Another analysis involving a Korean cohort (N=9497) also confirmed the increased risk of developing advanced fibrosis in those with MetALD [7]. The risk of having advanced fibrosis increased in the following order: MASLD (HR: 1.39; 95 % CI: 1.25–1.55; P < 0.001), MetALD (HR: 1.75; 95 % CI: 1.38–2.23; P < 0.001), and alcoholic liver disease (HR: 2.00; 95 % CI: 1.30–3.07; P = 0.002) [7]. Even cardiovascular risk was higher in the MetALD group compared to MASLD (HR: 1.88 [95 % CI: 1.33-2.65] and HR: 1.27 [95 % CI: 1.12-1.45] [7]. Moreover, according to a recent analysis, MetALD was the third leading cause of liver transplantation in the U.S., with an increasing trend in prevalence since 2013 [13]. Compared to alcoholic liver disease, those patients had a worse transplant outcome [13]. All these recent data indicate significantly higher mortality and liver-related complications for MetALD. Therefore, any insights that would allow for effective lifestyle and therapeutic interventions are urgently needed to address the significant challenges MetALD poses to healthcare providers.
The recent nomenclature lists individuals with MetALD on a spectrum, ranging from those with a predominance of MASLD features to those with predominantly ALD characteristics [2,4]. Importantly, the diagnosis of MetALD requires only one of the five cardiometabolic risk factors, which introduces significant variability in the disease profile [2]. For example, a MetALD individual with type 2 diabetes mellitus (DM), obesity, and multiple other cardiometabolic risk factors is likely to have a different prognosis compared to someone with only one risk factor, such as hypertension, but without DM, obesity, or dyslipidemia. This heterogeneity raises the possibility that not all individuals with MetALD share the same prognosis, underscoring the need for nuanced assessment to allow for tailored management strategies. This study addresses the knowledge gap regarding the MetALD subgroup of SLD, which remains underexplored despite its clinical significance. Leveraging data from the 2017–2020 National Health and Nutrition Examination Surveys (NHANES), we sought to comprehensively characterize the MetALD population to identify any modifiable clinical characteristics associated with disease severity.
2Patients and methods2.1Study populationFor the analysis, we used the epidemiologic data derived from the NHANES database between 2017 and 2020, representing the United States population (US). The NHANES is a major initiative by the National Center for Health Statistics, a part of the Centers for Disease Control and Prevention, responsible for generating health statistics for the country. An experienced technician obtained the elastography measurements in the NHANES Mobile Examination Center (MEC) using the FibroScan model 502 Touch equipped with a medium (M) or extra-large (XL) wand (probe). The NCHS institutional review board approved the study, and all participants provided their written informed consent. A detailed description of the study methodology, including questionnaires, physical examinations, sample design, and estimation procedures, has been published elsewhere [14,15]. Further information on quality assurance and quality control measures considered for vibration-controlled transient elastography (VCTE) procedures is also publicly available elsewhere [16].
A total of 10,409 individuals aged ≥12 years were eligible for VCTE assessment. Of them, we excluded 748 with partial results (fasting <3 hours, unable to obtain 10 valid measures, IQR/M >30 %), 386 were ineligible, and 252 whose VCTE were not performed. We further excluded children (<18 years), then adult participants with positivity for hepatitis C and B, and those taking steatogenic medications, reporting no information on alcohol intake, and with missing clinical and laboratory data to classify people with metabolic syndrome.
2.2Anthropometric, clinical, and laboratory dataThe survey included anthropometric and demographic data, interviews, physical examination, and laboratory data. The patients were classified according to body mass index (BMI) following the recommendations of the World Health Organization [17]. According to a standardized method, laboratory tests were performed using a Hitachi 737 automated multi-channel chemistry analyzer (Boehringer Mannheim Diagnostics, Indianapolis, IN).
2.3Defining SLD, MASLD, MetALD and ALDSLD was defined using VCTE measurements. A controlled attenuation parameter (CAP) value ≥285 dB/m was considered as the presence of hepatic steatosis [18]. Liver stiffness measurement (LSM) ≥8 kPa and ≥12 kPa indicated significant fibrosis (F≥2) and advanced fibrosis (F≥3), respectively [19]. Individuals suspected to have clinically significant fibrosis (CSF), i.e., F≥2 with steatohepatitis, were identified based on FAST score of 0.35 [20]. SLD phenotypes were defined by AASLD guidelines [19]. MASLD was defined in patients with hepatic steatosis, at least one cardiometabolic risk factor, and a lack of significant alcohol intake (<20 gr/day for women and <30 gr/day for men). Cardiometabolic risk factors were defined as follows: (1) BMI ≥ 25 kg/m2 or waist circumference > 94 cm for men and > 80 cm for women, (2) fasting blood glucose ≥ 100 mg/dL or HbA1c ≥ 5.7 %, (3) blood pressure levels ≥ 130/85 mmHg or presence of antihypertensive treatment, (4) plasma triglycerides ≥ 150 mg/dL or lipid-lowering treatment, and (5) High-density lipoprotein (HDL) ≤ 40 mg/dL for men and ≤ 50 mg/dL for women or lipid-lowering treatment. Patients with SLD who reported 20-49 gr/day for women and 30-59 gr/day for men of alcohol consumption and fulfilled at least 1 criterion for metabolic dysfunction were classified as MetALD. ALD was considered by the presence of SLD and alcohol intake between ≥50 g/d in females and ≥60 g/d in males. Those without any explanation for SLD were considered cryptogenic SLD.
2.4Statistical analysisWe used the sample weights recommended by NHANES to account for the survey's complex sampling design. The weighted means and percentages for demographic factors were estimated with a confidence interval (CI) of 95 %. Continuous variables were compared using the student´s t-test and categorical using the design-adjusted Rao-Scott chi-square test. Logistic regression analyses examined the association between significant fibrosis and fibrosis stage 2 with steatohepatitis, BMI, and DM. All multivariable analyses were systematically adjusted for age, sex, race and ethnicity, and the variable of interest. All analyses used SAS version 9.4 (SAS Institute Inc, Cary, NC) and Stata MP Version 18.5 (StataCorp, College Station, TX). A 2-tailed value of P < 0.05 was considered statistically significant.
2.5Ethical StatementThe NCHS institutional review board approved the study, and all participants provided their written informed consent. As this analysis was based on publicly available and de-identified data from NHANES, no additional ethical approval was required.
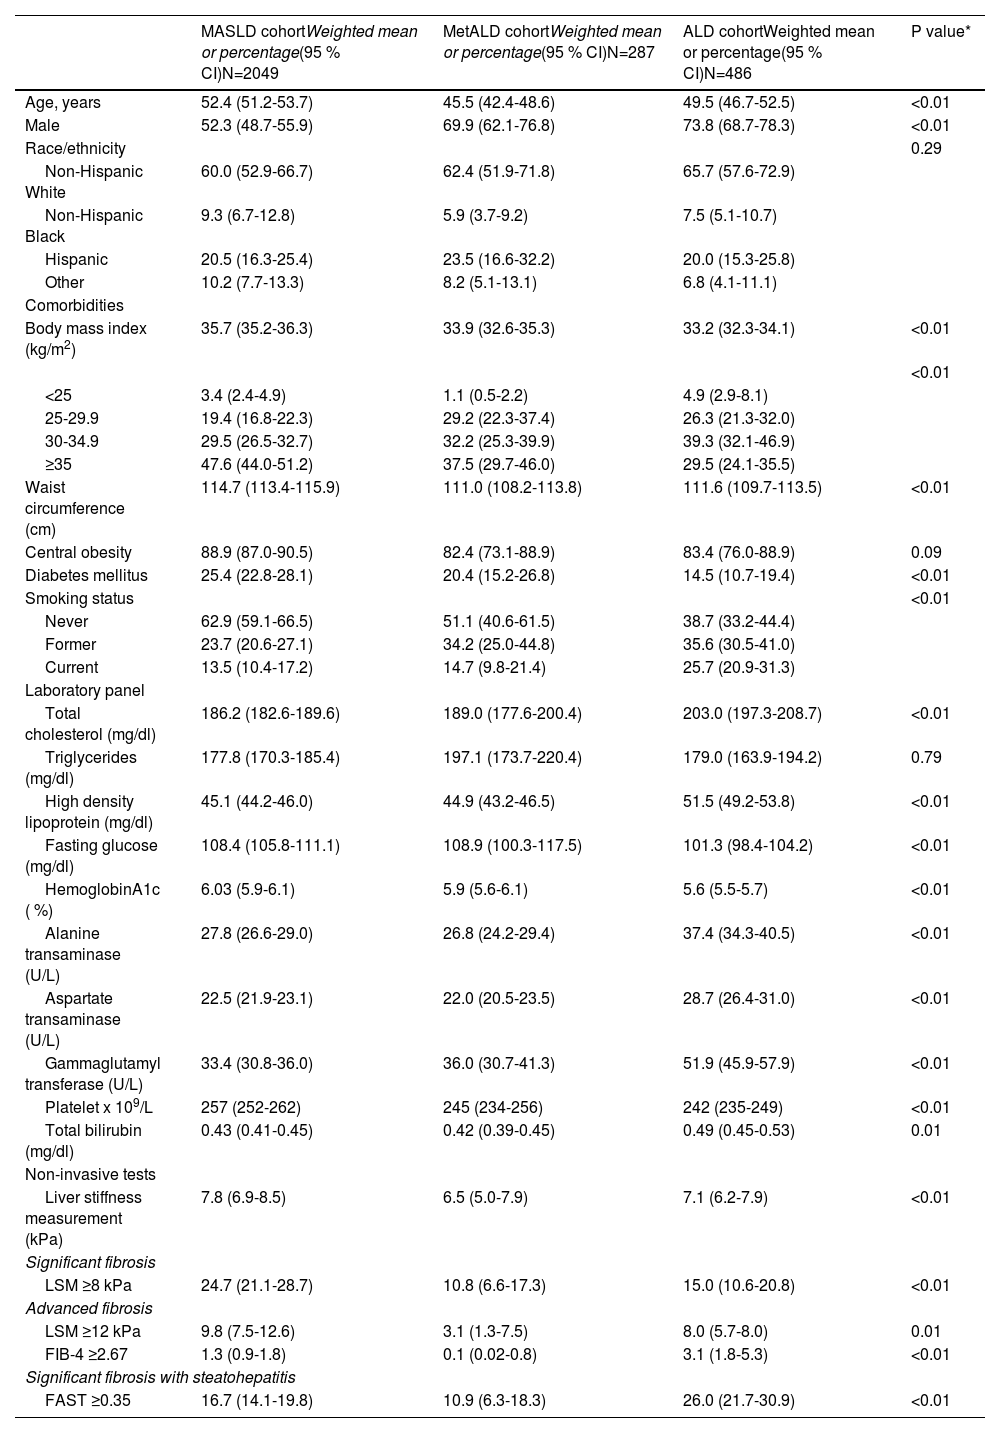
3ResultsAfter applying exclusion criteria, 7745 patients from the NHANES database were suitable for analysis. The weighted percentages for the prevalence of non-SLD, MASLD, MetALD, ALD, and cryptogenic SLD were as follows: 64 % (N=4,864), 24 % (N=2049), 4 % (N=287), 7 % (N=486) and 1 % (N=59). Age-adjusted population estimates are 53,715.417 for MASLD, 9,234.156 for MetALD, and 15,859.370 for ALD. The clinical characteristics of the patients with MASLD, MetALD, and ALD are depicted in Table 1. The prevalence of clinically significant fibrosis (CSF) and advanced fibrosis among patients with MetALD was 10.8 % (95 % CI: 6.6-17.3) and 3.1 % (95 % CI: 1.3-7.5), respectively. In comparison, patients with MASLD showed significantly higher rates, with 24.7 % for significant fibrosis and 9.8 % for advanced fibrosis (P<0.001), compared to both MetALD and ALD. Conversely, CSF with steatohepatitis (FAST ≥ 0.35) was highest among patients with ALD, reaching 26 % (P<0.001).
Baseline characteristic of individuals with the three phenotypes of steatotic liver disease, MASLD, MetALD and ALD in NHANES cycle 2017-2020 (N=2822).
| MASLD cohortWeighted mean or percentage(95 % CI)N=2049 | MetALD cohortWeighted mean or percentage(95 % CI)N=287 | ALD cohortWeighted mean or percentage(95 % CI)N=486 | P value* | |
|---|---|---|---|---|
| Age, years | 52.4 (51.2-53.7) | 45.5 (42.4-48.6) | 49.5 (46.7-52.5) | <0.01 |
| Male | 52.3 (48.7-55.9) | 69.9 (62.1-76.8) | 73.8 (68.7-78.3) | <0.01 |
| Race/ethnicity | 0.29 | |||
| Non-Hispanic White | 60.0 (52.9-66.7) | 62.4 (51.9-71.8) | 65.7 (57.6-72.9) | |
| Non-Hispanic Black | 9.3 (6.7-12.8) | 5.9 (3.7-9.2) | 7.5 (5.1-10.7) | |
| Hispanic | 20.5 (16.3-25.4) | 23.5 (16.6-32.2) | 20.0 (15.3-25.8) | |
| Other | 10.2 (7.7-13.3) | 8.2 (5.1-13.1) | 6.8 (4.1-11.1) | |
| Comorbidities | ||||
| Body mass index (kg/m2) | 35.7 (35.2-36.3) | 33.9 (32.6-35.3) | 33.2 (32.3-34.1) | <0.01 |
| <0.01 | ||||
| <25 | 3.4 (2.4-4.9) | 1.1 (0.5-2.2) | 4.9 (2.9-8.1) | |
| 25-29.9 | 19.4 (16.8-22.3) | 29.2 (22.3-37.4) | 26.3 (21.3-32.0) | |
| 30-34.9 | 29.5 (26.5-32.7) | 32.2 (25.3-39.9) | 39.3 (32.1-46.9) | |
| ≥35 | 47.6 (44.0-51.2) | 37.5 (29.7-46.0) | 29.5 (24.1-35.5) | |
| Waist circumference (cm) | 114.7 (113.4-115.9) | 111.0 (108.2-113.8) | 111.6 (109.7-113.5) | <0.01 |
| Central obesity | 88.9 (87.0-90.5) | 82.4 (73.1-88.9) | 83.4 (76.0-88.9) | 0.09 |
| Diabetes mellitus | 25.4 (22.8-28.1) | 20.4 (15.2-26.8) | 14.5 (10.7-19.4) | <0.01 |
| Smoking status | <0.01 | |||
| Never | 62.9 (59.1-66.5) | 51.1 (40.6-61.5) | 38.7 (33.2-44.4) | |
| Former | 23.7 (20.6-27.1) | 34.2 (25.0-44.8) | 35.6 (30.5-41.0) | |
| Current | 13.5 (10.4-17.2) | 14.7 (9.8-21.4) | 25.7 (20.9-31.3) | |
| Laboratory panel | ||||
| Total cholesterol (mg/dl) | 186.2 (182.6-189.6) | 189.0 (177.6-200.4) | 203.0 (197.3-208.7) | <0.01 |
| Triglycerides (mg/dl) | 177.8 (170.3-185.4) | 197.1 (173.7-220.4) | 179.0 (163.9-194.2) | 0.79 |
| High density lipoprotein (mg/dl) | 45.1 (44.2-46.0) | 44.9 (43.2-46.5) | 51.5 (49.2-53.8) | <0.01 |
| Fasting glucose (mg/dl) | 108.4 (105.8-111.1) | 108.9 (100.3-117.5) | 101.3 (98.4-104.2) | <0.01 |
| HemoglobinA1c ( %) | 6.03 (5.9-6.1) | 5.9 (5.6-6.1) | 5.6 (5.5-5.7) | <0.01 |
| Alanine transaminase (U/L) | 27.8 (26.6-29.0) | 26.8 (24.2-29.4) | 37.4 (34.3-40.5) | <0.01 |
| Aspartate transaminase (U/L) | 22.5 (21.9-23.1) | 22.0 (20.5-23.5) | 28.7 (26.4-31.0) | <0.01 |
| Gammaglutamyl transferase (U/L) | 33.4 (30.8-36.0) | 36.0 (30.7-41.3) | 51.9 (45.9-57.9) | <0.01 |
| Platelet x 109/L | 257 (252-262) | 245 (234-256) | 242 (235-249) | <0.01 |
| Total bilirubin (mg/dl) | 0.43 (0.41-0.45) | 0.42 (0.39-0.45) | 0.49 (0.45-0.53) | 0.01 |
| Non-invasive tests | ||||
| Liver stiffness measurement (kPa) | 7.8 (6.9-8.5) | 6.5 (5.0-7.9) | 7.1 (6.2-7.9) | <0.01 |
| Significant fibrosis | ||||
| LSM ≥8 kPa | 24.7 (21.1-28.7) | 10.8 (6.6-17.3) | 15.0 (10.6-20.8) | <0.01 |
| Advanced fibrosis | ||||
| LSM ≥12 kPa | 9.8 (7.5-12.6) | 3.1 (1.3-7.5) | 8.0 (5.7-8.0) | 0.01 |
| FIB-4 ≥2.67 | 1.3 (0.9-1.8) | 0.1 (0.02-0.8) | 3.1 (1.8-5.3) | <0.01 |
| Significant fibrosis with steatohepatitis | ||||
| FAST ≥0.35 | 16.7 (14.1-19.8) | 10.9 (6.3-18.3) | 26.0 (21.7-30.9) | <0.01 |
Continuous variables were compared using linear regression and categorical variables using the Rao-Scott chi-square tests. FIB-4: Fibrosis 4, FAST: FibroScan-aspartate aminotransferase (FAST) score of ≥0.35 identifies metabolic dysfunction-associated steatohepatitis (MASH) patients with NAFLD activity score (NAS ≥ 4) and significant fibrosis (≥ F2) on liver biopsy with ≥90 % sensitivity. MASLD: metabolic dysfunction-associated steatotic liver disease, MetALD: Metabolic dysfunction and alcohol-associated steatotic liver disease, ALD: alcoholic liver disease, NHANES: National Health and Nutrition Examination Surveys, LSM: liver stiffness measurement, FIB-4: Fibrosis-4, FAST: FibroScan-aspartate aminotransferase, NAS: NAFLD activity score.
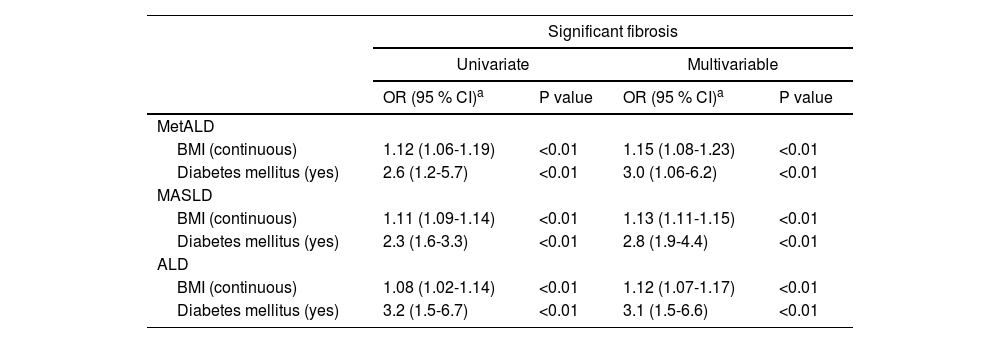
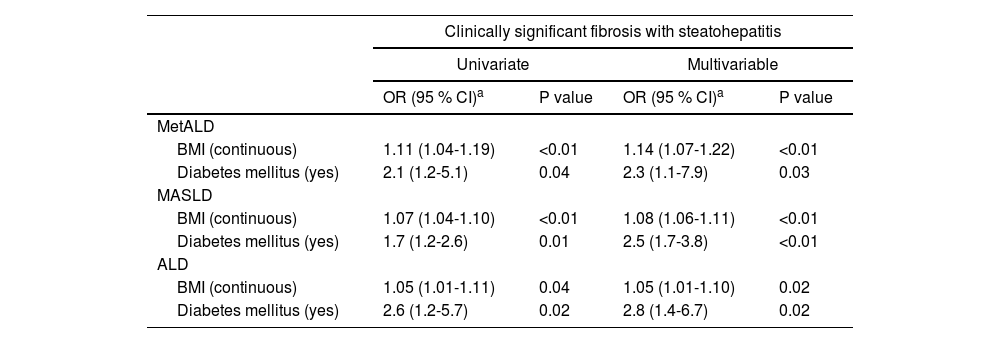
The logistic regression analysis demonstrated that both BMI and DM are significant predictors of significant fibrosis across all groups (MetALD, MASLD, and ALD), with associations adjusted for age, sex, and race/ethnicity (Table 2). For MetALD, higher BMI (OR 1.15; 95 % CI: 1.08-1.23, P<0.01) and DM (OR 3.0; 95 % CI: 1.06-6.2, P<0.01) were strongly associated with fibrosis severity. Similarly, in MASLD, BMI (OR 1.13; 95 % CI: 1.11-1.15, P<0.01) and DM (OR 2.8; 95 % CI: 1.9-4.4, P<0.01) showed strong associations. Similar associations were also seen in ALD with BMI (OR 1.12; 95 % CI: 1.07-1.17, P<0.01) and DM (OR 3.1; 95 % CI: 1.5-6.6, P<0.01). Overall, DM remained a robust predictor of significant fibrosis in all three groups of SLD. Table 3 shows the association between BMI, DM, and CSF with steatohepatitis across MetALD, MASLD, and ALD, based on logistic regression analysis. In MetALD group, both BMI (OR 1.14; 95 % CI: 1.07-1.22, P<0.01) and DM (OR 2.3; 95 % CI: 1.1-7.9, P=0.03) were significantly associated with the presence of CSF with steatohepatitis in multivariable analysis. These associations with BMI and DM were also seen in MASLD and ALD groups (Table 3). Overall, the results indicate that both BMI and DM are important predictors of both significant fibrosis and CSF with steatohepatitis across all groups, with DM demonstrating a consistently strong association.
Associations between BMI and diabetes mellitus and clinically significant fibrosis among MetALD, MASLD, and ALD.
| Significant fibrosis | ||||
|---|---|---|---|---|
| Univariate | Multivariable | |||
| OR (95 % CI)a | P value | OR (95 % CI)a | P value | |
| MetALD | ||||
| BMI (continuous) | 1.12 (1.06-1.19) | <0.01 | 1.15 (1.08-1.23) | <0.01 |
| Diabetes mellitus (yes) | 2.6 (1.2-5.7) | <0.01 | 3.0 (1.06-6.2) | <0.01 |
| MASLD | ||||
| BMI (continuous) | 1.11 (1.09-1.14) | <0.01 | 1.13 (1.11-1.15) | <0.01 |
| Diabetes mellitus (yes) | 2.3 (1.6-3.3) | <0.01 | 2.8 (1.9-4.4) | <0.01 |
| ALD | ||||
| BMI (continuous) | 1.08 (1.02-1.14) | <0.01 | 1.12 (1.07-1.17) | <0.01 |
| Diabetes mellitus (yes) | 3.2 (1.5-6.7) | <0.01 | 3.1 (1.5-6.6) | <0.01 |
Associations between BMI and diabetes mellitus and presence of clinically significant fibrosis with steatohepatitis among MetALD, MASLD, and ALD. Results based on logistic regression analysis.
| Clinically significant fibrosis with steatohepatitis | ||||
|---|---|---|---|---|
| Univariate | Multivariable | |||
| OR (95 % CI)a | P value | OR (95 % CI)a | P value | |
| MetALD | ||||
| BMI (continuous) | 1.11 (1.04-1.19) | <0.01 | 1.14 (1.07-1.22) | <0.01 |
| Diabetes mellitus (yes) | 2.1 (1.2-5.1) | 0.04 | 2.3 (1.1-7.9) | 0.03 |
| MASLD | ||||
| BMI (continuous) | 1.07 (1.04-1.10) | <0.01 | 1.08 (1.06-1.11) | <0.01 |
| Diabetes mellitus (yes) | 1.7 (1.2-2.6) | 0.01 | 2.5 (1.7-3.8) | <0.01 |
| ALD | ||||
| BMI (continuous) | 1.05 (1.01-1.11) | 0.04 | 1.05 (1.01-1.10) | 0.02 |
| Diabetes mellitus (yes) | 2.6 (1.2-5.7) | 0.02 | 2.8 (1.4-6.7) | 0.02 |
Previous studies have reported varying prevalences of MetALD, ranging from 1 % to 8 % [6,9,21–23]. These differences in prevalence rates can also be attributed to data derived from diverse populations, as well as the use of various methods and thresholds for estimating hepatic steatosis [6,9,12,21,22]. Additionally, the exclusion strategies employed to create the groups for analysis also contribute to these varying prevalence rates [6,9,12,21,22]. In this study, we identified the prevalence of MetALD as 4 % using a database representative of the U.S. population using CAP to define the presence of hepatic steatosis. This prevalence rate is in line with the two recently reported studies using NHANES database with minor differences related to CAP cut-offs used to define the presence of hepatic steatosis [21,22].
The current analysis highlights significant variations in demographic characteristics, BMI, DM prevalence, and smoking habits among the three cohorts, with distinct clinical profiles for each group. MetALD individuals were younger compared to MASLD and ALD, with a higher proportion of males. No significant differences were observed in racial/ethnic distribution across the cohorts. MetALD individuals had a lower prevalence of higher categories of BMI and central obesity. The prevalence of DM was lower in MetALD compared to MASLD but higher than ALD. The MetALD cohort demonstrated lipid characteristics that were intermediate compared to MASLD and ALD. Total cholesterol levels in MetALD were higher than in MASLD but lower than in ALD. Triglyceride levels in MetALD were elevated compared to MASLD and ALD, though this difference was not statistically significant. Interestingly, HDL levels in MetALD were similar to MASLD but significantly lower than ALD. These findings suggest that MetALD individuals exhibit lipid profiles reflective of both metabolic dysfunction and alcohol-related effects, highlighting the distinct and complex interplay of these factors in this subgroup.
Since MetALD is a newly proposed term, data about this group of patients are scarce. However, accumulating evidence indicates a worse prognosis and more severe liver disease compared to MASLD alone. However, in the current study, individuals with MetALD showed lower LSM values and lower prevalence of significant fibrosis (LSM ≥8 kPa) and advanced fibrosis (LSM ≥12 kPa) compared to MASLD and ALD. The proportion of individuals with CSF and steatohepatitis, as assessed by FAST scores, was also lower in MetALD than in ALD but slightly higher than MASLD. FIB-4 scores (≥2.67) indicating advanced fibrosis were uncommon in MetALD, with lower prevalence than MASLD and ALD. These findings suggest that individuals with MetALD may have a less severe fibrosis burden than MASLD and ALD, emphasizing the potential heterogeneity in liver disease progression within this subgroup. These findings are in contrast to prior studies that reported an increased risk of advanced fibrosis and liver-related events in those with MetALD [9–12]. The discrepancy between less severe in fibrosis observed in our study and the higher risk for liver and overall adverse outcomes reported in the prior studies is interesting. One study from Spain suggested that even moderate alcohol intake in those with MASLD is associated with an increased risk of advanced disease to a level similar to that observed in MetALD [24]. It is possible that the MASLD cohort in the USA is different from the Spanish cohort in the amount of alcohol consumption. Alternatively, we speculate that MetALD patients may have an accelerated natural history at an advanced age. Finally, the small sample size of MetALD limits statistical power, increasing the risk of random variation and reducing the robustness of conclusions. This and the fact that NHANES was not designed to assess liver fibrosis risk in MetALD underscores the need for cautious interpretation. Therefore, it is possible that we failed to observe the increased severity of liver disease in the MetALD group due to the younger age group. We do not think our analysis is flawed since similar findings using slightly different LSM cut-offs for defining clinically significant fibrosis and advanced fibrosis by a separate group of investigators in the same NHANES database also reported a lower prevalence of CSF and advanced fibrosis in the MetALD group compared to MASLD [21].
In the current study, we used LSM cut-offs of 8 kPa and 12kPa, unlike the cut-offs used by Kalligeros M et al. for the identification of CSF (>8.6 kPa) and advanced fibrosis (>13.1 kPa), respectively [21]. Our rationale for using 8kPa for significant fibrosis and 12kPa for advanced fibrosis is based on the cut-offs suggested in the recent guidance on MASLD for referral from primary care to specialized hepatology care [4,18,19]. Nevertheless, irrespective of the cut-offs used and slightly different prevalence rates, both analyses show a lower prevalence of significant fibrosis and advanced fibrosis in MetALD than in MASLD. The levels of FIB4, a blood-based biomarker of fibrosis, also reinforce this observation.
Higher BMI and DM were significant risk factors for the presence of significant fibrosis and CSF with steatohepatitis across patients with MASLD, MetALD, and ALD. This trend was reported in prior studies in SLD and MASLD [21,23]. The current study delves deeper and highlights the commonality of these risk factors across the spectrum of SLD. This analysis is critical to better understanding the unique features of MetALD and informing targeted management strategies for this heterogeneous and complex condition. Both DM and obesity are modifiable risk factors and are amenable to interventions through lifestyle and therapeutic options. Current management strategies for obesity include targeting at least 5 % body weight loss, adopting a Mediterranean diet, engaging in regular exercise, and, in selected cases, considering bariatric surgery, which is also recommended for the treatment of MASLD. Additionally, glucagon-like peptide-1 (GLP-1) receptor agonists or GLP-1/glucose-dependent insulinotropic polypeptide coagonists are prescribed in cases of obesity or diabetes. These treatments address comorbidities and have shown potential benefits for liver health, supporting their encouragement in clinical practice.
A few aspects of the current study need further clarification. Some characteristics of the disease definitions may not be critically evaluated, as they are based on a self-report system. Notably, 25 % of MASLD patients tended to underestimate their alcohol consumption [25]. Furthermore, there is some suggestion that there is a supra-additive effect of cumulative alcohol consumption. For instance, Marti-Aguado et al. found that even low levels of alcohol consumption increased the risk of significant fibrosis, while moderate alcohol consumption doubled the risk of developing significant fibrosis in patients with MASLD [24]. Additionally, the presence of multiple cardiometabolic risk factors also cumulatively increased the risk of significant fibrosis [24]. Therefore, the inconsistencies in the data regarding the impact of alcohol consumption on the severity of the metabolic disease must be considered in line with the characteristics of the studied group. Another modifiable characteristic we did not address systematically was the relationship between smoking and MetALD. The smoking status distribution in the MetALD cohort showed intermediate characteristics between MASLD and ALD. In the current study, former smokers were more common in MetALD than MASLD, with rates similar to ALD. Current smoking rates in MetALD were slightly higher than MASLD but significantly lower than ALD. These findings suggest that smoking, particularly current and former smoking, may contribute to the heterogeneity in the MetALD population, reflecting its overlapping characteristics with both MASLD and ALD.
5ConclusionsOur study demonstrated a prevalence of MetALD at 4 %, slightly higher than prior studies. The fibrosis severity of MetALD was the lowest among the three groups of SLD and was associated with increased BMI and the presence of DM. These two modifiable factors were also associated with the severity of liver disease in MASLD and ALD. The current findings provide some rationale for implementing strategies aimed at weight loss and improved diabetes management, but further studies are necessary to demonstrate the benefit of such interventions.
Author contributionsEda Kaya: Conceptualization, literature review, manuscript drafting, and critical revision. Eduardo Vilar-Gomez: Data collection, methodology development, statistical analysis, data validation, and manuscript review. Raj Vuppalanchi: Interpretation of results, manuscript drafting, and literature review, manuscript editing, and final manuscript approval. Yusuf Yilmaz: figure preparation, manuscript editing, and final manuscript approval.
FundingThis research did not receive any specific grant from funding agencies in the public, commercial, or not-for-profit sectors.


