


Non-alcoholic fatty liver disease (NAFLD) is multistage with heterogeneous outcomes. We studied the influence of insulin resistance (IR) on the hepatic transcriptome of early NAFLD stages, to understand disease development.
Materials and methodsIn this cross-sectional study, possible clinicopathological risk factors were compared between mild-NAFL (N = 72) and non-alcoholic steatohepatitis (NASH; N = 51) patients. Liver tissue-transcriptome difference was studied between a subset of 25 mild-NAFL and 20 NASH biopsies and validated on another subset of 12 mild-NAFL and 13 NASH biopsies, using RT-PCR. The relationship between IR driven gene expression changes with fibrosis in NASH was investigated.
ResultsSignificantly higher weight (p = 0.005) and elevated levels of HbA1c (p = 0.009), FBG (p = 0.03) and HOMA-IR (p = 0.009) were found in NASH patients. Five differentially expressed genes (DEGs, fold change > 1.5) were identified in NASH-FABP4, FABP5L2, CD24, PRAP1, and SPP1. The DEGs were positively associated with disease severity and HOMA-IR, and were found to be efficient classifiers of mild-NAFL and NASH. Additional 1218 genes identified related to IR (IrCGs), which can classify NASH-with-fibrosis patients separately from mild-NAFL and NASH patients. IrCGs can promote intra-hepatic fat accumulation, dysregulation of the lipid metabolism, lipotoxicity, and activation of cell survival pathways including activation of cell proliferation and differentiation pathways.
ConclusionsHepatic expression of genes associated with insulin resistance may drive NAFLD development and progression.
Globally, Nonalcoholic Fatty Liver Disease (NAFLD) is one of the most prevalent chronic liver diseases, affecting 20–30% of the general population [1]. NAFLD is characterized by a spectrum of progressive stages with worsening prognosis, in the absence of excessive alcohol intake or any secondary causes of liver diseases. The disease spectrum encompasses abnormally increased fatty acid infiltration in hepatocytes (steatosis), fatty infiltration together with inflammation (Nonalcoholic steatohepatitis, NASH), fibrosis, cirrhosis, and Hepatocellular carcinoma (HCC) [2–4]. Steatosis can be benign but occasionally (∼30%) progress to NASH, which is a pathological stage and comorbid with end-stage liver diseases and cardiovascular diseases [5,6]. Current epidemiological studies estimated a two-fold to three-fold increase in the global prevalence of NASH related cirrhosis and end-stage liver disease by 2030 [7].
NAFLD is considered the hepatic manifestation of metabolic syndrome (MS) and is associated with insulin resistance (IR) [8]. A recent meta‐analysis reported that NASH patients exhibit >2-fold higher risk of T2DM (featured by insulin resistance) than those without NAFLD [9]. Past studies have indicated that NAFLD patients with IR possess a higher risk of NASH, fibrosis, and liver-related mortality [10].
Reduced physiological response to normal levels of insulin in the blood and decreased glucose utilization, are characteristics of IR. In spite of numerous studies conducted, the exact molecular mechanism describing the close relationship between NAFLD and IR is still debated. Key hypothetical mechanism suggests that systemic IR promotes adipose tissue dysfunction (causing reduced production of adipokine) and increased adipose tissue lipolysis (causing an increased influx of free fatty acids in the liver). As a consequence, increased de novo lipogenesis (DNL) and reduced very low density lipoprotein (VLDL) production can occur in hepatocytes, causing fat accumulation. Intermediate products of DNL can inhibit insulin signaling in the liver, further promoting hepatic insulin resistance [11]. Increased mitochondrial oxidation of fatty acids in hepatocytes, leads to mitochondrial dysfunction and development of oxidative-stress induced inhibition of insulin signaling in the liver and release of inflammatory cytokines (like TNF-α, IL-6). The inflammatory milieu created then can orchestrate a series of mechanisms leading to deranged hepatic lipid metabolism, tissue damage, more inflammation, and fibrosis. Moreover, additional to hepatic insulin resistance, insulin resistance in extra-hepatic tissues can contribute to NAFLD [11–13]. A recent study showed inhibition of insulin signaling in the brain may increase lipolysis and FFA level in blood and suppress lipid export from liver [14]. Thus development IR and NASH are interlinked and may involve derangements of both hepatic and extra-hepatic tissue functioning.
In the past decade, many studies have attempted to understand the molecular mechanism of NASH development and progression, by observing global transcriptomic changes in liver [15]. However, very few studies have looked into the effect of insulin sensitivity and IR on the transcriptomic changes in the early phase of the NAFLD spectrum. A detailed understanding of the bridge between IR and NASH is important for novel treatment strategies via breaking the connection. In this study, we aimed to investigate the molecular effects of hepatic transcriptomic changes, related to HOMA-IR in NASH development.
2Materials and methods2.1Ethical statementThe study was approved by the Institutional Ethical Committee of National Institute of Biomedical Genomics, Kalyani and followed the guidelines of the 1975 Declaration of Helsinki and its revisions. Informed consent was obtained from all individual participants included in the study.
2.2Patient selectionIn this cross-sectional study, participants were recruited from SSKM Hospital, Kolkata. The detailed case history was collected for each participant including demographic history, history of addiction, and history of medication and presence of other co-morbidities. Participants were recruited in this study following the inclusion criteria mentioned by Arendt et al. [16]. The presence of fatty liver was evaluated through whole abdomen ultrasonography and hepatic fat content (HFC) by Proton Magnetic Resonance Spectroscopy (H1-MRS) examination. Nonalcoholic fatty liver (NAFL) patients were defined as those having hepatic fat content >5% in H1-MRS examination [17,18]. Liver Stiffness measurement (LSM) was done using transient elastography (Fibroscan; Echosens, France) to assess the degree of fibrosis, following the manufacturers’ protocol.
Anthropometric measurements including weight, height, body mass index (BMI = weight [kg]/height [m] [2]), and waist circumference were done for each patient. After 12 h of fasting, blood samples were collected for biochemical investigations. Lipid profile (total cholesterol (TC), serum triglyceride (TG), low-density lipoprotein (LDL), high-density lipoprotein (HDL), VLDL, liver function test (alanine transaminase (ALT), aspartate transaminase (AST), gamma-glutamyl transferase (GGT), alkaline phosphatase (SAP) and diabetic profile (fasting blood sugar (FBG), fasting insulin (FI), HbA1c) were measured, according to standard procedures [16]. Insulin sensitivity was estimated using the homeostasis model of insulin resistance (HOMA-IR) [19,20]. Individuals having HOMA-IR >2.5, were defined as insulin resistant [21].
2.3Liver biopsy and histological assessment of NAFLDLiver tissue samples (2 cm) were collected using percutaneous needle biopsy from NAFLD patients, only once with informed consent. Part of the tissues was immediately preserved in RNALater stabilization solution (ThermoFisher) to prevent degradation of tissue RNA. Histological evaluation was performed according to the protocol mentioned in Brunt et al. 2011, by a single clinician, blinded to the experiment. Disease severity was determined using the NAFLD Activity Score (NAS), which is the sum of steatosis score, hepatocyte ballooning, and lobular inflammation score [22,23]. The degree of fibrosis was assessed through fibrosis score.
2.4Gene expression studyRecruited patients were grouped into mild-NAFL (with HFC > 5% in H1-MRS examination and/or NAS 0 and 1, n = 72) and NASH (with HFC > 5% in H1-MRS examination and/or NAS 4 and 5, n = 51) (Table 1). Our study did not include any patient with NAS > 5, thus focusing on the initial stages of NAFLD spectrum. Liver tissue transcriptome was studied in a subgroup of 48 patients (discovery cohort; 28 mild-NAFL and 20 NASH) (Table 1).
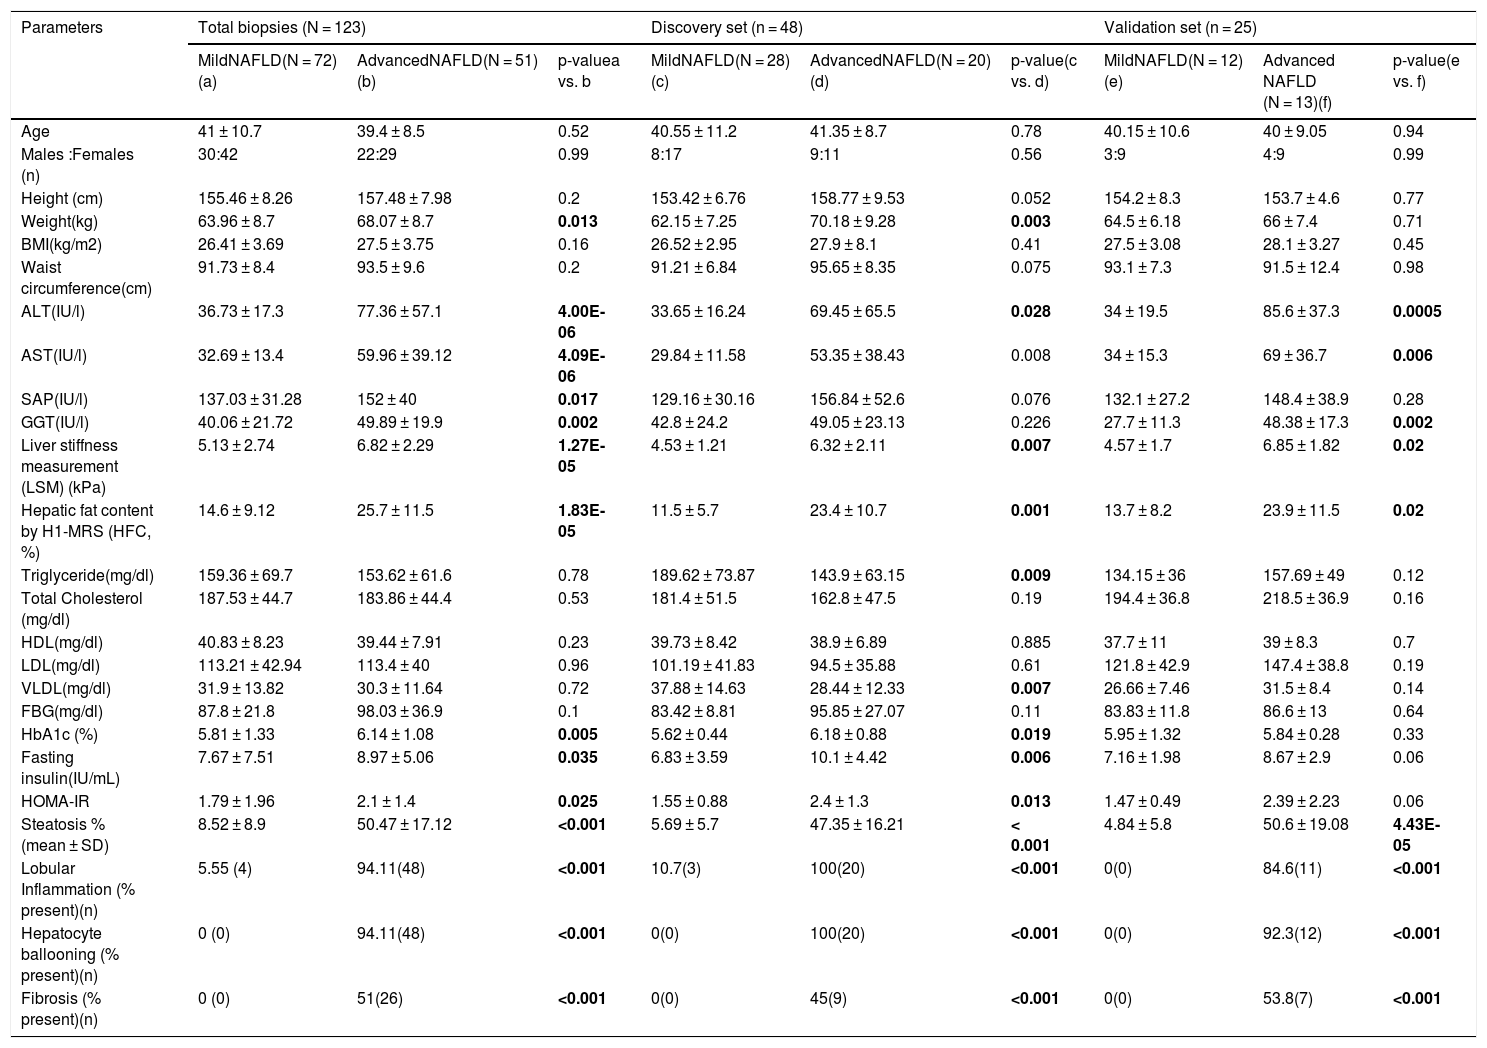
Characteristics of mild and advanced NAFLD patients.
| Parameters | Total biopsies (N = 123) | Discovery set (n = 48) | Validation set (n = 25) | ||||||
|---|---|---|---|---|---|---|---|---|---|
| MildNAFLD(N = 72) (a) | AdvancedNAFLD(N = 51) (b) | p-valuea vs. b | MildNAFLD(N = 28) (c) | AdvancedNAFLD(N = 20) (d) | p-value(c vs. d) | MildNAFLD(N = 12)(e) | Advanced NAFLD (N = 13)(f) | p-value(e vs. f) | |
| Age | 41 ± 10.7 | 39.4 ± 8.5 | 0.52 | 40.55 ± 11.2 | 41.35 ± 8.7 | 0.78 | 40.15 ± 10.6 | 40 ± 9.05 | 0.94 |
| Males :Females (n) | 30:42 | 22:29 | 0.99 | 8:17 | 9:11 | 0.56 | 3:9 | 4:9 | 0.99 |
| Height (cm) | 155.46 ± 8.26 | 157.48 ± 7.98 | 0.2 | 153.42 ± 6.76 | 158.77 ± 9.53 | 0.052 | 154.2 ± 8.3 | 153.7 ± 4.6 | 0.77 |
| Weight(kg) | 63.96 ± 8.7 | 68.07 ± 8.7 | 0.013 | 62.15 ± 7.25 | 70.18 ± 9.28 | 0.003 | 64.5 ± 6.18 | 66 ± 7.4 | 0.71 |
| BMI(kg/m2) | 26.41 ± 3.69 | 27.5 ± 3.75 | 0.16 | 26.52 ± 2.95 | 27.9 ± 8.1 | 0.41 | 27.5 ± 3.08 | 28.1 ± 3.27 | 0.45 |
| Waist circumference(cm) | 91.73 ± 8.4 | 93.5 ± 9.6 | 0.2 | 91.21 ± 6.84 | 95.65 ± 8.35 | 0.075 | 93.1 ± 7.3 | 91.5 ± 12.4 | 0.98 |
| ALT(IU/l) | 36.73 ± 17.3 | 77.36 ± 57.1 | 4.00E-06 | 33.65 ± 16.24 | 69.45 ± 65.5 | 0.028 | 34 ± 19.5 | 85.6 ± 37.3 | 0.0005 |
| AST(IU/l) | 32.69 ± 13.4 | 59.96 ± 39.12 | 4.09E-06 | 29.84 ± 11.58 | 53.35 ± 38.43 | 0.008 | 34 ± 15.3 | 69 ± 36.7 | 0.006 |
| SAP(IU/l) | 137.03 ± 31.28 | 152 ± 40 | 0.017 | 129.16 ± 30.16 | 156.84 ± 52.6 | 0.076 | 132.1 ± 27.2 | 148.4 ± 38.9 | 0.28 |
| GGT(IU/l) | 40.06 ± 21.72 | 49.89 ± 19.9 | 0.002 | 42.8 ± 24.2 | 49.05 ± 23.13 | 0.226 | 27.7 ± 11.3 | 48.38 ± 17.3 | 0.002 |
| Liver stiffness measurement (LSM) (kPa) | 5.13 ± 2.74 | 6.82 ± 2.29 | 1.27E-05 | 4.53 ± 1.21 | 6.32 ± 2.11 | 0.007 | 4.57 ± 1.7 | 6.85 ± 1.82 | 0.02 |
| Hepatic fat content by H1-MRS (HFC, %) | 14.6 ± 9.12 | 25.7 ± 11.5 | 1.83E-05 | 11.5 ± 5.7 | 23.4 ± 10.7 | 0.001 | 13.7 ± 8.2 | 23.9 ± 11.5 | 0.02 |
| Triglyceride(mg/dl) | 159.36 ± 69.7 | 153.62 ± 61.6 | 0.78 | 189.62 ± 73.87 | 143.9 ± 63.15 | 0.009 | 134.15 ± 36 | 157.69 ± 49 | 0.12 |
| Total Cholesterol (mg/dl) | 187.53 ± 44.7 | 183.86 ± 44.4 | 0.53 | 181.4 ± 51.5 | 162.8 ± 47.5 | 0.19 | 194.4 ± 36.8 | 218.5 ± 36.9 | 0.16 |
| HDL(mg/dl) | 40.83 ± 8.23 | 39.44 ± 7.91 | 0.23 | 39.73 ± 8.42 | 38.9 ± 6.89 | 0.885 | 37.7 ± 11 | 39 ± 8.3 | 0.7 |
| LDL(mg/dl) | 113.21 ± 42.94 | 113.4 ± 40 | 0.96 | 101.19 ± 41.83 | 94.5 ± 35.88 | 0.61 | 121.8 ± 42.9 | 147.4 ± 38.8 | 0.19 |
| VLDL(mg/dl) | 31.9 ± 13.82 | 30.3 ± 11.64 | 0.72 | 37.88 ± 14.63 | 28.44 ± 12.33 | 0.007 | 26.66 ± 7.46 | 31.5 ± 8.4 | 0.14 |
| FBG(mg/dl) | 87.8 ± 21.8 | 98.03 ± 36.9 | 0.1 | 83.42 ± 8.81 | 95.85 ± 27.07 | 0.11 | 83.83 ± 11.8 | 86.6 ± 13 | 0.64 |
| HbA1c (%) | 5.81 ± 1.33 | 6.14 ± 1.08 | 0.005 | 5.62 ± 0.44 | 6.18 ± 0.88 | 0.019 | 5.95 ± 1.32 | 5.84 ± 0.28 | 0.33 |
| Fasting insulin(IU/mL) | 7.67 ± 7.51 | 8.97 ± 5.06 | 0.035 | 6.83 ± 3.59 | 10.1 ± 4.42 | 0.006 | 7.16 ± 1.98 | 8.67 ± 2.9 | 0.06 |
| HOMA-IR | 1.79 ± 1.96 | 2.1 ± 1.4 | 0.025 | 1.55 ± 0.88 | 2.4 ± 1.3 | 0.013 | 1.47 ± 0.49 | 2.39 ± 2.23 | 0.06 |
| Steatosis % (mean ± SD) | 8.52 ± 8.9 | 50.47 ± 17.12 | <0.001 | 5.69 ± 5.7 | 47.35 ± 16.21 | < 0.001 | 4.84 ± 5.8 | 50.6 ± 19.08 | 4.43E-05 |
| Lobular Inflammation (% present)(n) | 5.55 (4) | 94.11(48) | <0.001 | 10.7(3) | 100(20) | <0.001 | 0(0) | 84.6(11) | <0.001 |
| Hepatocyte ballooning (% present)(n) | 0 (0) | 94.11(48) | <0.001 | 0(0) | 100(20) | <0.001 | 0(0) | 92.3(12) | <0.001 |
| Fibrosis (% present)(n) | 0 (0) | 51(26) | <0.001 | 0(0) | 45(9) | <0.001 | 0(0) | 53.8(7) | <0.001 |
The bold p-values indicate significant difference between study groups, for a particular parameter.
Total RNA was extracted from biopsy samples with AllPrep DNA/RNA/Protein Mini Kit (Qiagen). RNA quality and concentration were assessed with an Agilent BioAnalyzer (Santa Clara, CA) and a spectrophotometer. RNA samples with RNA integrity number (RIN > 7) were included in the study. Around 500 ng of RNA was taken from each sample for gene expression assay. Whole genome gene expression (WGGEX) data was generated on 48 liver tissue samples by microarray hybridization on IlluminaHumanHT-12 v4 Expression Beadchip arrays, using Whole-genome Gene DASL HT Assay (Illumina, Inc., San Diego, CA). WGGEX experiment was done strictly following manufacturer’s protocol. The raw signal intensity was scanned using the iScan platform (Illumina, Inc., San Diego, CA) and the raw expression data was retrieved using Genome Studio software (Illumina, Inc., San Diego, CA).
2.5Data analysisData quality control and identification of differentially expressed genes (DEGs) were done using “Limma” Bioconductor package version 3.32.5 [24]. The data was normalized using a quantile normalization approach. Post-normalization one sample was found to have low quality and was removed from the study. The data was quality controlled to remove probes with low detection p-value. Multidimensional Scaling plots were constructed to observe the relationship between the samples and 3 outliers were removed.
Our final expression data included 26,423 probes and 44 samples, which was used for further analyses. The data was further corrected for batch effects. All the analyses and visualizations were performed on log2-transformed data. Linear modeling was performed to identify DEGs between mild-NAFL and NASH samples.
2.6ValidationValidation of the top-ranked DEGs was done on 25 independent samples, included in the validation cohort (mild-NAFL; N = 12 and NASH; N = 13) (Table 1). cDNA was synthesized from 1 µg of initial RNA sample using High Capacity cDNA Reverse Transcription kit (Applied Biosystems). 1 µl of cDNA sample was used for real-time polymerase chain reaction (RT-PCR) experiment using SYBR Green method in a total reaction volume of 10 µl. Expression level of GAPDH gene was used as internal control. The reactions were run in triplicates. The primer sequences are available on request.
Differential expressions of top DEGs associated with NAFLD severity, were further validated using three publicly available transcriptome data on NAFLD [16,25,26]: (1) GSE48452 (including healthy obese (n = 27), simple steatosis (n = 14), NASH (n = 18)) [27], (2) GSE89632 (including healthy samples (n = 24), simple steatosis (n = 20), NASH (n = 19)) [28], and (3) GSE49541 (40 mild fibrosis and 32 severe fibrosis liver tissue samples) [29]. The data was downloaded from the Gene Expression Omnibus (GEO) database, using “GEOquery” bioconductor package [30]. Clinical information on BMI, HbA1c and HOMA-IR of the samples included in GSE89632 dataset, was downloaded from GEO database [28].
2.7Identification of gene signature correlated with HOMA-IRCorrelations between HOMA-IR levels and the whole genome gene expression levels were observed, among the patients in the discovery cohort. The gene set, significantly correlating with HOMA-IR, was defined as Insulin resistance correlated genes (IrCGs) (Supplementary Fig. 2). A significant association of IrCGs with insulin resistance was further assessed through logistic regression, after adjustment for age, gender, and BMI.
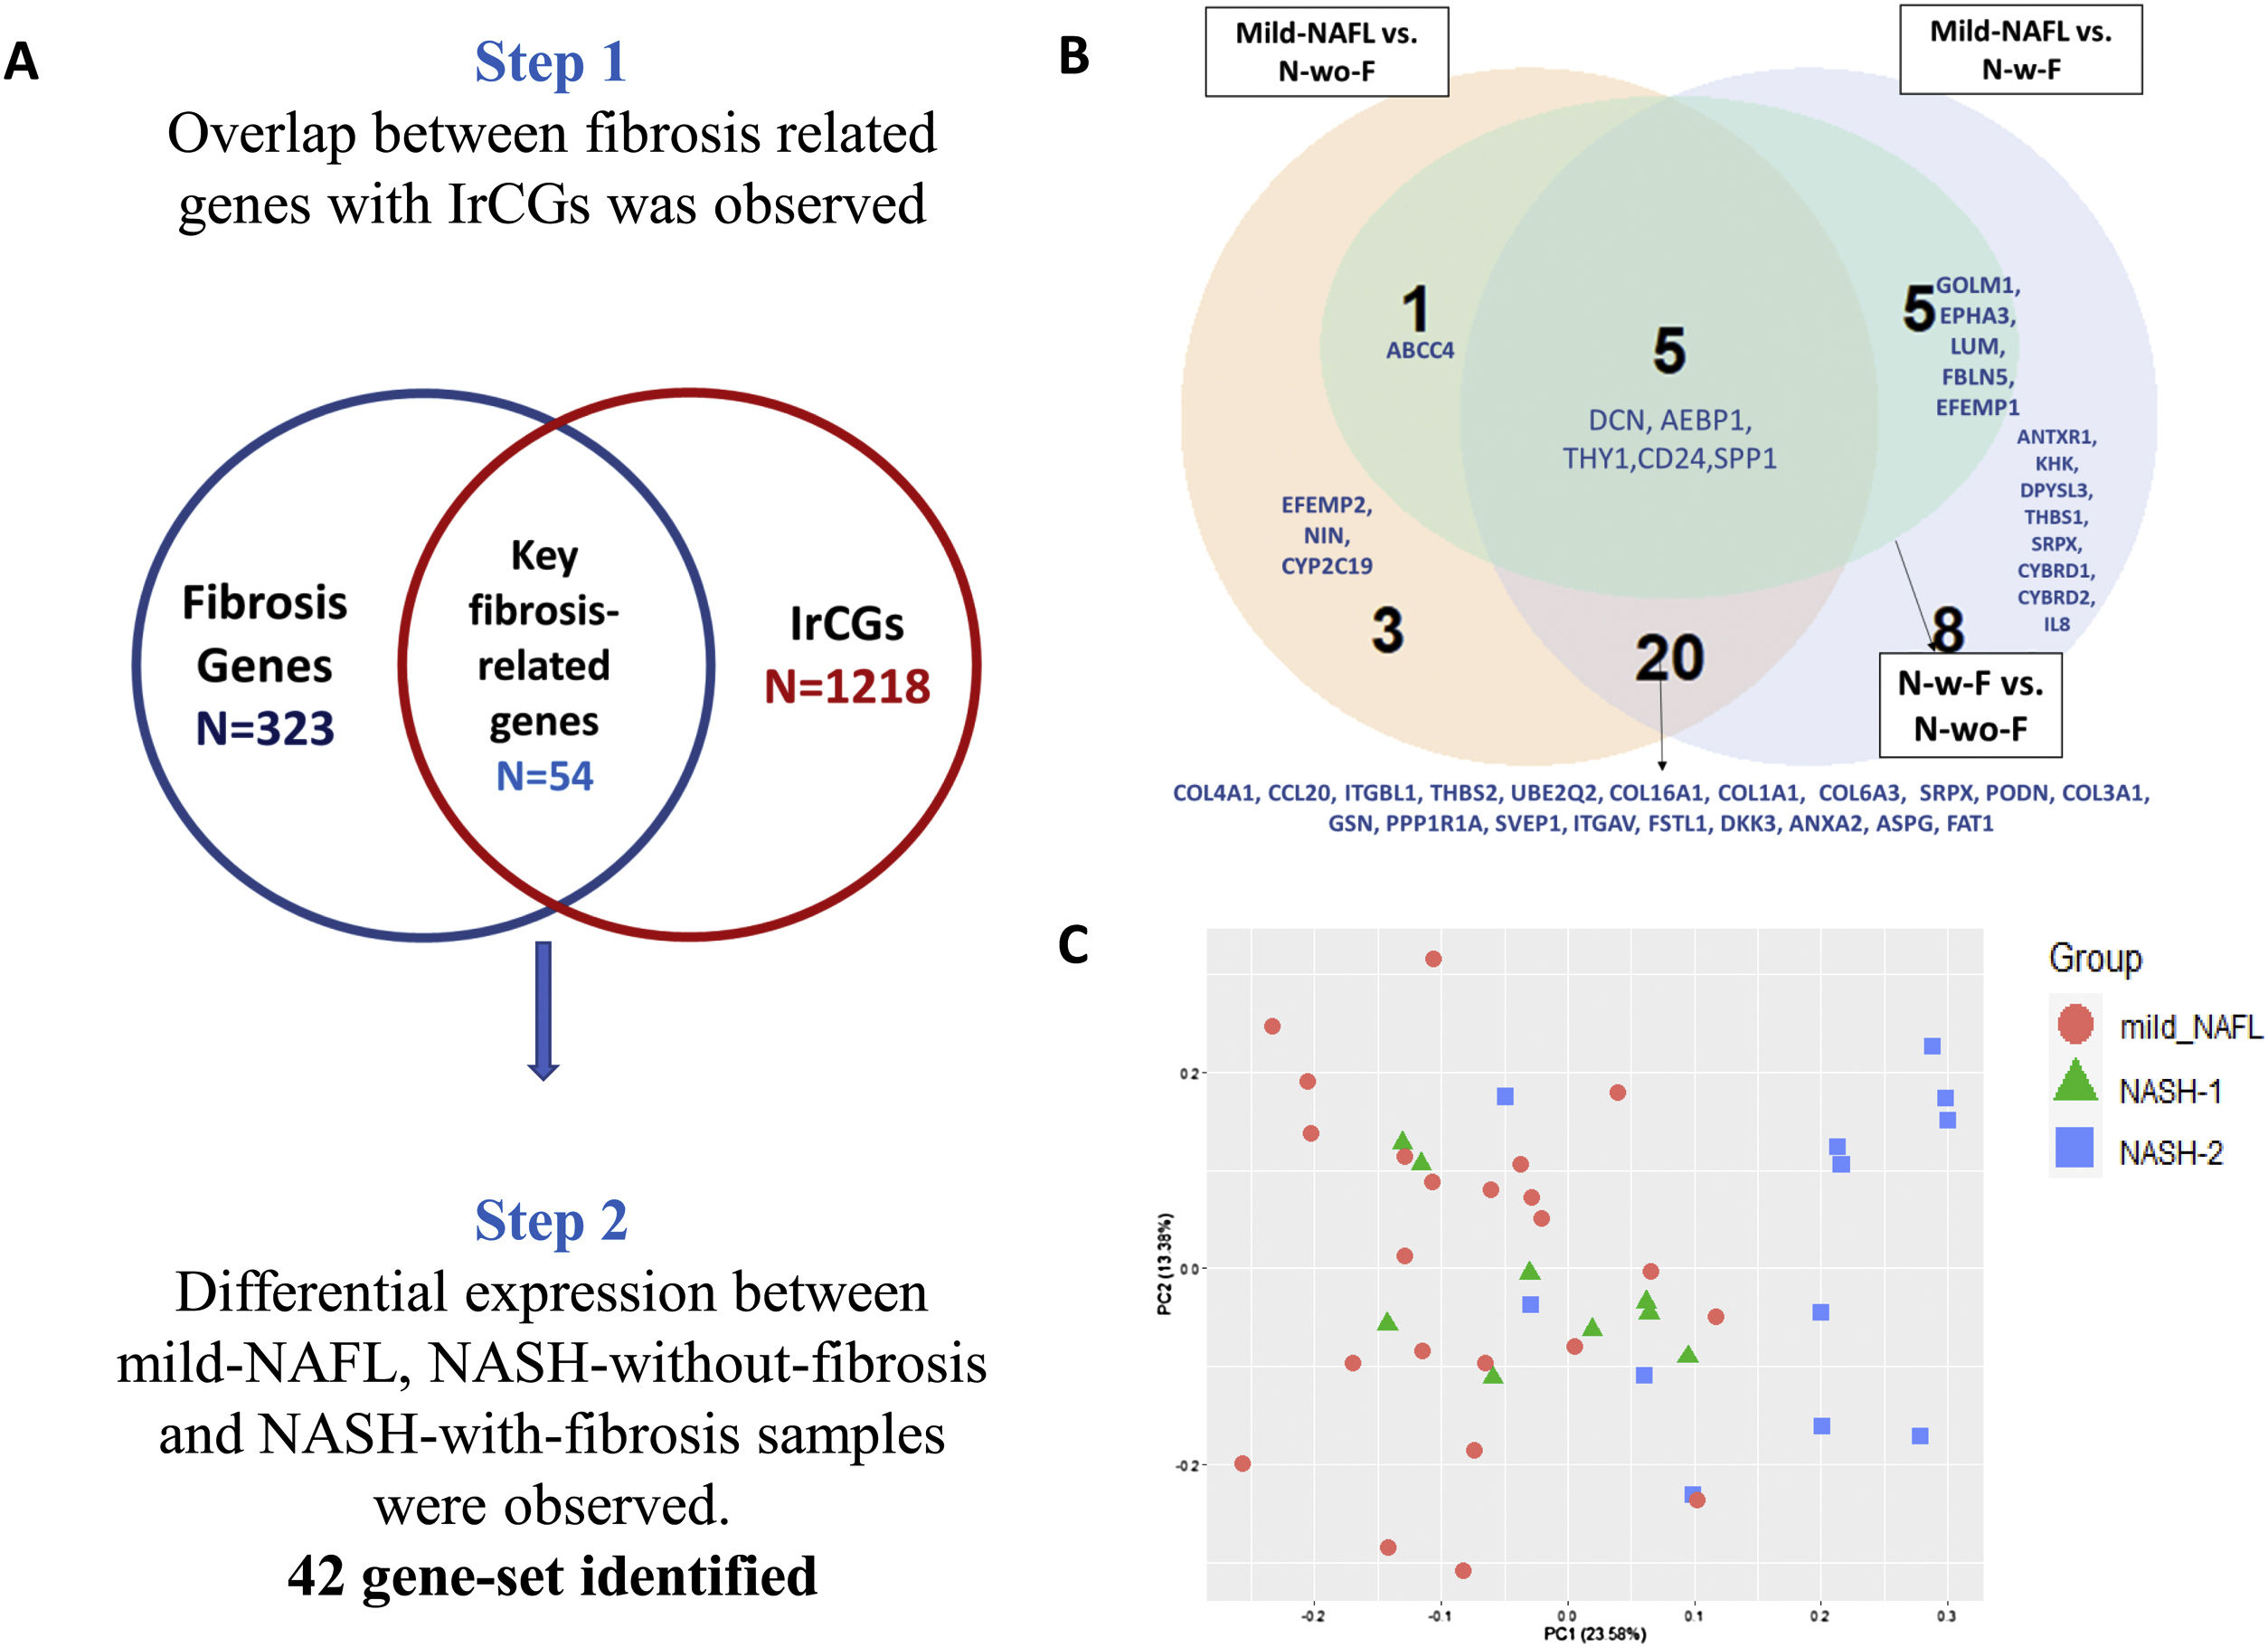
2.8Identification of gene signature associated with fibrosisIn our transcriptome study, 35 % of NASH patients (n = 7) had fibrosis score >0 (Table 1). To study expression changes associated with fibrosis development in NASH, we subdivided the NASH samples into NASH-without-fibrosis (“N-wo-F”; n = 13) and NASH-with-fibrosis (“N-w-F”; n = 7). A two-step analysis approach was taken. (1) A list of 323 genes associated with liver fibrosis, was prepared from three published studies [26,31,32]. The overlap between fibrosis-related genes set with 1218 IrCGs, identified 54 key genes, related to both HOMA-IR and fibrosis (Fig. 4b). (2) Differential expressions of 54 key fibrosis-related genes among mild-NAFL (n = 24), NASH-with-fibrosis (N-w-f, fibrosis score >0, n = 7) and NASH-without-fibrosis (N-wo-f, n = 13), were observed.
2.9Statistical analysesAnthropometric and biochemical parameters between groups were compared using non-parametric one-way Wilcoxon-Signed Rank test. Categorical variables were compared using χ [2] or Fishers exact test. Differentially expressed genes (DEGs) were identified by one-way analysis of variance (ANOVA) with a Benjamini-Hochberg False Discovery Rate (BH-FDR) correction, at a significance level of α = 0.05 and satisfied a threshold of |fold change| > 1.5 [16]. Relationships between clinical risk factors and gene expression were estimated by the Pearson’s correlation coefficient. Unless specifically mentioned, all analyses were performed using programs written in R version 3.2.2 [33].
2.10Bioinformatics analysisThe detailed functionality of a gene was studied using NCBI, Genecards and Uniprot online databases. Identification of proteins interacting with the DEGs was done using STRINGv11 database [34]. Pathway enrichment analysis among important gene sets was done using DAVID 6.8 [35].
3Results3.1Patient characteristicsOur study included 72 mild-NAFL patients and 51 NASH patients. No statistically significant (p-value > 0.05) differences in age and gender distributions were found between the two study groups (mild-NAFL and NASH) (Table 1). As reported in previous studies [16], NASH patients had significantly elevated HFC, elevated serum levels of liver damage markers (ALT, AST, GGT, and SAP), and higher liver stiffness than mild-NAFL patients (Table 1). Histological features of liver damage including hepatocyte ballooning and lobular inflammation were present in 94.11% (n = 48) and fibrosis was present in 51% (n = 26) of NASH patients (Table 1).
Patients with NASH had significantly higher weight (p-value = 0.005), fasting blood glucose (FBG) (p-value = 0.03) and HbA1c (p-value = 0.009) levels. HOMA-IR, which is a measure of insulin sensitivity, was also significantly higher among NASH patients than mild-NAFL patients (p-value = 0.009) (Table 1). 17.6% of NASH patients and 6.9% of mild-NAFL patients had insulin resistance (IR; HOMA-IR>2.5).
Clinical and histologic features of the mild-NAFL and NASH patients in the discovery (28 mild-NAFL patients and 20 NASH patients) and validation (12 mild-NAFL patients and 13 NASH patients) cohorts were comparable with each other and also with the total patient cohort (Table 1).
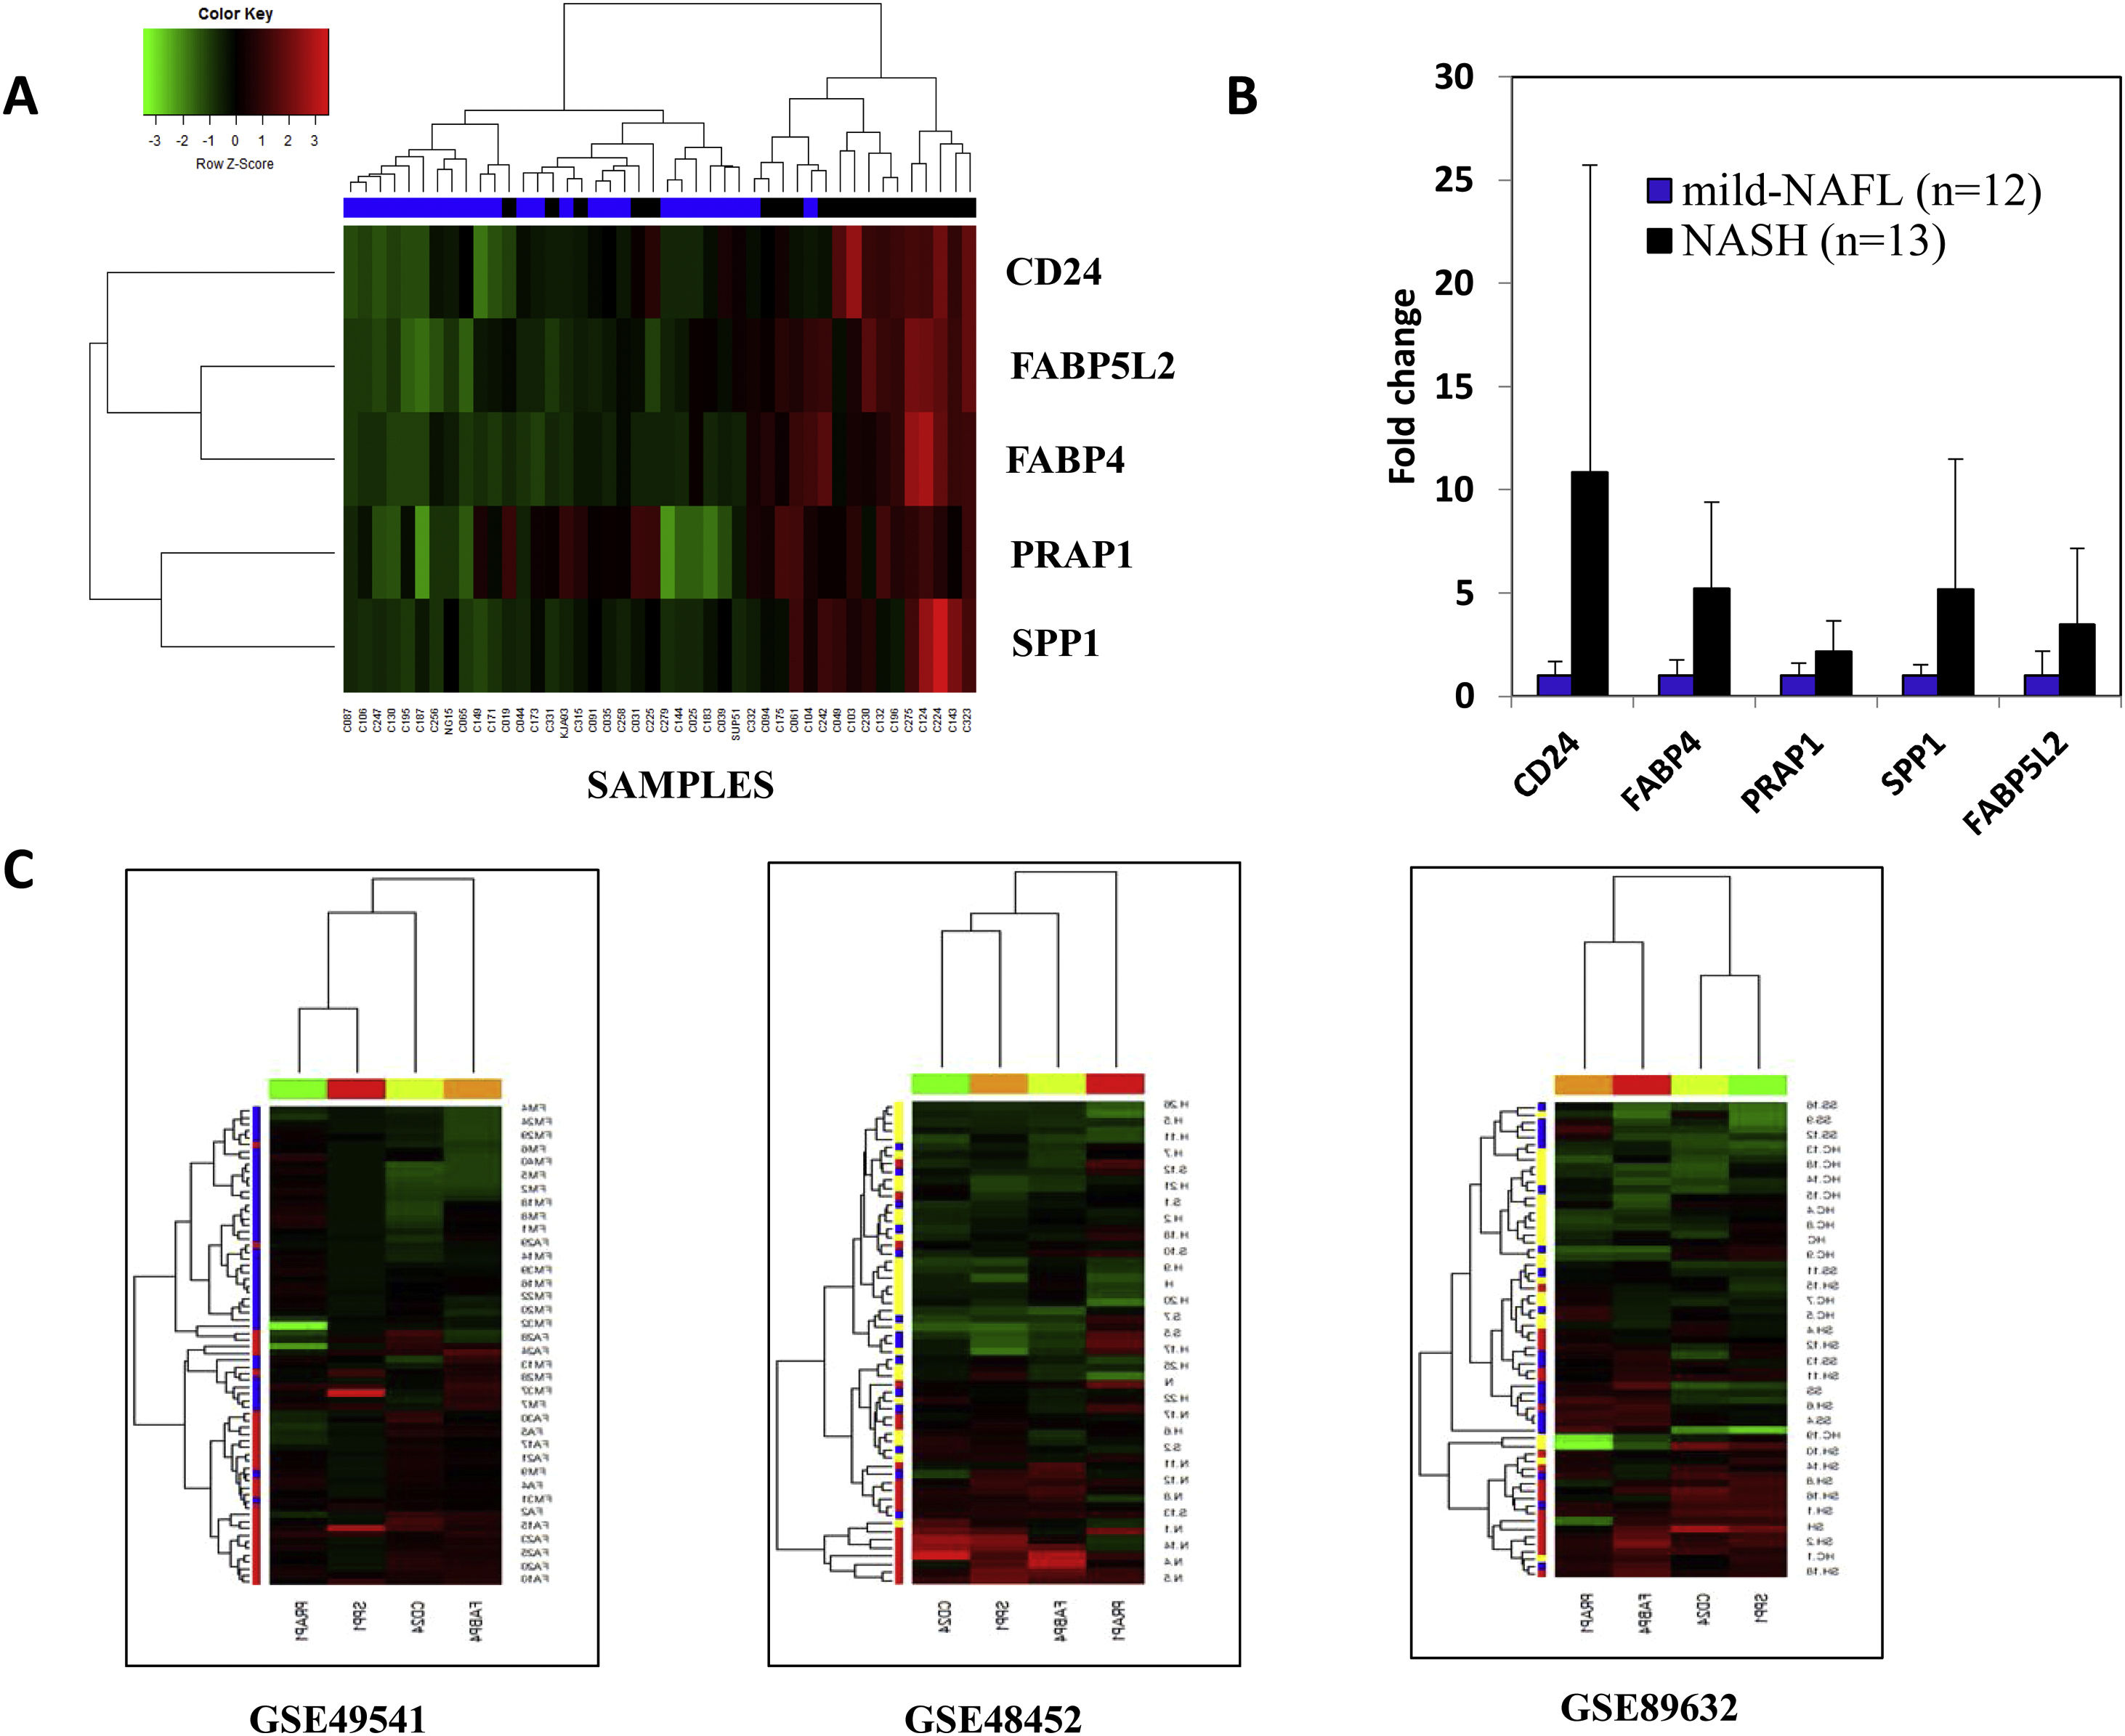
3.2Difference in hepatic transcriptome between mild-NAFL and NASHA total of 28 genes varied significantly between mild-NAFL (n = 24) and NASH (n = 20) patients (q-value < 0.05) (Supplementary Fig. 1a and Supplementary Table 1) in the discovery cohort. The expressions of 28 genes were highly correlated across samples, suggesting possible involvement in similar bioprocesses (Supplementary Fig. 1b). Among them, five DEGs (FABP4, FABP5L2, CD24, PRAP1, and SPP1) were significantly upregulated (with fold change >1.5) in NASH compared to mild-NAFL patients (Supplementary Fig. 1a). The associations of FABP4, CD24, and SPP1 with NAFLD have been previously reported [36]. Hierarchical clustering and discriminant function analysis showed that expression levels of these 5 DEGs can discriminate between the mild-NAFL and NASH with a correct classification rate of 84.09% (Fig. 1a). The significant upregulation of these 5 genes in NASH were further validated on a separate subgroup of 12 mild-NAFL and 13 NASH patients, using RT-PCR (Fig. 1b).
 Hierarchical clustering of the samples into two groups: mild-NAFL and NASH based on 5 genes with a fold change > 1.5. Blue indicates mild-NAFL samples and black indicates NASH samples. (B)Validation of the expressions of 5 DEGs on an independent cohort of 25 samples (12 mild-NAFL and 13 NASH samples). The p-values are indicated in boxes for expression of each gene. (C) Hierarchical clustering of the samples into study groups based on the identified DEGs in published datasets-GSE49541 (blue = mild fibrosis, red = advanced fibrosis samples), GSE48452 (yellow = healthy individuals, blue = simple steatosis and red = NASH patients) and GSE89632 (yellow = healthy individuals, blue = simple steatosis and red = NASH patients). Data is presented in heatmap format in which rows are the genes (probes) and columns are the samples. Red color corresponds to up-regulation and green color corresponds to down-regulation of gene expression.")
Differentially expressed genes between mild-NAFL and NASH.
(A) Hierarchical clustering of the samples into two groups: mild-NAFL and NASH based on 5 genes with a fold change > 1.5. Blue indicates mild-NAFL samples and black indicates NASH samples. (B)Validation of the expressions of 5 DEGs on an independent cohort of 25 samples (12 mild-NAFL and 13 NASH samples). The p-values are indicated in boxes for expression of each gene. (C) Hierarchical clustering of the samples into study groups based on the identified DEGs in published datasets-GSE49541 (blue = mild fibrosis, red = advanced fibrosis samples), GSE48452 (yellow = healthy individuals, blue = simple steatosis and red = NASH patients) and GSE89632 (yellow = healthy individuals, blue = simple steatosis and red = NASH patients). Data is presented in heatmap format in which rows are the genes (probes) and columns are the samples. Red color corresponds to up-regulation and green color corresponds to down-regulation of gene expression.
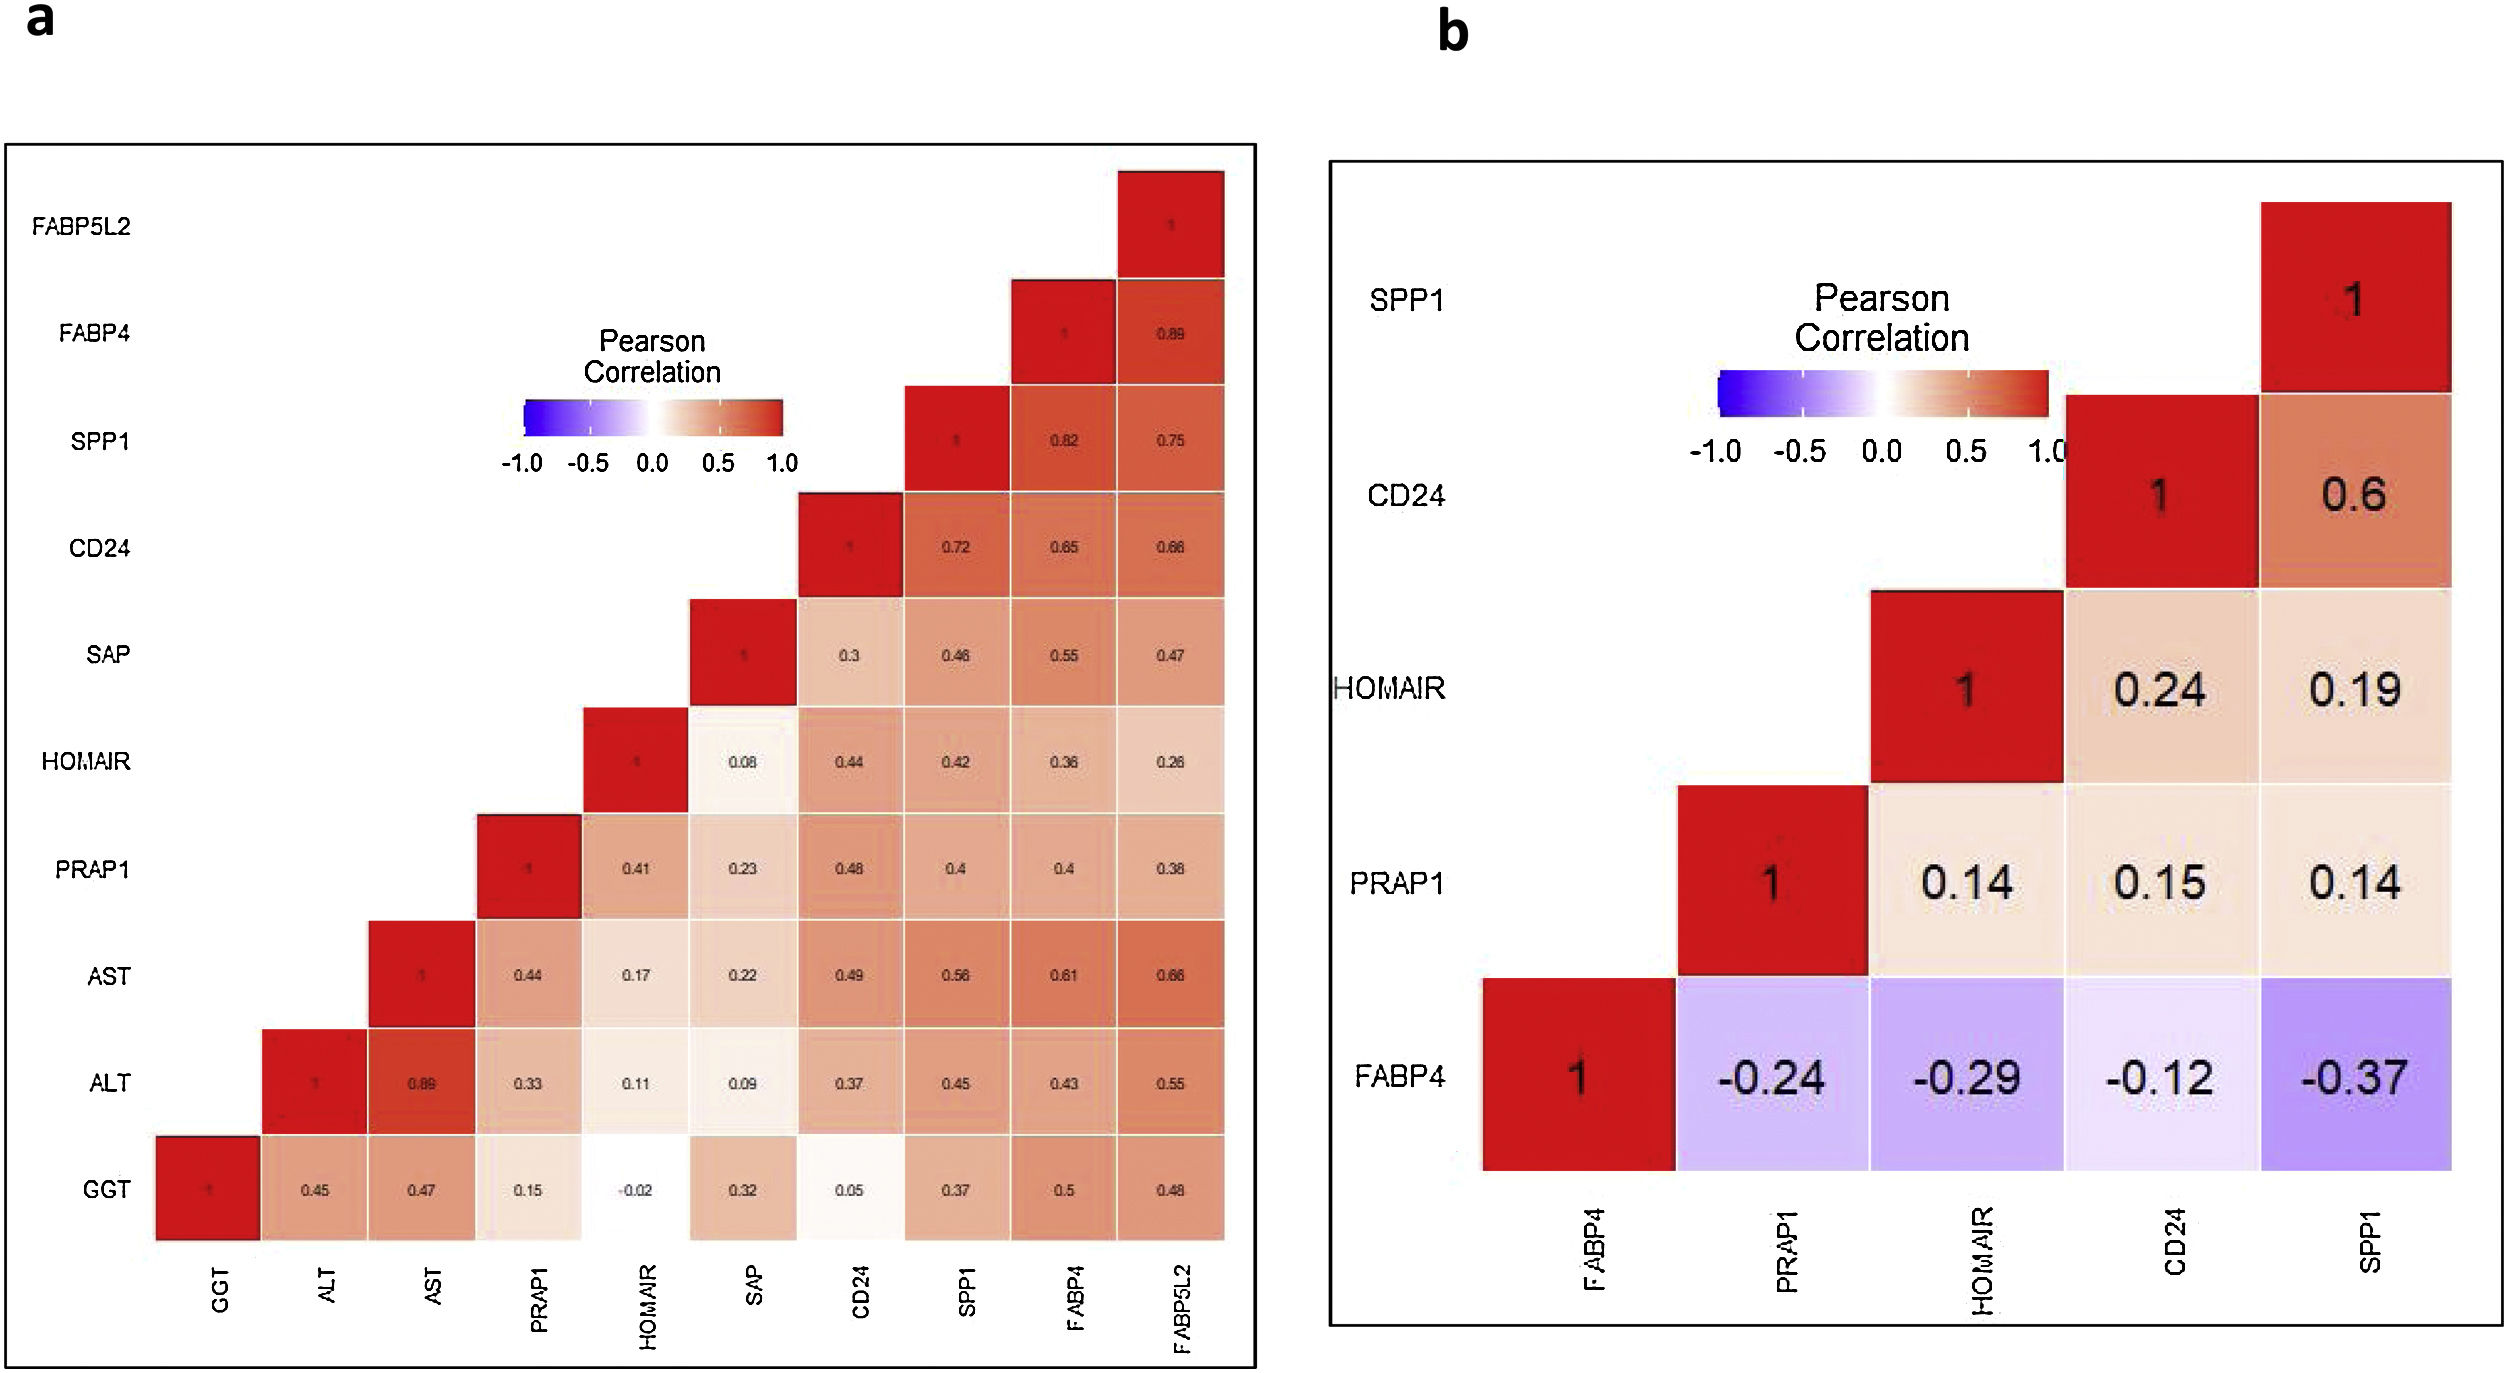
Positive correlations between the expression levels of 5 DEGs with serum liver damage markers (ALT, AST, GGT, SAP) were observed (Fig. 2a). A list of 40 proteins was identified which interact directly with FABP4, FABP5L2, CD24, PRAP1 and SPP1, using the STRINGv11 database [34]. Among them, CD36 (interacting in FABP4); NPL, PLAUR, ZNF511 (interacting with PRAP1) and FN1, ITGAV, TIMP1 (interacting with SPP1) showed significant altered expression in NASH compared to mild-NAFL samples (Supplementary Fig. 2).
 our study, (B) GSE89632. The abbreviations are listed as follows: HOMA-IR; Homeostatic model assessment of insulin resistance, ALT; alanine transaminase, AST; aspartate transaminase, GGT; gamma-glutamyltransferase, SAP; alkaline phosphatase.")
Correlations between 5 top-ranked differentially expressed genes and HOMA-IR.
Blue indicates negative correlation and red indicates positive correlation. (A) our study, (B) GSE89632. The abbreviations are listed as follows: HOMA-IR; Homeostatic model assessment of insulin resistance, ALT; alanine transaminase, AST; aspartate transaminase, GGT; gamma-glutamyltransferase, SAP; alkaline phosphatase.
We further validated the association of expression changes of the DEGs with the full spectrum of NAFLD severity, using three publicly available datasets (GSE48452, GSE89632, and GSE49541) [16,25–29]. The expression data on FABP5L2 gene was unavailable in these datasets. Hierarchical clustering of samples with the normalized expression values of the remaining 4 DEGs (FABP4, CD24, PRAP1 and SPP1) was done for each dataset. FABP4, CD24 and SPP1 genes were consistently over-expressed in: (1)NASH patients, compared to simple steatosis patients and healthy controls (in GSE48452 and GSE89632) and (2) patients with advanced fibrosis, compared to patients with mild fibrosis (in GSE49541) (Fig. 1c). Significant positive correlations between expression levels of the 3 DEGs (CD24, PRAP1, and SPP1) and serum HOMA-IR level, were observed both in our study and GSE89632 dataset (Fig. 2b).
3.3Association of HOMA-IR correlated genes with NASHTo determine the influence of insulin resistance on the global tissue transcriptome profile in the early stages of NAFLD, correlations between HOMA-IR levels and the whole genome gene expression levels were observed. A total of 1218 Insulin resistant correlated genes (IrCGs) showed a significant correlation with HOMA-IR level, after multiple testing corrections (q-value <0.05) (Supplementary Fig. 3, Supplementary Table 2). Among the IrCGs, 51.73% (630 genes) were positively correlated and 48.27% (588 genes) were negatively correlated with HOMA-IR (Supplementary Fig. 3, Supplementary Table 2). 44% of IrCGs were significantly associated with the presence/absence of insulin resistance, after adjusting for the effects of age and gender (Supplementary Table 2).
Hierarchical clustering analysis and principal component analysis (PCA) showed that the 1218 IrCGs were able to distinguish moderately between mild-NAFL and NASH samples, with PC1 explaining 27.75% of the sample variation (Fig. 3, Supplementary Fig. 4). The IrCGs could classify severe samples with hepatocyte ballooning, lobular inflammation and fibrosis, from the rest (Supplementary Fig. 4). Interestingly, 85% of the IrCGs (n = 1035) failed to differentiate between mild-NAFLD and NASH, after adjusting for the effect of IR, indicating NASH development may be driven by molecular changes related to insulin resistance.

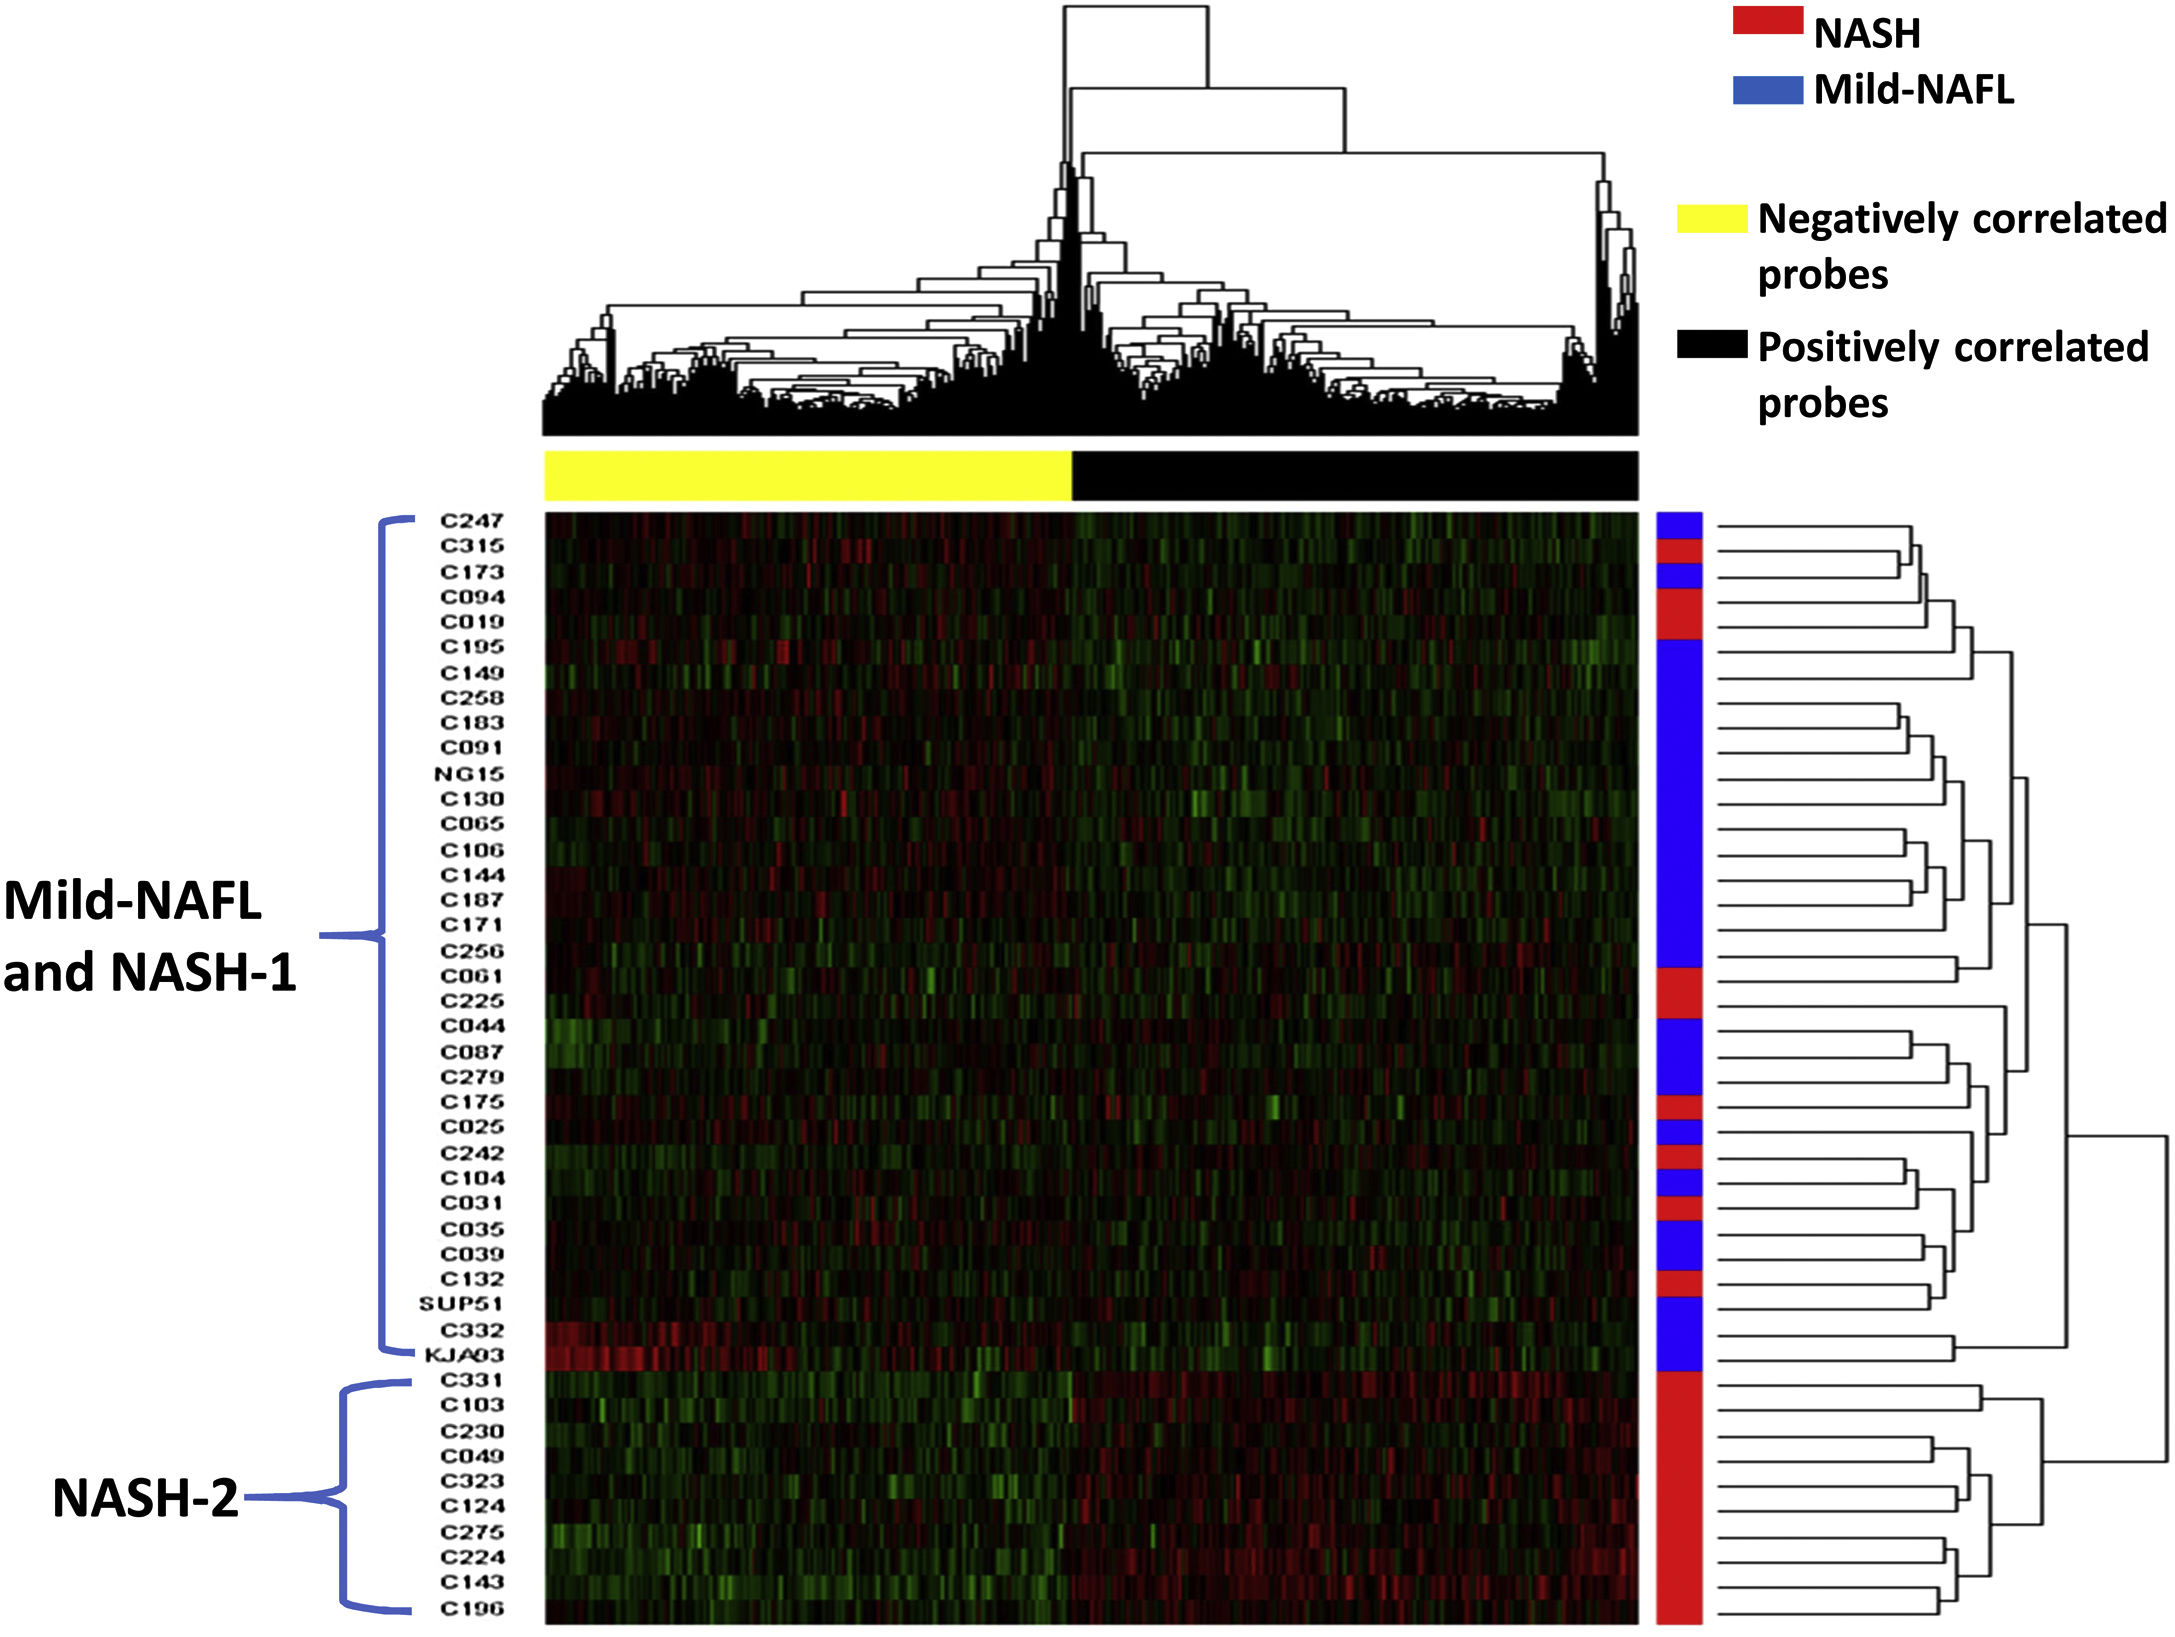
Hierarchical clustering of the samples into two groups: NASH and mild-NAFL based on IrCGs.
Data is presented in heatmap format in which rows are the samples and columns are the genes. Red color corresponds to up-regulation and green color corresponds to down-regulation of gene expression. “Blue” color indicates mild-NAFL samples and “red” color indicates NASH samples. Positively correlated probes are colored as “black” and negatively correlated probe as “yellow”.
Hierarchical clustering analysis of the samples with the 1218 IrCGs formed two main clusters, among our study patients (Fig. 3). One large cluster was observed including 36 patients with both mild-NAFL and NASH (named as “NASH-1”). The other separate small cluster comprised of 10 NASH patients (named as “NASH-2”). Positively correlated IrCGs (632 genes) were up-regulated and negatively correlated IrCGs (588 genes) were downregulated in NASH-2 group (Fig. 3). NASH-2 individuals also had more deranged diabetic profile than both “NASH-1” and mild-NAFL (Supplementary Fig. 5). NASH-2 group also had higher fibrosis (60%) than NASH-1 (33%).
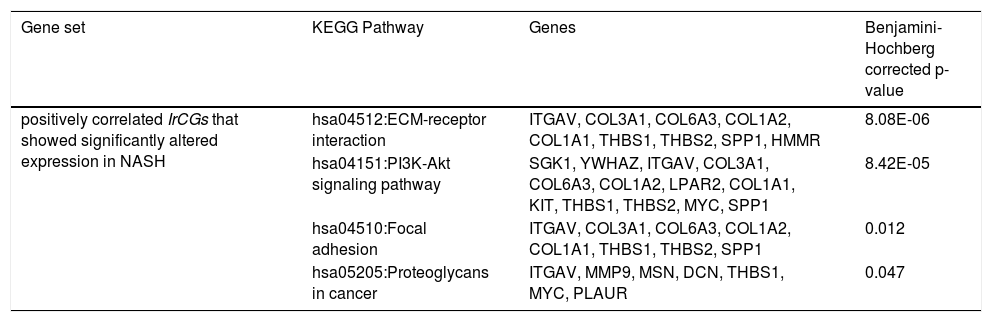
Among the positively correlated IrCGs (n = 630), 132 genes showed significant upregulation in NASH. Using DAVIDv6.8 [35], enrichment of ECM-receptor interaction (hsa04512), PI3K-Akt signaling (hsa04151), Focal adhesion (hsa04510) and Proteoglycans in cancer (hsa05205) pathways were observed among the 132 gene set (Table 2). Functional involvements of these pathways with fibrosis have been cited in previous studies [26,31,32]. Thus alterations in IrCG expressions may be linked to fibrosis development, which is a significant predictor of mortality and morbidity in liver diseases.
Pathway enrichment analysis among the IrCGs, showing significant correlation with HOMA-IR.
| Gene set | KEGG Pathway | Genes | Benjamini-Hochberg corrected p-value |
|---|---|---|---|
| positively correlated IrCGs that showed significantly altered expression in NASH | hsa04512:ECM-receptor interaction | ITGAV, COL3A1, COL6A3, COL1A2, COL1A1, THBS1, THBS2, SPP1, HMMR | 8.08E-06 |
| hsa04151:PI3K-Akt signaling pathway | SGK1, YWHAZ, ITGAV, COL3A1, COL6A3, COL1A2, LPAR2, COL1A1, KIT, THBS1, THBS2, MYC, SPP1 | 8.42E-05 | |
| hsa04510:Focal adhesion | ITGAV, COL3A1, COL6A3, COL1A2, COL1A1, THBS1, THBS2, SPP1 | 0.012 | |
| hsa05205:Proteoglycans in cancer | ITGAV, MMP9, MSN, DCN, THBS1, MYC, PLAUR | 0.047 |
Among the negatively correlated IrCGs (n = 588), 93 genes showed significantly altered expression in NASH. Pathway enrichment analysis among these 93 IrCGs identified enrichment of NAFLD (hsa04932) pathway, with NDUFA5, EIF2S1, NDUFB9, ChREBP genes mapped onto it (Table 2).
3.4IrCGs and fibrosis in NASHIrCGs could distinguish samples with both NASH and fibrosis from mild-NAFL and NASH samples (Supplementary Fig. 4c). We hypothesized that the HOMA-IR related hepatic gene expression profile is linked to fibrosis development in NAFLD. Using a two-step analysis approach, we identified a panel of 54 genes, which were also associated with HOMA-IR and were known to promote fibrosis (Fig. 4a). Among our study samples, (42 genes) among the 54 key genes were significantly altered between mild-NAFL (n = 24), NASH-without-fibrosis (N-wo-f, n = 13) and NASH-with-fibrosis (N-w-f, n = 7) (Fig. 4b, Supplementary Table 3). Five genes were differentially altered across the three groups- DCN, AEBP1, THY1, CD24 and SPP1. As expected, the maximum differences in expressions of key fibrosis-related genes were observed between mild-NAFL and N-w-f, confirming involvements of additional genes related to fibrosis (ANTXR1, KHK, DPYSL3, THBS1, SRPX, CYBRD1, CYBRD2, and IL8) (Fig. 4b). Interestingly, PCA with the expressions of key fibrosis-related genes showed separate clustering of NASH-2 group compared to mild-NAFL and NASH-1 (Fig. 4c).
 Two-step analysis approach for identification of key fibrosis related genes (42 genes). (B) Comparisons of expression of 42 key fibrosis-related genes across groups (mild-NAFL; n = 24, NASH-with-fibrosis, N-w-f; n = 7, and NASH-without-fibrosis, N-wo-f; n = 13). (C) Principal component analysis with expressions of key fibrosis genes showing clustering of mild-NAFL, NASH-1 (low HOMA-IR), and NASH-2 (high HOMA-IR).")
Identification of gene set related to both HOMA-IR and fibrosis.
(A) Two-step analysis approach for identification of key fibrosis related genes (42 genes). (B) Comparisons of expression of 42 key fibrosis-related genes across groups (mild-NAFL; n = 24, NASH-with-fibrosis, N-w-f; n = 7, and NASH-without-fibrosis, N-wo-f; n = 13). (C) Principal component analysis with expressions of key fibrosis genes showing clustering of mild-NAFL, NASH-1 (low HOMA-IR), and NASH-2 (high HOMA-IR).
The early stages of NAFLD are mostly asymptomatic [4]. Only a select group of patients with bland steatosis may ultimately display severe phenotypes (NASH, fibrosis). Thus it is crucial to study the molecular pathogenesis, associated with disease progression and to search for potential interventions. In this study, we identified differential expressions of 5 genes in NASH compared to mild-NAFL, by comparing hepatic transcriptome signature. Furthermore, identification of gene signature (IrCGs) related to insulin resistance (IR), playing a key role in NASH and fibrosis development, was the major finding of our study.
Similar to previous findings [37,38], our study showed an association of IR with NAFLD severity, with higher levels of HOMA-IR and higher proportion of insulin resistant subjects, in the NASH group (17.6%) compared to mild-NAFL group (6.9%). Among the NASH patients, individuals with higher HOMA-IR (NASH-2) had more fibrosis than those with lower HOMA-IR (NASH-1). Studies on both human samples and animal models of NAFLD have previously confirmed significant positive correlations between hepatic fat content (HFC) and HOMA-IR, further confirming insulin resistance as a potential risk factor for NASH development.
Few available literatures have shown correlations of hepatic gene expression markers and HOMA-IR, in different manifestations of metabolic syndrome including obesity, T2DM, and NAFLD [39,40]. Significantly altered expressions of fatty acid metabolism genes were observed in the livers of diabetic patients, characterized by insulin resistance [41,42]. Furthermore, a significant correlation between HOMA-IR and hepatic expressions of important NAFLD related genes (APOB, MTP, and L-FABP), was previously shown by Higuchi et al. [43]. In our study, the five differentially upregulated genes (DEGs- FABP4, FABP5L2, CD24, SPP1, and PRAP1) in NASH, showed significant positive correlations with HOMA-IR levels.
Insulin resistance results in de novo lipogenesis and increases free fatty acid (FFA) influx in hepatocytes due to excess lipolysis in the adipose tissue, leading to intra-hepatocyte fat accumulation, which in turn results in dysregulation of the lipid metabolism [38]. Increased expressions of FABPs (FABP4 and FABP5L2) and their interacting partner CD36 in NASH, may suggest increased intra-hepatic fatty acid intake, under insulin resistant state [44,45]. FABP4 was also found overexpressed in macrophages and dendritic cells and can an induce inflammatory response by IKK-NF-κB and JNK-AP-1 pathways activation in NASH [44].
Increased fatty acid influx results in lipotoxicity in hepatocytes via increased production of reactive oxygen species (ROS)) [38]. Lipotoxicity causes hepatocyte death, a cardinal feature of NASH. In response, cell survival pathways are activated to rescue tissue damage caused by the detrimental effect of increased oxidative stress, including cell proliferation and differentiation [38]. The SPP1(Osteopontin (OPN)) and CD24 genes that we found upregulated in NASH have been shown to promote cell adhesion, cell migration, and fibrosis in NASH [16,26]. Fibrosis related genes (SPP1 and CD24, along with DCN, AEBP1, and THY1 genes) were positively correlated with HOMA-IR and showed altered expressions from mild-NAFL to simple NASH to NASH with fibrosis.
Liver fibrosis is characterized by excessive deposition of extracellular matrix (ECM) and cells participating in epithelial-mesenchymal transition (EMT) [46]. Among the positively correlated IrCGs, enrichments of ECM receptor interaction, PI3K-Akt signaling pathway, Focal adhesion, and Proteoglycans in cancer pathways were observed in our study. The PI3K-AKT pathway functions in intracellular insulin signaling and serves multiple functions in response to tissue injury including inhibition of apoptosis, cell cycle progression, cell migration and angiogenesis [11,47]. Again genes that function in ECM receptor interaction, Focal adhesion and Proteoglycans in cancer pathways are involved in wound healing response. As reported by others, these wound healing and cell migration pathways were found to be overexpressed in NASH and other chronic liver diseases, leading to fibrosis [31,48]. The key fibrosis-related genes (N = 54), associated with HOMA-IR, could successfully classify the NASH-2 group (with higher HOMA-IR and HbA1c) from mild-NAFL and NASH-1 groups. Thus, we conclude that even if our study included only early NASH samples (NAS 4 and 5), molecular markers of severe liver damage were displayed by them, specifically by insulin sensitive and insulin resistant NASH patients.
Given our study observations along with previous findings, we may postulate that transcriptomic alterations related to insulin resistance may drive NAFLD progression from mild to advanced stages. Several pharmacological agents targeting insulin resistance, are presently either available or in clinical trials (eg. PPAR-G agonists, Elafibranor, GLP-1 agonists, DPP-IV inhibitors) [11]. Given the major impact of insulin resistance in early NAFLD pathogenesis, repurposing these drugs to improve insulin sensitivity, might retard NAFLD progression.
One major limitation is the small sample set used in our study. Although validated using publicly available data, the findings need to be investigated in detail on larger cohorts of patients. We could not include biopsy samples from healthy individuals, to compare our study findings, mainly due to ethical constraints. Despite these limitations, our study comprehensively characterizes the molecular changes on human patient samples and observed their relation with HOMA-IR, thus providing valuable insights in understanding disease pathogenesis at the disease initiation stage of the NAFLD spectrum.
Conflict of interestThe authors have no conflicts of interest.AbbreviationsT2DM Type II diabetes mellitus Non-alcoholic fatty liver disease insulin resistance body mass index simple steatosis non-alcoholic steatohepatitis hepatocellular carcinoma glycated hemoglobin fasting blood sugar fasting serum insulin Homeostatic model assessment of insulin resistance Proton Magnetic Resonance Spectroscopy NAFLD Activity Score mild Non-alcoholic fatty liver without NASH and liver injury differentially expressed genes analysis of variance Benjamini-Hochberg False Discovery Rate alanine transaminase aspartate transaminase Liver Stiffness Measurement alkaline phosphatase gamma-glutamyl transferase Insulin Resistance correlated-genes RNA integrity number free fatty acid reactive oxygen species total cholesterol triglyceride low-density lipoprotein high-density lipoprotein very low density lipoprotein real time polymerase chain reaction NASH without fibrosis NASH-without-fibrosis principal component analysis
This research did not receive any specific grant from funding agencies in the public, commercial, or not-for-profit sectors. The research was funded by intramural fund from the National Institute of Biomedical Genomics, Kalyani. The authors would like to thank all the study participants, who consented for the study. The authors would like to thank Somnath Mazumder, for his support in manuscript preparation and organization.
The following are Supplementary data to this article:
articles


![]()

- Download PDF
- Bibliography
- Additional material