


Liver fibrosis (LF) often leads to cirrhosis and even hepatocellular carcinoma (HCC), but the molecular mechanism remains unclear. The aims of the present study were to identify potential biomarkers for the progression of LF to HCC and explore the associated molecular mechanisms.
Materials and methodsThe isobaric tags for relative and absolute quantitation (iTRAQ) was used to detect changes in the protein expression profiles of liver tissues and to screen the differentially expressed proteins (DEPs). The differentially expressed genes (DEGs) of LF rats and patients were screened by Gene Expression Database (GEO). Subsequently, the clinicopathological analysis of the overlapping genes in different pathological stages in HCC patients based on GEPIA database was conducted.
ResultsiTRAQ proteomic analysis revealed 689, 749 and 585 DEPs in the 6W, 8W and 12W groups, respectively. ALDH2, SLC27A5 and ASNS were not only the DEPs found in rats with LF with different stages but were also the DEGs related to the pathological stages and survival in patients with HCC.
ConclusionsALDH2, SLC27A5 and ASNS were the potential biomarkers associated with the progression of LF to HCC.
Liver fibrosis (LF) refers to the abnormal aggregation of fibroblasts and excessive deposition of extracellular matrix (ECM) in the liver, accompanied by evident inflammatory lesions and structural changes [1]. It is a common pathological condition observed in chronic liver diseases. If LF is not effectively controlled, it can eventually develop into cirrhosis or even hepatocellular carcinoma (HCC). Fibrous diseases constitute 45% of the total causes of mortality worldwide [2]. LF, with high incidence rate and mortality, has become a challenge in the field of liver disease treatment. Chronic alcoholism, viral infection, fatty liver, metabolic diseases, and cholestasis are the main factors that cause LF [3, 4].
LF is a complex pathological condition that involves multiple targets and pathways. Most studies have confirmed that hepatic stellate cell (HSC) activation is key in LF. Activated HSCs synthesize excess ECM and generate scar tissues, which ultimately lead to LF [5]. However, the exact mechanism of the occurrence and development of LF remains unclear.
Impressively, LF, the common chronic liver disease, is the precursor of cirrhosis and HCC. Prompt treatment of LF is particularly important to delay or block the progression of LF to HCC. Therefore, identifying the markers of LF progression to HCC is beneficial for treatment. In this study, we detected the degree of pathological damage and differentially expressed proteins (DEPs) in rat liver tissues after CCl4 stimulation for 6, 8 and 12 weeks. The differentially expressed genes (DEGs) of liver tissues in CCl4-induced LF rat samples and patients were obtained from the Gene Expression Omnibus (GEO) database (https://www.ncbi.nlm.nih.gov/geo/) and were analysed with the DEPs identified in this study to obtain the key targets. Key genes associated with LF progression to HCC were screened through the Gene Expression Profiling Interactive Analysis (GEPIA) database (http://gepia.cancer-pku.cn/). The overall procedure of the experiment was demonstrated in Fig. 1.
2Materials and methods2.1Animals and experimental design
The experimental procedures and protocols used in this study had been reviewed and approved by Guangxi University of Chinese Medicine Institutional Review Board. Male Sprague Dawley (SD) rats were supplied by the Hunan SJA Laboratory Animal Co., Ltd. with the license number SCXK (Xiang) 2016-0002. The rats (220 – 230 g) were housed under controlled conditions (25 ± 2°C and 75 ± 5% humidity, with a 12-h light–dark cycle) and had free access to rodent chow and water. After 3 days of adaptive feeding, the rats were randomly divided into a blank group (n = 10) and a model group (n = 18). Rats in the model group were subcutaneously injected with 40% CCl4 (diluted in soybean oil at 3 mL/kg) for 12 weeks twice a week for the first 8 weeks and once a week for the next 4 weeks, and rats in the blank group were injected with soybean oil. Rats in the model group were sacrificed at 6 (named the 6W group), 8 (named the 8W group) and 12 (named the 12W group) weeks, six rats at a time, whereas rats in the blank group (named the 0W group) were sacrificed at 12 weeks.
2.2Calculation of the liver, spleen, and thymus indicesThe liver, thymus and spleen were cleaned with saline, and excess water was absorbed with filter paper. Subsequently, the samples were weighed. The liver, spleen, and thymus indices were calculated using the following formulas:
2.3Histological examination of the liver


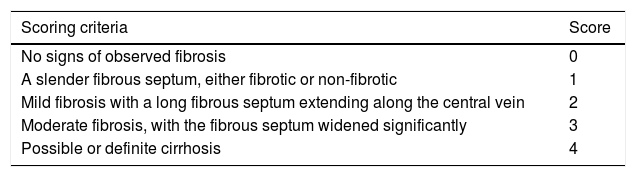
A small section of tissue was cut from the same positon of the liver in each group and fixed in 4% paraformaldehyde. After paraffin embedding and sectioning, the samples were stained with haematoxylin and eosin (H&E), Masson and Sirius red stains. The degree of liver injury and LF was observed under a light microscope, and the scoring criteria were shown in Table 1. The deposition of type I and type III collagen fibres in the rat liver was observed under a polarised light microscope.
2.4iTRAQ labellingSix liver tissues from the 0W, 6W, 8W and 12W groups were randomly divided into three replicates. An appropriate amount of liver tissue was ground to powder after adding liquid nitrogen in a mortar precooled with liquid nitrogen. The liver tissue powder was transferred to lysis buffer (8 M urea [Vetec, V900119], 2 mM ethylenediaminetetraacetic acid [EDTA; Vetec, V900106], 10 mM dithiothreitol [DTT; Vetec, V900830] and 1% protease inhibitor cocktail [Amresco, M222]) for protein extraction. The protein concentration was measured using the Bradford kit (Beyotime, P0006).
For peptide isotope labelling, the protein solution that contained 100 µg of protein was reduced and alkylated. Subsequently, sequencing-grade trypsin (Pierce, 90057) was added for protein digestion. Lastly, the samples were labelled according to the instructions provided in the iTRAQ Kit (Applied Biosystems Sciex, 4381663). The samples in the 0W, 6W, 8W and 12W groups were labelled with reagents 113, 118, 119 and 114, respectively. All labelled peptides were mixed and vacuum dried before further analyses.
2.5Liquid chromatography–tandem mass spectrometry analysis and data processingPeptides were fractionated through high-pH reversed-phase high-performance liquid chromatography (HPLC) using a Waters Bridge Peptide BEH C18 column (130 Å, 3.5 μm, 4.6 × 250 mm). The procedure was as follows: The peptide fractionation gradient used was 2 – 98% acetonitrile; 72 fractions were separated for 88 min. The peptides were combined into 18 fractions, and the fractions were analysed by liquid chromatography–tandem mass spectrometry (LC-MS/MS) after vacuum freeze-drying. For protein identification and quantification, the peptides were separated using the EASY-nLC 1000 ultra-HPLC system. Subsequently, the peptides were injected into the nanospray ionisation (NSI) source for ionisation and were analysed using a MS (Q Exactive Hybrid Quadrupole-Orbitrap Mass Spectrometer, Thermo Fisher Scientific, USA) detector. Peptide parent ions and their secondary fragments were detected and analysed using high-resolution Orbitrap MS. The data-dependent acquisition (DDA) program was used to process the data.
Using the software Proteome Discoverer (version 1.3, Thermo Fisher Scientific), the original map file of peptide identification by Q-Exactive was submitted to the sequence database for retrieval.
2.6Joint analysis of proteomics and GEO database transcriptomicsThe microarray data GSE139994 and GSE84044 related to LF were downloaded from the GEO database. The GSE139994 microarray data were contained three normal liver tissue samples from normal rats and three LF liver tissue samples from CCl4-induced LF rats. The GSE84044 microarray data were contained 26 liver biopsy samples from patients with chronic hepatitis B (CHB) with LF and inflammation stage 0 and 28 samples from patients with CHB with LF stage 3 to 4. The R Software (version 3.5.3) was used to download and process all the data. The overlapping proteins/genes were screened from the DEGs identified in the GEO database and the DEPs identified in proteomic analysis (see Fig. 2). The DEGs that significantly affected the survival time of patients with HCC and were related to HCC progression were screened from the overlapping proteins/genes using the GEPIA database to identify the biomarkers of LF progression to HCC.
2.7Bioinformatic analysis
Functional annotation and enrichment analysis of DEPs and DEGs were performed using the DAVID database (http://david.abcc.ncifcrf.gov/). The protein interaction network was analysed using the STRING database (https://string-db.org/) and visualised using the Cytoscape software (version 3.7.1). The expression levels of functional enrichment of DEPs or DEGs were clustered and visualised using the pheatmap, ggplot2, RColorBrewer and Mfuzz packages in the R software. GEPIA database was used for differential expression, pathological staging, and survival analyses of these overlapped DEGs in HCC samples.
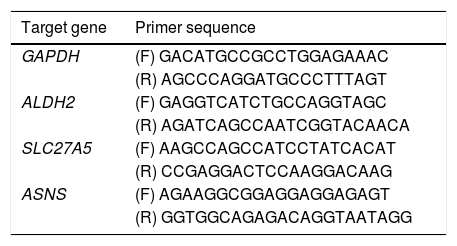
2.8Real-time reverse transcription polymerase chain reaction assayA real-time reverse transcription PCR (qRT-PCR) was used to determine the key genes expression of rats in the 0W, 6W and 12W groups. Six liver tissues from each group were randomly divided into three replicates. Approximately 100 mg of tissue was collected from rat liver, and the total RNA extraction kit for animal tissue (Tiangen, DP431, China) was used to extract total RNA. Total RNA was reverse transcripted into cDNA using HiScript II Q RT SuperMix for real-time polymerase chain reaction (qPCR; +gDNA wiper; Vazyme, China). PCR amplification was performed using cDNA as a template. The primer sequences used for qRT-PCR were provided in Table 2. The relative expression levels of the target genes were calculated using the 2−△△Ct method.
2.9Western blot (WB) analysisThe total liver protein was extracted by using a tissue protein extraction kit (Solarbio, BC3711). Proteins were separated by denaturing sodium dodecyl sulfate polyacrylamide gel electrophoresis (SDS-PAGE) and transferred onto a polyvinylidene fluoride (PVDF) membrane. The membrane was blocked with 5% non-fat milk and incubation overnight at 4°C with the following primary antibodies: ALDH2 (Abcam, EPR4493), ASNS (Affinity, DF7398), SLC27A5 (Affinity, DF3845) and β-actin (Proteintech, 60008-1-Ig) followed by incubation with secondary antibody and visualization. Band intensity analysis was performed using Image J software and the results were normalized to those of β-actin that was used as the internal control.
2.10Statistical analysesThe data were statistically analysed using the SPSS software (version 19.0). The data of each group were expressed as mean ± standard deviation. Single-factor variance analysis was used to compare data among the groups, and an independent samples t-test was used to compare data between two groups. A P-value <0.05 was considered statistically significant. Proteins and genes with fold changes (mean value of triplicates) >1.3 or <1/1.3 with a P-value <0.05 (t-test based on triplicates) were considered significantly regulated.
3Results3.1Histopathological changes in the liverPrevious studies have shown that the pathological damage of liver tissue in LF rats gradually worsens over time [6]. Therefore, histopathological changes in the rats were evaluated to exhibit the extent of liver injury at 0, 6, 8 and 12 weeks. The staining results demonstrated that inflammatory infiltration and the degree of hepatocyte necrosis gradually increased from 0 to 8 weeks. Mild LF first appeared at 6 weeks and then developed into more severe LF within 12 weeks, indicating that LF gradually became evident with the extension of modelling time (Fig. 3).
 H&E staining (100 ×), Masson staining (100 ×) and Sirius red staining (200 ×) of the rat liver tissues (type I collagen was represented in yellow or red, and type III collagen was represented in green). (B) Masson staining score. (C) The average intensity of Sirius red staining.")
Pathological section of rat liver. (A) H&E staining (100 ×), Masson staining (100 ×) and Sirius red staining (200 ×) of the rat liver tissues (type I collagen was represented in yellow or red, and type III collagen was represented in green). (B) Masson staining score. (C) The average intensity of Sirius red staining.
The liver, thymus and spleen are the main organs of the immune system. As shown in Fig. 4, after the LF model was induced by CCl4, the spleen and liver indices increased significantly (P <0.05), and the thymus index was initially increased but was subsequently decreased. These results suggested that the liver and spleen of rats were significantly intumescent after 6 weeks of CCl4 stimulation.
3.3Identification of DEPs in different groups after CCl4 stimulation
To determine protein changes during disease progression in CCl4-induced LF rat models, the proteins in the liver were detected by LC-MS/MS and iTRAQ. A total of 6004 proteins were successfully identified by searching the target database; of which, 1076 proteins were quantified in at least two replicates. Compared with the 0W group, 689, 749 and 585 proteins were significantly regulated in the 6W, 8W and 12W groups, respectively; of which, 116 were upregulated and 203 were downregulated in the CCl4-induced groups (Fig. 5A and B).
3.4Cluster, KEGG and GO analyses of DEPs Upregulated proteins. (B) Downregulated proteins.")
General trends in protein expression changes can be observed by heat map imaging and cluster analysis. In this study, 1076 proteins were evaluated and clustered into five different expression profiles. As demonstrated in Fig. 6A and B, most proteins (Cluster 1, 26.4 %) were gradually downregulated over time, whereas a few proteins (Cluster 4, 14.4 %) were gradually upregulated.
 Heat map of protein expression level. (B) Cluster analysis of protein expression pattern. (C) Enrichment analysis of molecular function. (D) KEGG enrichment analysis.")
As evident by gene ontology (GO) annotation, the most abundant DEPs were found in Cluster 1 and 2, which were involved in oxidation–reduction and drug response. In Cluster 3, oxidation–reduction and cell–cell adhesion were most evident. Reactivity to organic compounds and drugs and cell adhesion were most abundant in Cluster 4. Oxidation–reduction, cell–cell adhesion and drug response were also enriched in Cluster 5 (Fig. 6C).
The results of Kyoto Encyclopedia of Genes and Genomes (KEGG) and cluster analyses revealed the involvement of metabolic pathways in Cluster 1, 2 and 3 (Fig. 6D), indicating that the occurrence and development of LF were closely related to metabolic abnormalities [7]. Furthermore, in Cluster 1, DEPs were gradually decreased with the development of LF and were enriched in fatty acid and tryptophan metabolism, metabolism of xenobiotics by cytochrome P450, glycolysis/gluconeogenesis and other metabolic pathways.
3.5Screening of the overlapping proteins/genes by proteomic and transcriptomic analysesTranscriptomic and proteomic techniques are important and highly effective tools for screening DEPs or DEGs. These methods have been used in some studies to obtain differential expression profiles through multi-omics and cross-validation, to mine key proteins/genes or to clarify regulatory mechanisms [8, 9]. In this study, the transcriptome data sets of rats with CCl4-induced LF and patients with LF with CHB were downloaded from the GEO database. Among the 319 common DEPs identified in the 6W, 8W and 12W groups, 30 were verified by the GSE139994 and GSE84044 datasets. A total of 30 overlapping proteins/genes were found in the intersection between the DEGs from GSE139994 and GSE84044 and 319 DEPs (Table S1). This implied that the overlapping DEGs played a crucial role in the occurrence and development of LF. For a better understanding of the interactions among the 30 overlapping proteins, a protein–protein interaction (PPI) network was constructed through the STRING database. As demonstrated in Fig. 7, AGR1, OAT, ALDH2 and ASNS interacted closely with other DEGs. Moreover, the KEGG analysis revealed that these 30 DEGs were enriched in metabolic pathways of alanine/aspartate/glutamate/arginine/proline, pathway of primary bile acid biosynthesis and others.
3.6Screening of biomarkers associated with LF progression to HCC and validation
Patients with LF are at a significant risk of primary liver cancer, especially HCC [10]. In this study, the associations of 30 overlapping DEGs with pathological staging and survival of patients with HCC were analysed. The results revealed that, in HCC, the expression of ALDH2 and SLC27A5 in tumour tissues was significantly lower than that in normal tissues and was negatively correlated with the pathological stage of the tumour (Fig. 8A and B). The survival of patients with HCC with low expression of ALDH2 and SLC27A5 was significantly shorter than that of patients with high expression of these genes. On the contrary, the expression of ASNS in tumour tissues was significantly higher than that in normal tissues and was positively correlated with the pathological stage of the tumour. The survival of patients with HCC with high expression of ASNS was significantly shorter than that of patients with low expression of this gene (Fig. 8C). Therefore, ALDH2, SLC27A5 and ASNS might be the potential biomarkers and therapeutic targets related to the progression of LF to HCC. Furthermore, qRT-PCR analysis and WB analysis were performed to validate the expression of the three DEGs/DEPs in LF rats. The expression trends of ALDH2, SLC27A5 and ASNS in the 6W and 12W groups were consistent with those analysed from the GEPIA database (Fig. 8D and E).
 The expression of ALDH2, SLC27A5 and ASNS in HCC. (B) The expression of ALDH2, SLC27A5 and ASNS in different stages of HCC. (C) Survival analysis of ALDH2, SLC27A5 and ASNS. (D) WB analysis of ALDH2, SLC27A5 and ASNS. (E) qRT-PCR analysis of ALDH2, SLC27A5 and ASNS.")
The expression and survival analysis of ALDH2, SLC27A5 and ASNS in patients with HCC and validation. (A) The expression of ALDH2, SLC27A5 and ASNS in HCC. (B) The expression of ALDH2, SLC27A5 and ASNS in different stages of HCC. (C) Survival analysis of ALDH2, SLC27A5 and ASNS. (D) WB analysis of ALDH2, SLC27A5 and ASNS. (E) qRT-PCR analysis of ALDH2, SLC27A5 and ASNS.
CCl4 is the most widely used hepatotoxin in the study of liver fibrosis and cirrhosis in rodents. Liver tissue and cells exposed to CCl4 initiate a complex process to resist toxicity. CCl4 metabolism in the liver leads to the production of free radicals and triggers oxidative stress. Oxidative stress will further activate the production of inflammatory factors, cause liver cell necrosis, induce inflammation, and further promote the occurrence and development of liver fibrosis [11]. Thus, CCl4-induced liver injury mimics human chronic disease associated with toxic damage [12]. However, in humans, CHB was the critical cause of cirrhosis and HCC. In the natural history of CHB, most patients progress from chronic hepatitis to liver cirrhosis, and then from cirrhosis to HCC [13]. The inflammatory response caused by hepatitis B virus (HBV) triggers the activation of effector cells leading to the deposition of extracellular matrix, and then fibrosis [14]. Etiological analysis has shown that liver fibrosis caused by HBV are similar to the liver fibrosis induced by CCl4. In this paper, the DEPs were screened from liver tissue of CCl4-induced of LF rats, and DEGs were screened from liver tissue of LF patients infected with HBV.
An uncontrolled LF has a high probability of progression to HCC. Clinically, metabolic diseases such as diabetes, non-alcoholic steatohepatitis, chronic hepatitis C virus (HCV) and HBV infections are the main risk factors for the development of LF. After liver injury caused by metabolic diseases or viral infections, HSCs are activated. The activated HSCs promote the loss of retinoid and produce ECM, leading to the formation of LF and, more seriously, even liver cirrhosis and HCC. Approximately 90% of HCC cases are reported secondary to cirrhosis [15]. Therefore, identifying biomarkers related to LF progression and HCC is important for reducing the risk of LF developing into cirrhosis and HCC. In this study, three biomarkers, ALDH2, SLC27A5 and ASNS, were screened by proteomic and transcriptomic analyses using the GEO database.
Free fatty acids (FFA) exhibited hepatotoxicity, which aggravates liver injury, induces lipid and hepatocyte apoptosis and promotes LF formation [16]. It is worth noting that the length of the fatty acid (FA) carbon chain has a differential regulatory effect on the apoptosis of human hepatocytes and the release of inflammatory factors. Without inducing obvious oxidative damage, medium-chain FA induces less apoptosis and lower-grade inflammation than long-chain FA in human liver cells under the same conditions [17]. Abnormal FA metabolism provides an important material and energy source for tumour growth, which are closely related to tumour growth and invasion [18]. de novo FA are a hallmark of many tumors, including HCC [18]. SLC27A5 specifically expressed in the liver is involved in FA transport and bile acid metabolism [19]. In SLC27A5-knockout mice, a significantly reduction in the uptake of long-chain FA and an increase of the de novo FA synthesis has been observed in hepatocytes [20]. Moreover, SLC27A5 affected the inhibition of cancer cell proliferation. In this study, the lower expression of SLC27A5 in hepatic tissues, thus shortening the survival time in the HCC patients in the first eighty months. Surprisingly, our study also found that the transcription and translation of SLC27A5 was significantly downregulated in liver tissues both in LF rats and LF humans. Therefore, it was hypothesised that the low expression of SLC27A5 aggravated liver injury through lipid metabolism disorder and subsequently participated in the development of LF to cirrhosis and liver cancer.
Asparagine, which is synthesized by asparagine synthetase encoded by the ASNS gene, is an essential amino acid for cell growth and survival [21]. In the CCl4-induced cirrhotic rat model, the level of asparagine increased [7]. ASNS had been considered as a predictive biomarker in ovarian cancer, pancreatic cancer and prostate cancer [22]. ASNS expression is upregulated in non-alcoholic fatty liver disease (NAFLD) and HCC [23, 24]. In the N-diethylnitrosolamine carcinogenesis rat model, ASNS is highly expressed during the inflammation stage to the advanced HCC stage, and reached a peak at the advanced cirrhosis and HCC stage [25], which was consistent with our results. Therefore, it has been speculated that the high expression of ASNS associated with damage to hepatocytes at the beginning of the inflammation stage is a risk factor for NAFLD and HCC.
ALDH2 is a key enzyme responsible for acetaldehyde metabolism in the liver. If the expression of ALDH2 is inhibited, acetaldehyde and lipid peroxide in the liver accumulate resulting in impaired liver function [26]. ALDH2−/− mice are more susceptible to ethanol plus CCl4-induced liver injury, inflammation, and fibrosis through acetaldehyde and its derived adducts [27]. ALDH2 deficiency aggravates CCl4-induced LF by increasing ROS production, apoptosis, and mitochondrial damage [28]. In recent years, many studies have demonstrated that down-expression of ALDH is related to viral hepatitis, alcoholic liver disease, NAFLD, LF and liver cancer [29]. Chronic alcohol-related liver injury and viral hepatitis are the two major etiologies of chronic liver disease, and often both of them occur in the same liver, accelerating liver disease progression [30]. The prevalence of chronic HBV infection in China is high. A study found that a good geographical correlation between populations who lived in HBV endemic regions and carried the ALDH2*2 alleles [31]. Individuals with dominant inactive ALDH2*2 gene had a higher risk of liver inflammation and fibrosis after moderate or heavy drinking. ALDH2 deficiency could induce excessive acetaldehyde accumulation and oxidative stress during alcohol consumption, leading to mitochondrial DNA damage and base modification. Extracellular vesicles could transfer these damaged DNA from liver cells to HCC cells, thereby promoting HCC progression [32]. Thus, up-regulation of ALDH2 is more meaningful for the treatment of LF, cirrhosis and liver cancer [28].
Then, the correlation between the above three genes/proteins and liver cancer stage and survival in HCC patients were analyzed. As shown in Fig. 8, the expression of ALDH2 and SLC27A5 decreased gradually with the aggravation of LF in rats, while the expression of ASNS increased gradually with the aggravation of LF in rats. These changes were also consistent with the pathological degree in HCC patients, and negatively correlated with the survival time in HCC patients.
5ConclusionThe occurrence and development of LF were closely related to abnormal fatty acid metabolism, tryptophan metabolism, metabolism of xenobiotics by cytochrome P450, glycolysis/gluconeogenesis and other metabolic pathways. ALDH2, SLC27A5 and ASNS were considered as the potential biomarkers for the progression of LF to HCC. However, further investigation on their functions and the mechanisms involved in the progression of LF to HCC is required.
Financial supportThis work was supported by the Innovation-driven Development Project of Guangxi, Grant/Award Number: GUIKE AA17202035; Guangxi First-class Discipline: Chinese Materia Medica (Scientific Research of Guangxi Education Department [2018] No. 12); National Natural Science Foundation of China, Grant/Award Number: 81960872.
Data accessibilityAll the raw data are available from the corresponding author upon reasonable request.
Author contributionsConception and design: Jiongyi Yan, Weisheng Luo, Jianqin Liang and Jianfang Feng.
Literature research and data acquisition: Jiongyi Yan, Xuewan Fang, Yinyi Feng, Xiaocong Ma, Xiaojuan Cui and Fang Li
Data analysis/interpretation: Jiongyi Yan, Xuewan Fang and Yinyi Feng
Manuscript editing: Jiongyi Yan and Xuewan Fang
Manuscript revision/review: Jiongyi Yan and Jianqin Liang
Supervision: Jianqin Liang and Jianfang Feng


