


Hepatic microRNA (miR) expression profiles were explored in aged rats with NAFLD, in order to clarify the molecular mechanisms underlying the pathophysiological processes of aging-related NAFLD.
Patients or materials and methods24 aged rats (18-month-old) and 24 young rats (2-month-old) were randomly divided into two subgroups according to diet, control group and NAFLD group. After 8 weeks of administering 45% high-fat diet or normal diet, total hepatic RNA was extracted from liver tissues of the aged rats. Differentially expressed microRNAs (DE-miRs) in aged NAFLD group were detected and screened out using high-throughput sequencing technology. The data were subjected to Gene Ontology functional enrichment and Kyoto Encyclopedia of Genes and Genomes pathway analyses using a bioinformatics approach. The sequencing results were further verified by RT-qPCR.
ResultsCompared with the aged control liver tissues, 6 significantly upregulated miRs (miR-881-3p, miR-871-3p, miR-335, miR-223-3p, miR-155-5p, miR-146b-5p) and 4 significantly downregulated miRs (miR-182, miR-193-3p, miR-31a-5p and miR-96-5p) were identified in the aged NAFLD liver tissues. These DE-miRs were found to be involved in the regulation of cell signaling transduction and metabolism processes, probably affecting signaling pathways relevant to insulin secretion and some senile diseases. RT-qPCR results corroborated the sequencing results and demonstrated that 6 significantly upregulated miRs were not identified in the young group.
ConclusionsA total of 10 DE-miRs identified in the aged NAFLD rats were involved in some certain insulin secretion and age-related functional pathways, which may serve as novel candidate targets for the diagnosis and treatment of aging-associated NAFLD.
Non-alcoholic fatty liver disease (NAFLD) is one of the most common liver diseases in the world. The prevalence of NAFLD has generally increased over the past 20 years. At the same time, the incidence of NAFLD increased with age. Increasing evidence has revealed the pathogenetic features of NAFLD; however, the detailed mechanisms underlying the development of NAFLD in aged populations remain largely unknown.
MicroRNAs (miRs) are small RNA molecules typically 19–25 nucleotides (nt) in length, which have no protein-encoding capability. miRs participate in the regulation of a range of biological processes, including cell proliferation, differentiation, senescence and apoptosis, by binding to the 3′-untranslated region (3′-UTR) of the mRNAs of target genes, thereby leading to translational inhibition prior to mRNA degradation [1,2]. Recently, a set of miRs have been identified to play pivotal roles in metabolic diseases and the aging process via regulation of specific signaling pathways in many species including nematodes, Drosophila, mice and humans [3]. miRs have distinct expression profiles depending on the cell type and the organism's physiological/pathological status. For example, miR-33a/b, miR-122, miR-29, miR-126, miR-96 and miR-192 have been reported to be associated with insulin resistance in the liver [4–6]. miR-34a, miR-217, miR-449, miR-22, miR-199a, miR-132 and miR-486-5p have been identified to be involved in the aging process [7–9]. However, the studies above only detected changes in the expression of these miRs without analyzing their functional relevance to specific diseases. To the best of our knowledge, no published work has investigated expression patterns in hepatic miRs in aged-related NAFLD until now. This lack of data hinders further elucidation of the molecular mechanisms involved in insulin resistance in the liver of the aged population.
In the present study, hepatic microRNA expression profiles in aged rats with NAFLD were explored systemically using high-throughput sequencing technology, as well as the aged control rats. The identified differentially expressed microRNAs (DE-miRs) between the aged NAFLD rats and the aged control rats were analyzed for functional relevance using a bioinformatics approach, in order to clarify the molecular mechanisms underlying liver insulin resistance in the pathological processes of aging-related NAFLD.
2Materials and methods2.1Animals and experimental designSpecific pathogen-free Sprague-Dawley rats (24 male 18-month-old rats weighing 650–800g and 24 2-month-old rats weighing 200–220g) were provided by Changsha Tianqin Biological Technology Co., Ltd. (Hunan Province, China) (licence number: SCXK (Hunan) 2014-0011). After 1 week of adaptive feeding, the rats in each group were randomly divided into two subgroups according to diet (n=12 per group): (i) aged NAFLD group (18-month-old rats); (ii) aged control group (18-month-old rats); (iii) young NAFLD group (2-month-old rats); and (iv) young control group (2-month-old rats). NAFLD groups were administered a diet consisting of 45% high-fat respectively, which was composed of 54.8% normal diet, 18.9% lard, 1.3% bile the sterol, 0.3% bile salts, 11.2% sucrose, 8.7% casein, 1.8% premix and 3% maltodextrin (with the ratio of 18% crude protein, 45% fat and 37% carbohydrate). Rats of the control groups were fed a standard laboratory chow. All dietary components were provided from Pu Lu Teng Biological Technology Co., Ltd. (Shanghai, China). The rats were maintained in a controlled environment (25°C on a 12-h light/dark cycle) and had free access to water and laboratory fodder. None of the rats died during the feeding process. All animal protocols in this study were approved by the Animal Care and Use Committee of Laboratory Animal Center, School of Pharmacy, Fudan University (Shanghai, China).
2.2Sample collection and serological examinationAfter 8 weeks of receiving continuous high-fat diet [10] or normal diet, all the rats were anesthetized and sacrificed with an intraperitoneal injection of sodium pentobarbital (40mg/kg), followed by overnight fasting for 12h. Blood samples were immediately collected from the abdominal aorta, and the livers were removed via aseptic laparotomy. Serum was obtained by centrifugation at 3500rpm for 10min, then frozen and stored at −80°C prior to biochemical analysis. Fasting blood glucose (FBG) levels were measured using an automatic analyzer (Modular D2400, Roche Diagnostics). Fasting serum insulin (FINS) levels were assessed using a fully automated chemiluminescence analyzer (Maglumi-4000, Shenzhen, China). The insulin resistance index was measured using the homeostasis model assessment (HOMA-IR). The following formula was used: FINS level (mIU/l)×fasting glucose level (mmol/l)/22.5.
2.3Tissue preparation and histologyLiver tissues were cut into several small pieces for subsequent histological analysis. Some were fixed in 4% paraformaldehyde, sliced into 3-μm-thick sections, embedded in paraffin, and stained with hematoxylin and eosin (H&E) using the standard method. A single observer who was blinded to this experiment photographed and examined H&E staining using a light microscope (DS-Fi1, Nikon Corporation). Each sample was given an NAFLD activity score (NAS) [11,12]. This system numerically rates macrosteatosis (0–3), lobular inflammatory changes (0–3), and hepatocyte ballooning (0–2). A NAS <3 correlates with mild non-alcoholic fatty liver, a NAS of 3–4 correlates with moderate non-alcoholic fatty liver, and a NAS ≥5 correlates with NASH [11]. Some liver samples were embedded in optimum cutting temperature compound (OCT, Sakura Finetek, USA), sliced into 10-μm-thick sections and then stained with the diluted Oil Red O solution (Sangon Biotech Co., Ltd.). Formation of lipid droplets in liver tissues was observed under a light microscope (DS-Fi1, Nikon Corporation) and photographed. The remaining liver samples were frozen in liquid nitrogen rapidly and then stored at −80°C until further analysis.
2.4Hepatic RNA isolation and purificationLiver tissues randomly pooled from 3 rats of the aged NAFLD group were compared with tissues pooled from 3 aged control rats. Total hepatic RNA was extracted using the mirVana™ miRNA Isolation kit (Ambion, Thermo Fisher Scientific, Inc.) according to the manufacturer's instructions. The purity of isolated RNA was established by electrophoresis using an Agilent 2100 Bioanalyzer (Agilent Technologies, Inc.) according to the procedures described by Chen et al. [13].
2.5Gene library construction and sequencingSequencing was performed by Shanghai Bohao Biotechnology Co. Briefly, 1.0μg of total RNA was subjected to 3′ adapter linkage and 5′ adapter linkage using T4 RNA ligation (New England Biolabs, Inc.) according to the manufacturer's instructions. The ligation products were subsequently reverse-transcribed into cDNA using SuperScript II Reverse Transcriptase (Invitrogen, Thermo Fisher Scientific, Inc.) and PCR amplified using an Illumina sequencing kit (Illumina, Inc.) to generate a cDNA library according to the previous studies [13]. The following program was used for amplification: 98°C for 30s; 98°C for 10s, 60°C for 30s, and 72°C for 15s, followed by 11 cycles at 72°C for 10min. The cDNA library was quantitatively analyzed on a Qubit® 2.0 Fluorometer (Invitrogen, Thermo Fisher Scientific, Inc.), and its size was measured using an Agilent Bioanalyzer (Agilent, Thermo Fisher Scientific, Inc.). Cluster generation and single-read sequencing were conducted on an Illumina HiSeq instrument according to the manufacturer's instructions (Illumina, Inc.).
2.6Data analysisSequence alignments and comparisons were conducted using the miRBase database 19.0, to identify and classify the number and distribution of known miRs, in addition to various forms of small RNA molecules. No base pair mismatches were allowed. EdgeR software (version 3.24) was used for comparing the abundance of miRs in the liver tissues from the aged NAFLD group with those from the aged control group. Data were presented as transcripts per million (TPM) and were calculated using following formula: TPM=(miR read number/total read number)×106[14]. Fold change in expression was calculated as TPMNAFLD rats/TPMcontrol rats[2,15]. DE-miRs were defined as the fold change in expression of >2 or <0.5 between the two groups (aged NAFLD group and aged control group) with a false discovery rate (FDR) of <0.05 [2,15].
2.7Bioinformatics analysis for DE-miRsThe potential target genes of DE-miRs were predicted using miRanda (www.microrna.org), followed by pathway enrichment analysis using Gene Ontology (GO) (www.geneontology.org) and Kyoto Encyclopedia of Genes and Genomes (KEGG) (www.kegg.jp) databases according to previous studies [16–18]. P values were calculated from the hypergeometric distribution. P<0.05 was considered statistically significant [19].
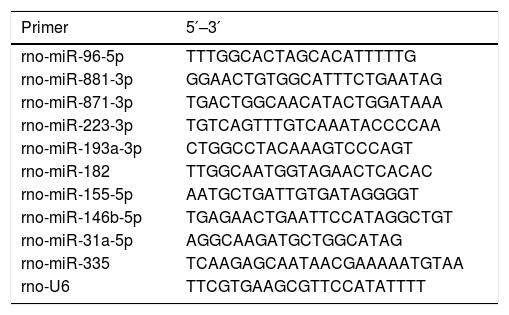
2.8Reverse transcription-quantitative PCR (RT-qPCR)To confirm the expression of DE-miRs identified by the deep sequencing, further analysis was performed using RT-qPCR with the same total RNA samples of the liver tissues used for the construction of the sequencing library. Then the DE-miRs were also confirmed in liver samples in all of 24 aged rats and 24 young rats using RT-qPCR. PCR primers were synthesized by Shanghai Shengong Biotechnology Company. Total RNAs were isolated from each hepatic sample using an mirVana™ miRNA Isolation kit (Ambion, Thermo Fisher Scientific, Inc.) and reverse transcribed into cDNA using the miScript II Reverse Transcriptase Mix (Qiagen, Inc.) according to the manufacturer's protocol. The RT reaction conditions were as follows: 37°C for 60min, 95°C for 5min. The relative gene expression was determined using a 7900 HT Sequence Detection System (ABI, USA). The parameters of the PCR protocol were as follows: 95°C for 2min, followed by 40 cycles at 94°C for 15s, and then 60°C for 1min. All reactions were run in triplicate. miR expression was calculated using the 2−ΔΔCq method [2] and normalized to rno-U6 expression. Primer sequences are presented in Table 1.
Primer sequences.
| Primer | 5′–3′ |
|---|---|
| rno-miR-96-5p | TTTGGCACTAGCACATTTTTG |
| rno-miR-881-3p | GGAACTGTGGCATTTCTGAATAG |
| rno-miR-871-3p | TGACTGGCAACATACTGGATAAA |
| rno-miR-223-3p | TGTCAGTTTGTCAAATACCCCAA |
| rno-miR-193a-3p | CTGGCCTACAAAGTCCCAGT |
| rno-miR-182 | TTGGCAATGGTAGAACTCACAC |
| rno-miR-155-5p | AATGCTGATTGTGATAGGGGT |
| rno-miR-146b-5p | TGAGAACTGAATTCCATAGGCTGT |
| rno-miR-31a-5p | AGGCAAGATGCTGGCATAG |
| rno-miR-335 | TCAAGAGCAATAACGAAAAATGTAA |
| rno-U6 | TTCGTGAAGCGTTCCATATTTT |
Analyses were performed using SPSS software (version 22.0; SPSS, Inc., Chicago, IL, USA). Data were expressed as the mean±standard deviation for at least three independent experiments for each group. Multiple comparisons between the aged and the young groups were carried out by one-way analysis of variance (ANOVA) test with post hoc contrasts by least significance difference (LSD) test. P<0.05 was considered statistically significant.
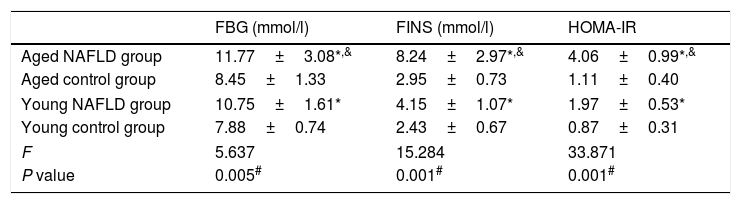
3Results3.1Serum markers for insulin resistanceTable 2 shows serum insulin resistance data. The HOMA-IR value was distinctively higher in the NAFLD group than the control group (4.06±0.99 vs. 1.11±0.40, P=0.001). When compared with the young NAFLD group, serum insulin and HOMA-IR levels were significantly higher in the aged NAFLD group (8.24±2.97 vs. 4.15±1.07, P=0.049; 4.06±0.99 vs. 1.97±0.53, P=0.001). Among the four groups, HOMA-IR level of the aged NAFLD group was significantly increased (4.06±0.99 vs. 1.11±0.40 vs. 1.97±0.53 vs. 0.87±0.31, P=0.001).
Comparison of serum markers for insulin resistance.
| FBG (mmol/l) | FINS (mmol/l) | HOMA-IR | |
|---|---|---|---|
| Aged NAFLD group | 11.77±3.08*,& | 8.24±2.97*,& | 4.06±0.99*,& |
| Aged control group | 8.45±1.33 | 2.95±0.73 | 1.11±0.40 |
| Young NAFLD group | 10.75±1.61* | 4.15±1.07* | 1.97±0.53* |
| Young control group | 7.88±0.74 | 2.43±0.67 | 0.87±0.31 |
| F | 5.637 | 15.284 | 33.871 |
| P value | 0.005# | 0.001# | 0.001# |
All data were expressed as the mean±standard deviation for at least three independent experiments for each group, n=12. FBG, fasting blood glucose; FINS, fasting insulin; HOMA, homeostasis model assessment.
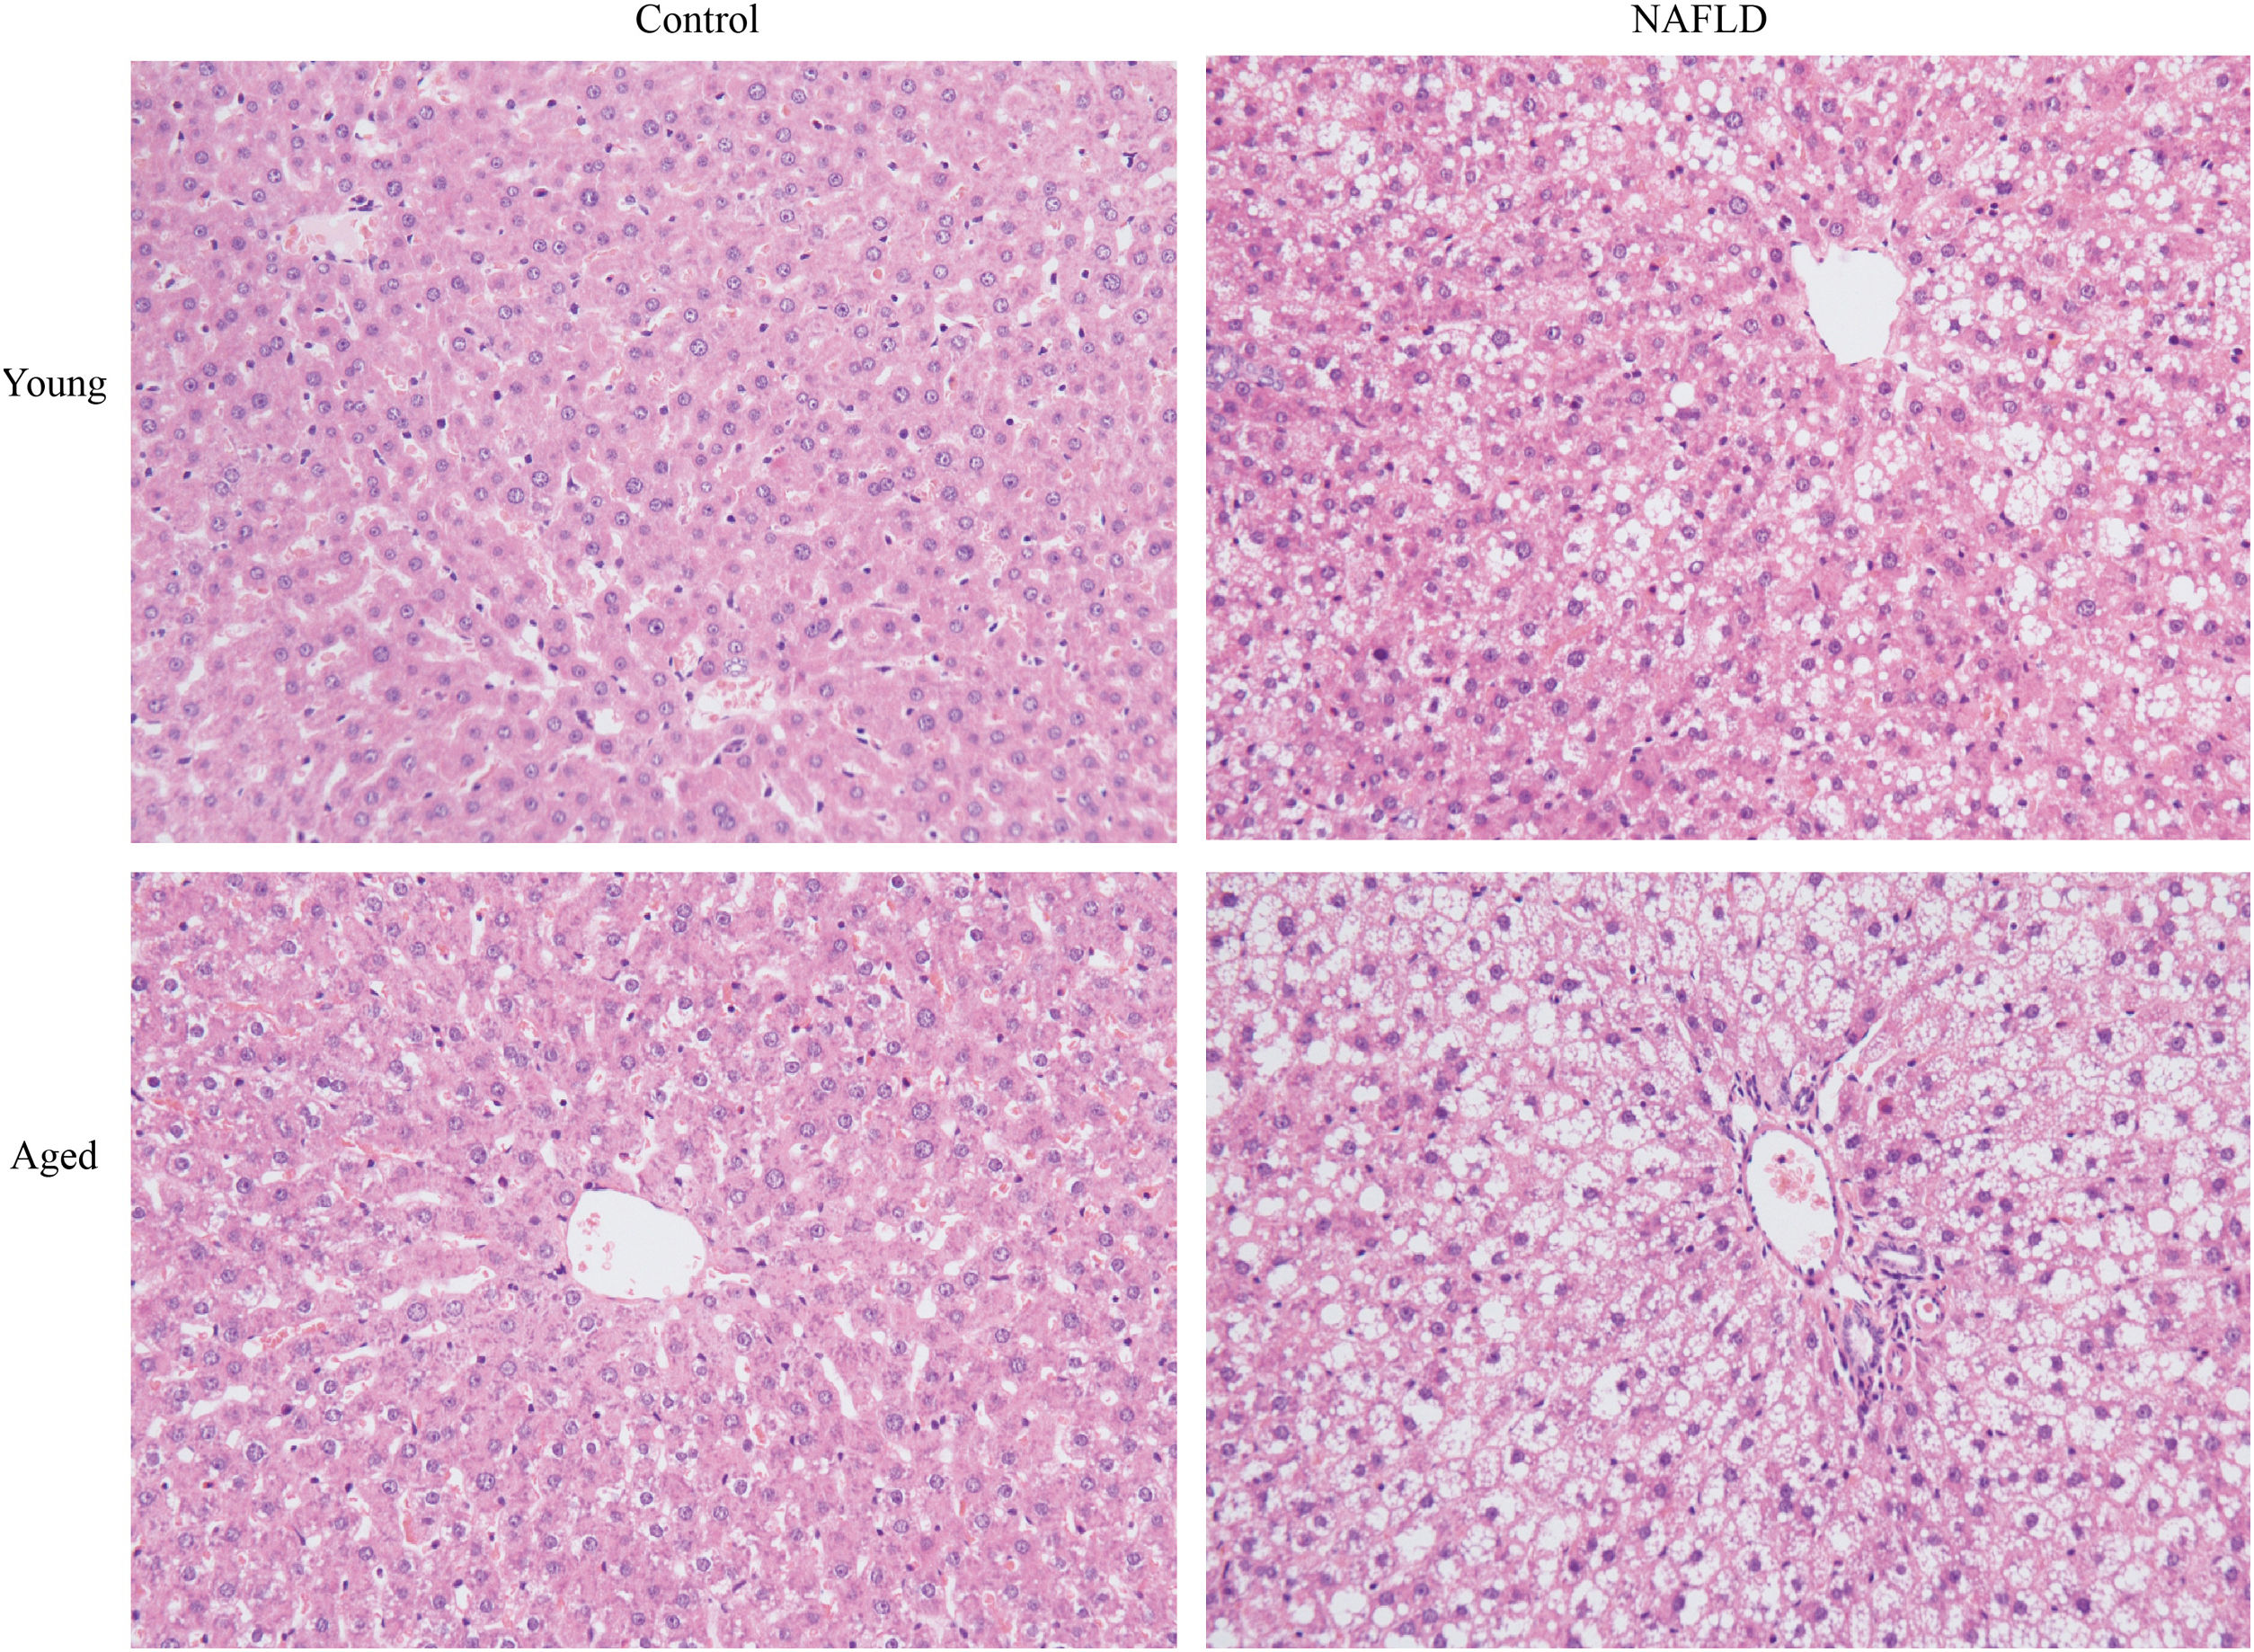
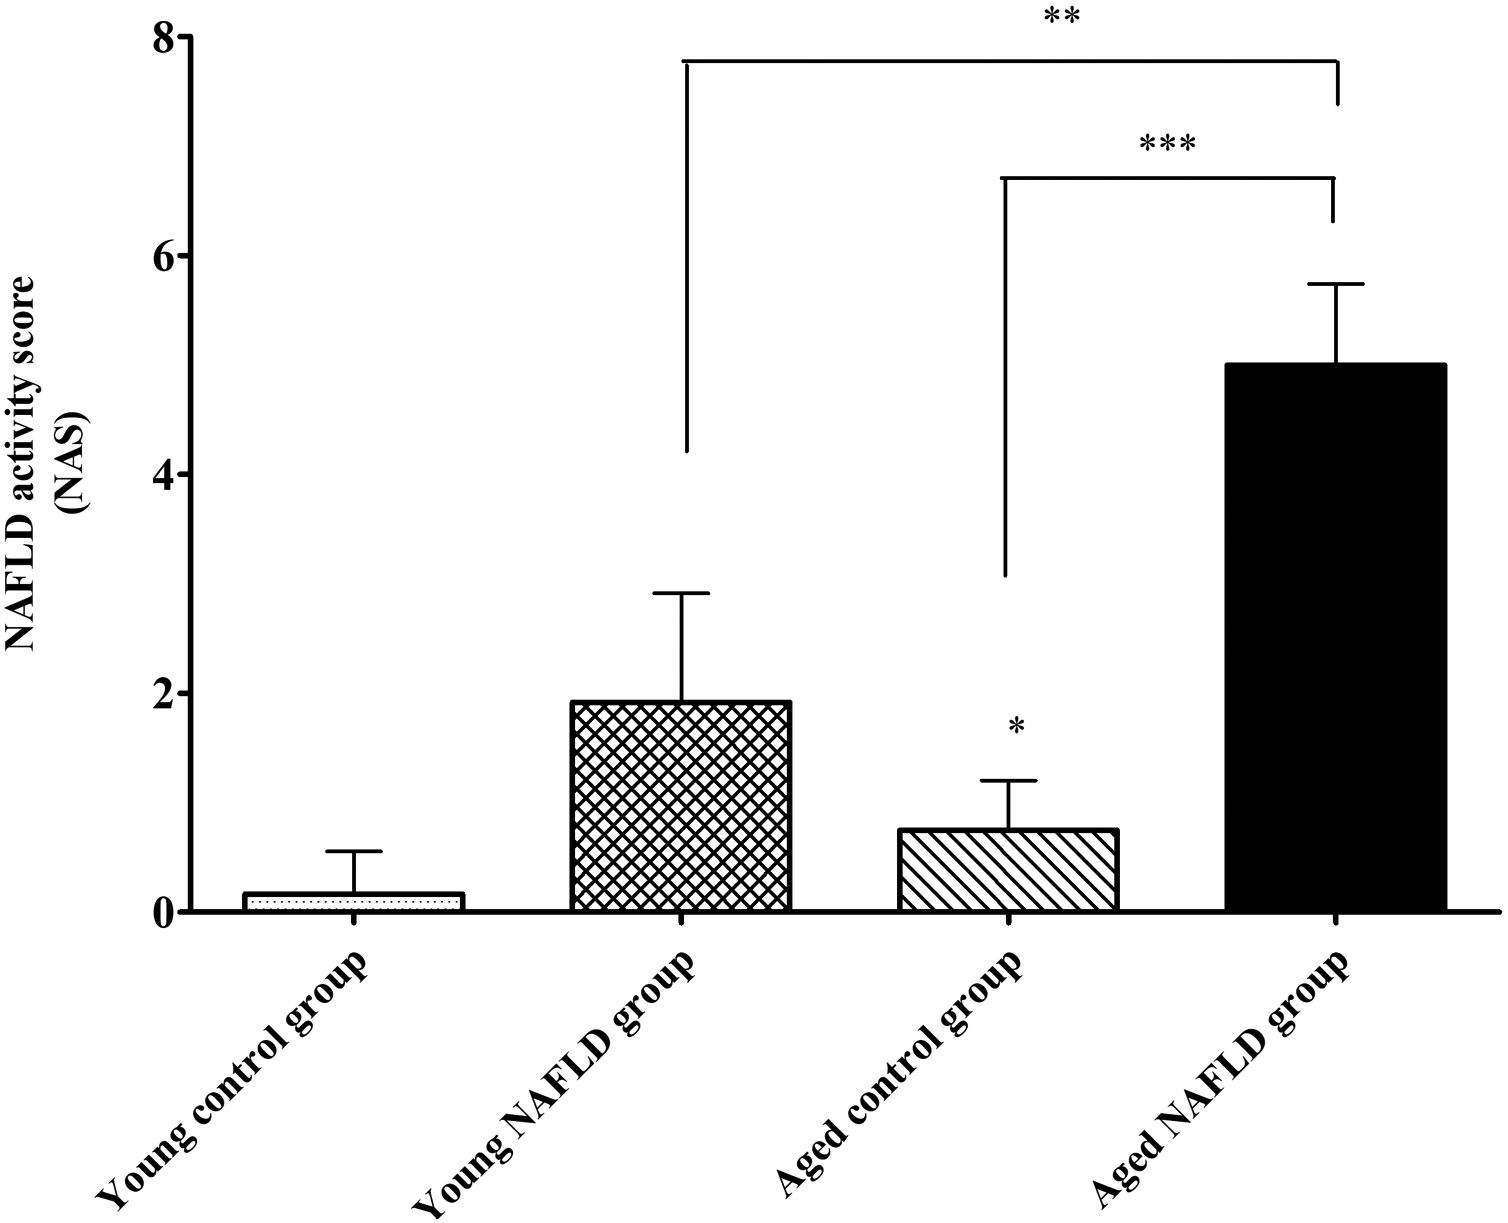
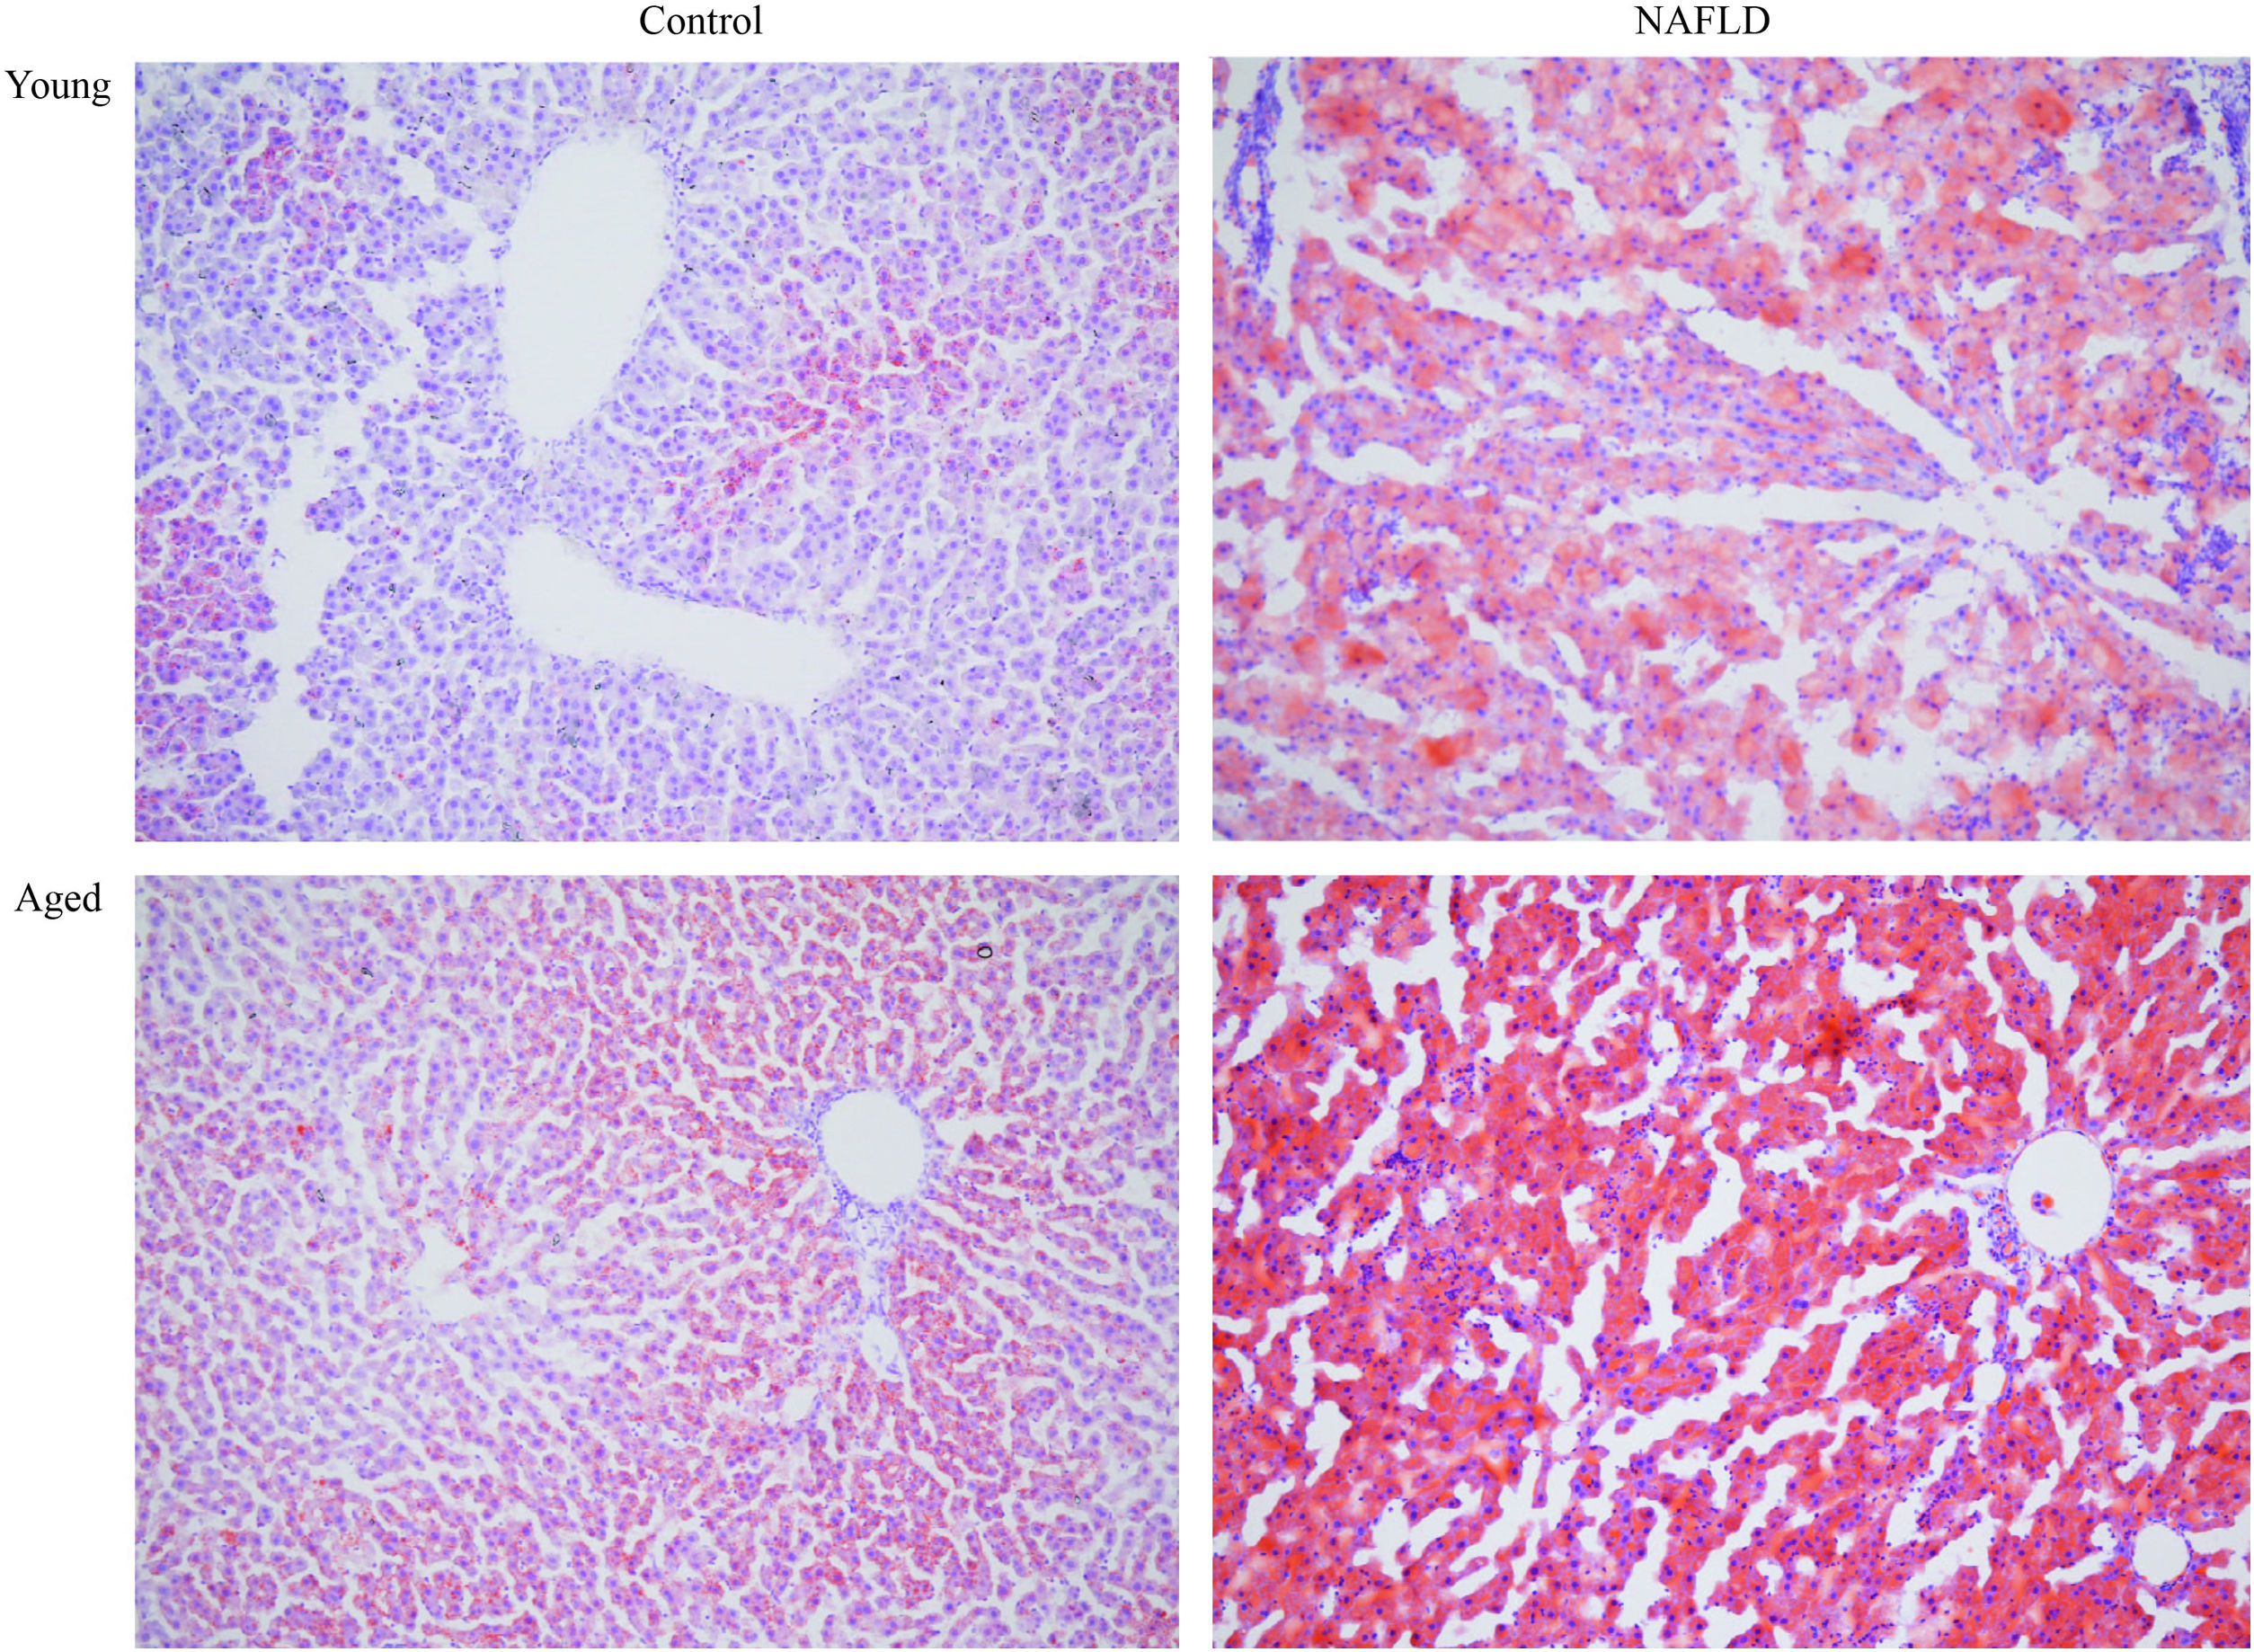
Under a light microscope, the liver tissues from NAFLD groups had damaged hepatic lobes with narrow or even absent sinus hepaticus, with fat vacuoles occupied the cytoplasm. All of which met the histological features of NAFLD [11]. Disarranged and diffuse enlargement of hepatocytes was observed in the NAFLD group, particularly in the aged NAFLD group, resulting in the cell nuclei being compressed to one side (Fig. 1). Aged NAFLD group exhibited predominantly macrosteatosis, with a little ballooning injury of the hepatocytes. NAFLD activity score (NAS) for the aged NAFLD group was 5.00±0.74, which was higher than that for the young NAFLD group (1.92±0.99, P<0.001) and the aged control group (0.75±0.45, P<0.001) (Fig. 2). NAFLD severity was more obvious in aged NAFLD group. Results of the Oil Red O assay further showed that more lipid droplets were deposited in NAFLD groups, particularly in the aged NAFLD group (Fig. 3).
. Compared with young groups, hepatic cells of the aged groups were significantly larger. Hepatocytes of the NAFLD groups were disarranged, diffuse and enlarged. Fat vacuoles occupied the cytoplasm, compressed cell nuclei to one side, particularly in the aged NAFLD group. Percent macrosteatosis: H&E staining revealed predominantly macrosteatosis in 90% of hepatic cells in aged NAFLD group, which is higher than in young NAFLD group (45%) and aged control group (6%). No macrosteatosis was observed in young control group (0%). H&E, hematoxylin and eosin; NAFLD, non-alcoholic fatty liver disease.")
H&E staining of liver tissues (magnification, 200×). Compared with young groups, hepatic cells of the aged groups were significantly larger. Hepatocytes of the NAFLD groups were disarranged, diffuse and enlarged. Fat vacuoles occupied the cytoplasm, compressed cell nuclei to one side, particularly in the aged NAFLD group. Percent macrosteatosis: H&E staining revealed predominantly macrosteatosis in 90% of hepatic cells in aged NAFLD group, which is higher than in young NAFLD group (45%) and aged control group (6%). No macrosteatosis was observed in young control group (0%). H&E, hematoxylin and eosin; NAFLD, non-alcoholic fatty liver disease.

. Adipocytes are red and the nucleus is blue. More accumulation of lipid droplets was observed in NAFLD groups, which caused the pushing of the nucleus toward one side, particularly in the aged NAFLD group. NAFLD, non-alcoholic fatty liver disease.")
Oil-red-O staining of liver tissues (magnification, 100×). Adipocytes are red and the nucleus is blue. More accumulation of lipid droplets was observed in NAFLD groups, which caused the pushing of the nucleus toward one side, particularly in the aged NAFLD group. NAFLD, non-alcoholic fatty liver disease.
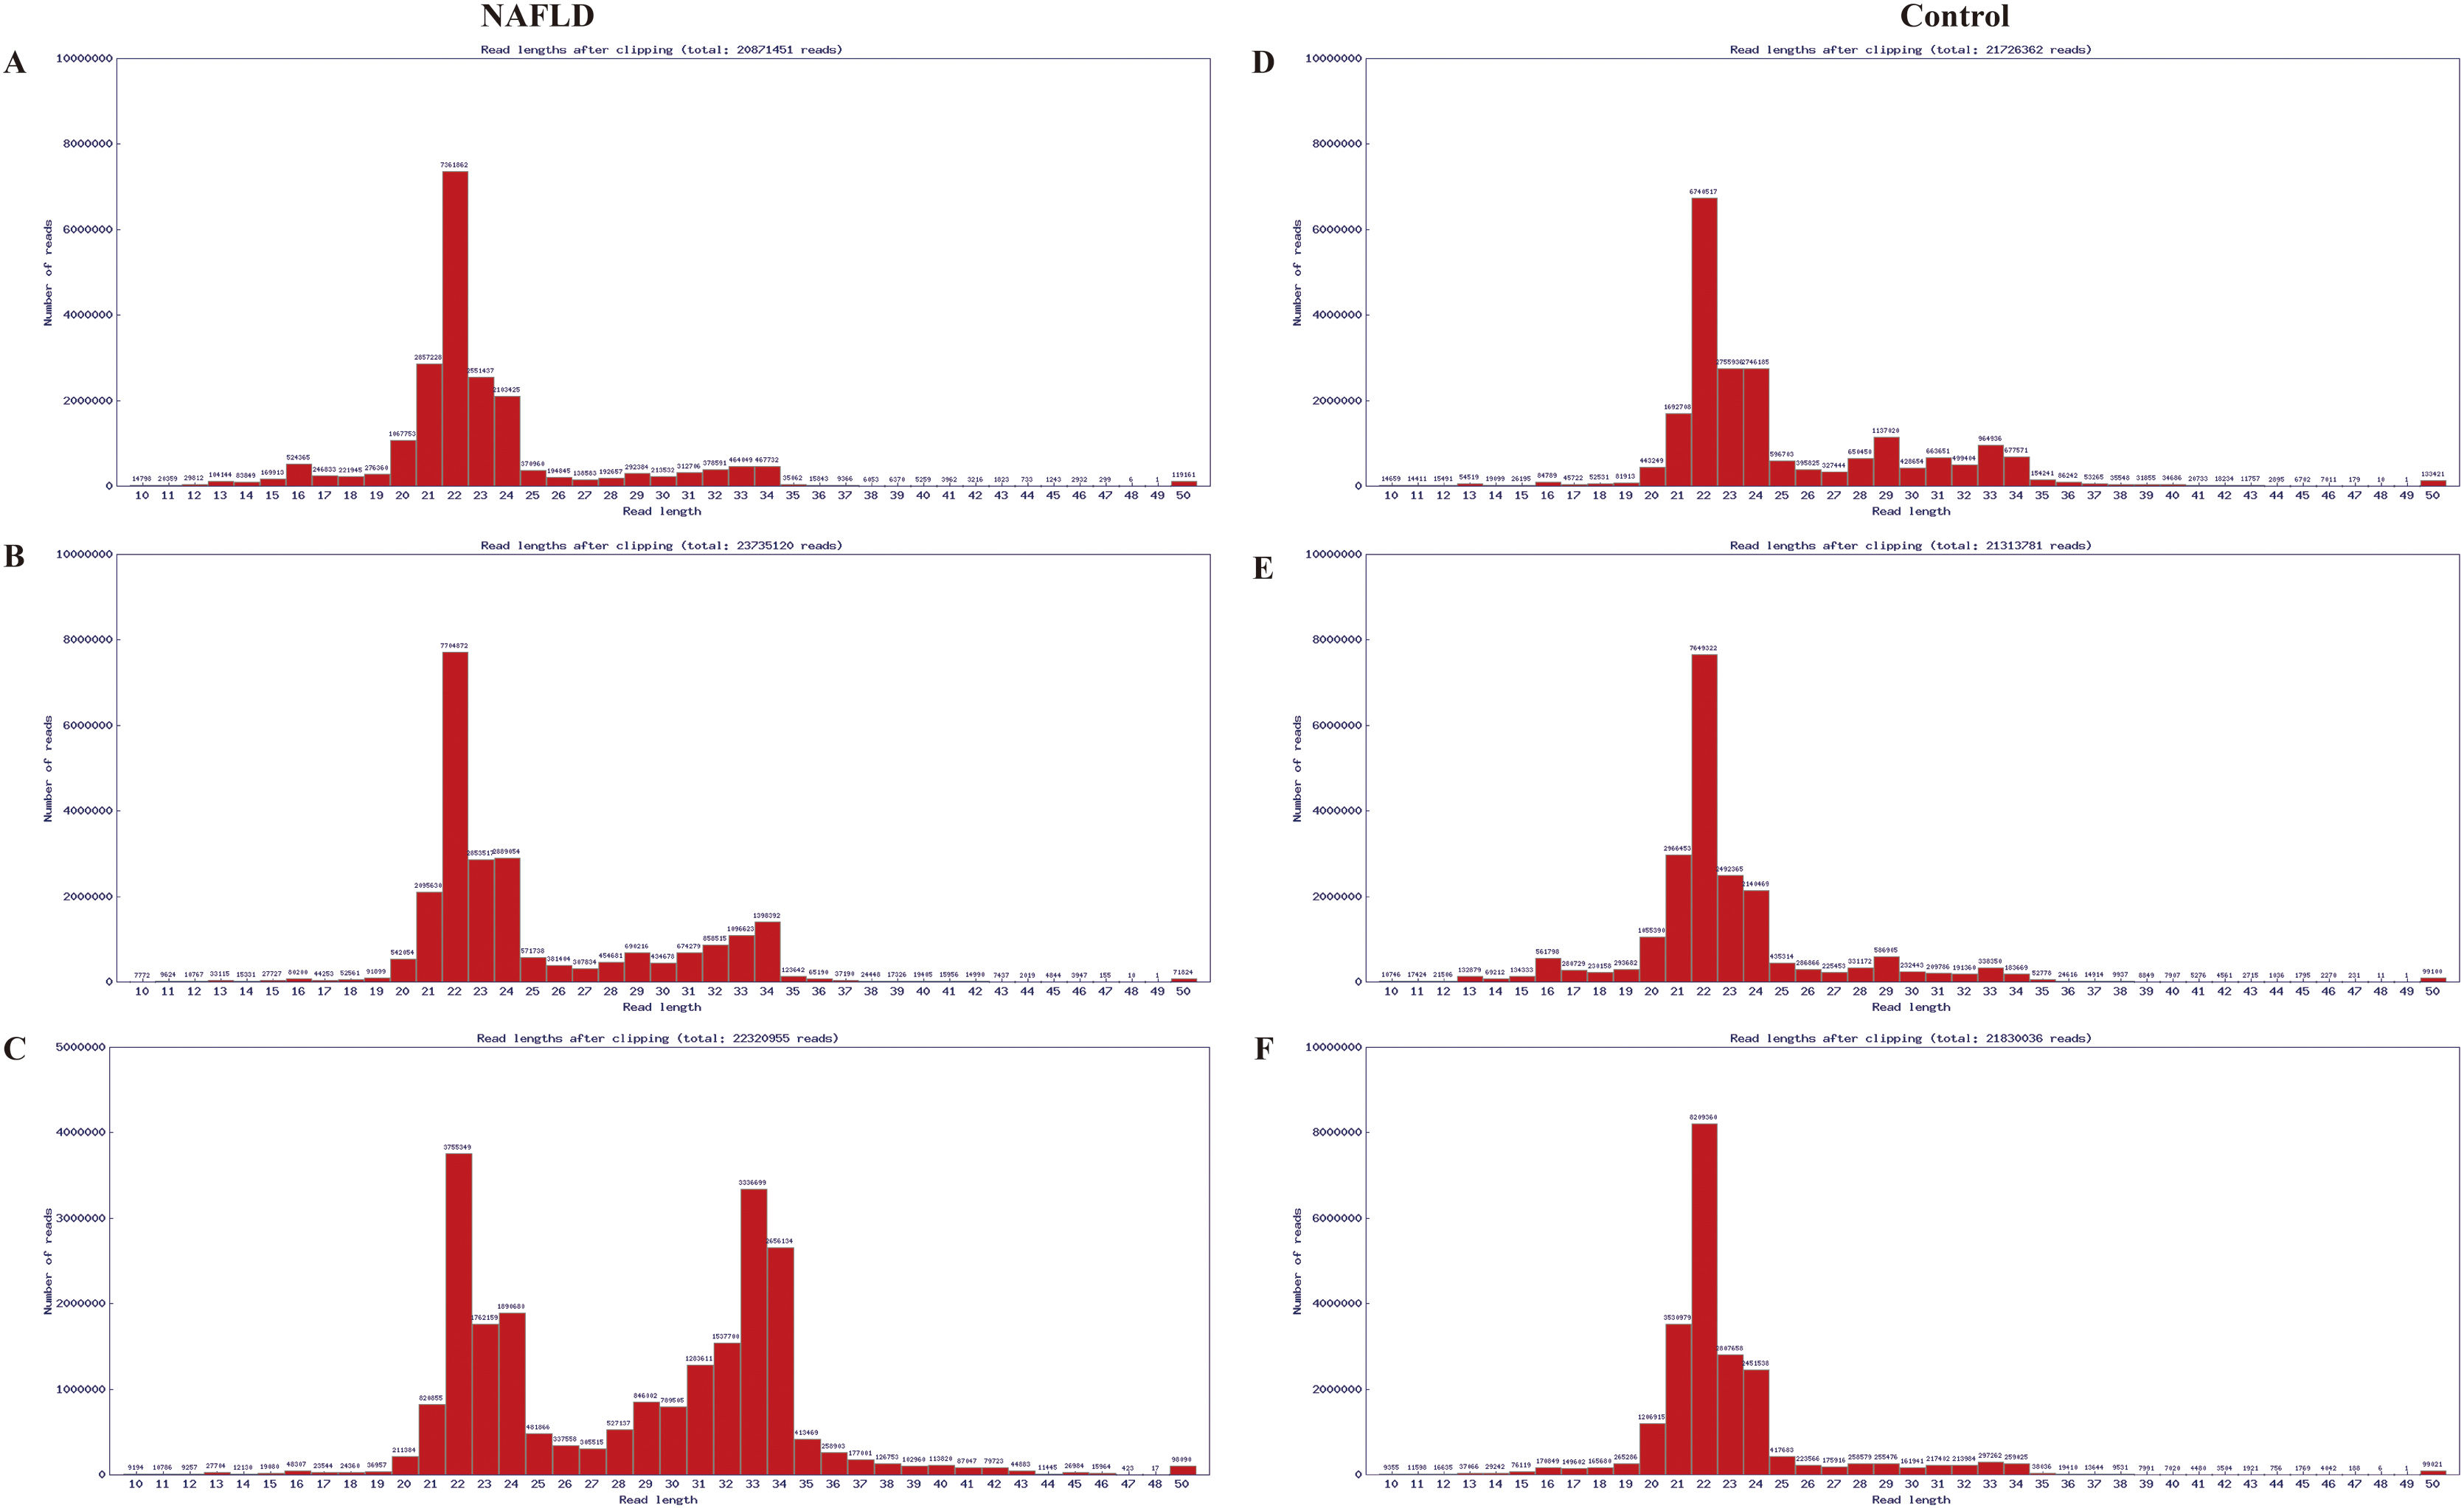
The RNA integrity number of all RNA samples was ≥7.0 and the 28S:18S ratio was ≥0.7. Results of electrophoresis confirmed the high purity of RNAs. The distribution of valid sequences in the two experimental groups had apparent similarities: The mature miRs ranged principally from 21 to 24 nt in length (mostly 22 nt) (Fig. A.1), indicating that the samples contained a concentrated distribution of RNA fragments, enabling subsequent successful bioinformatics analysis.
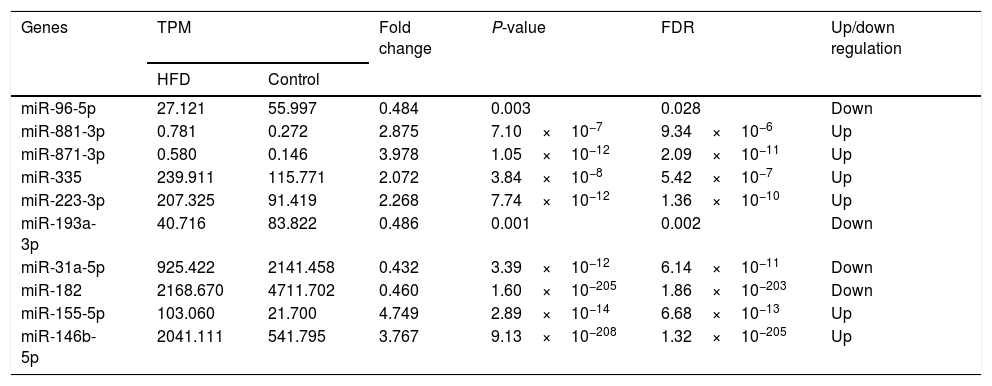
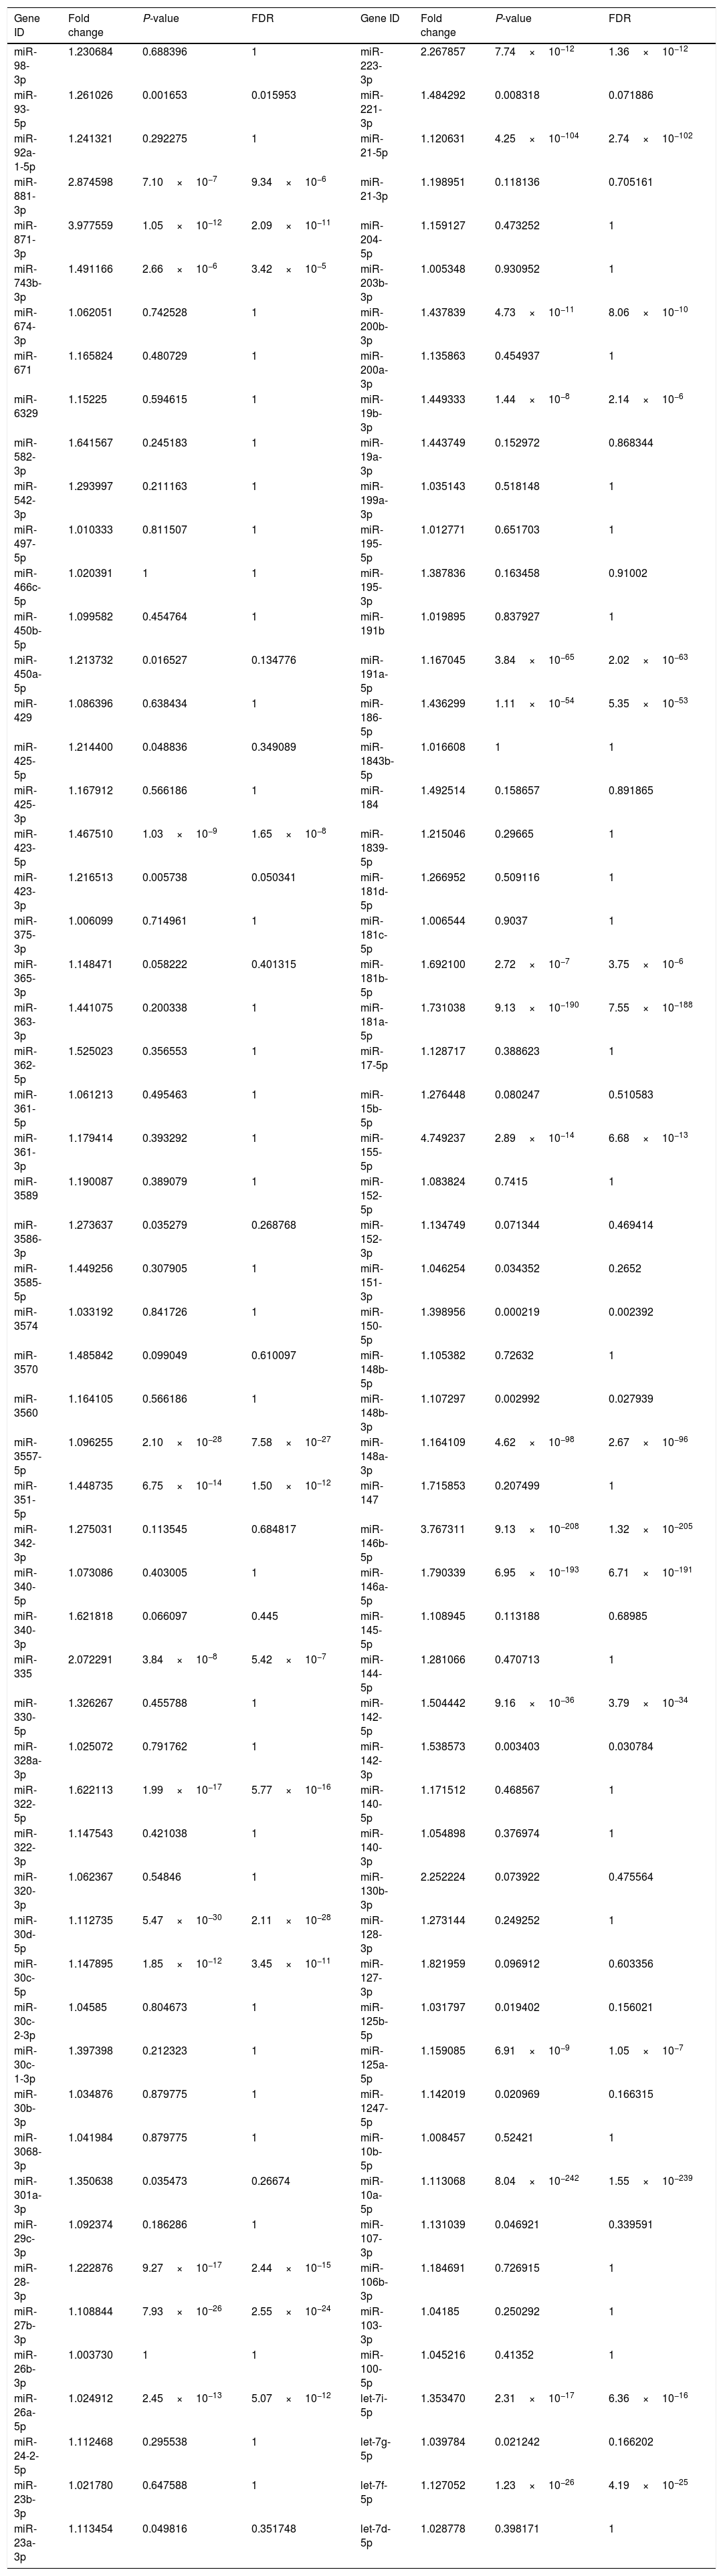
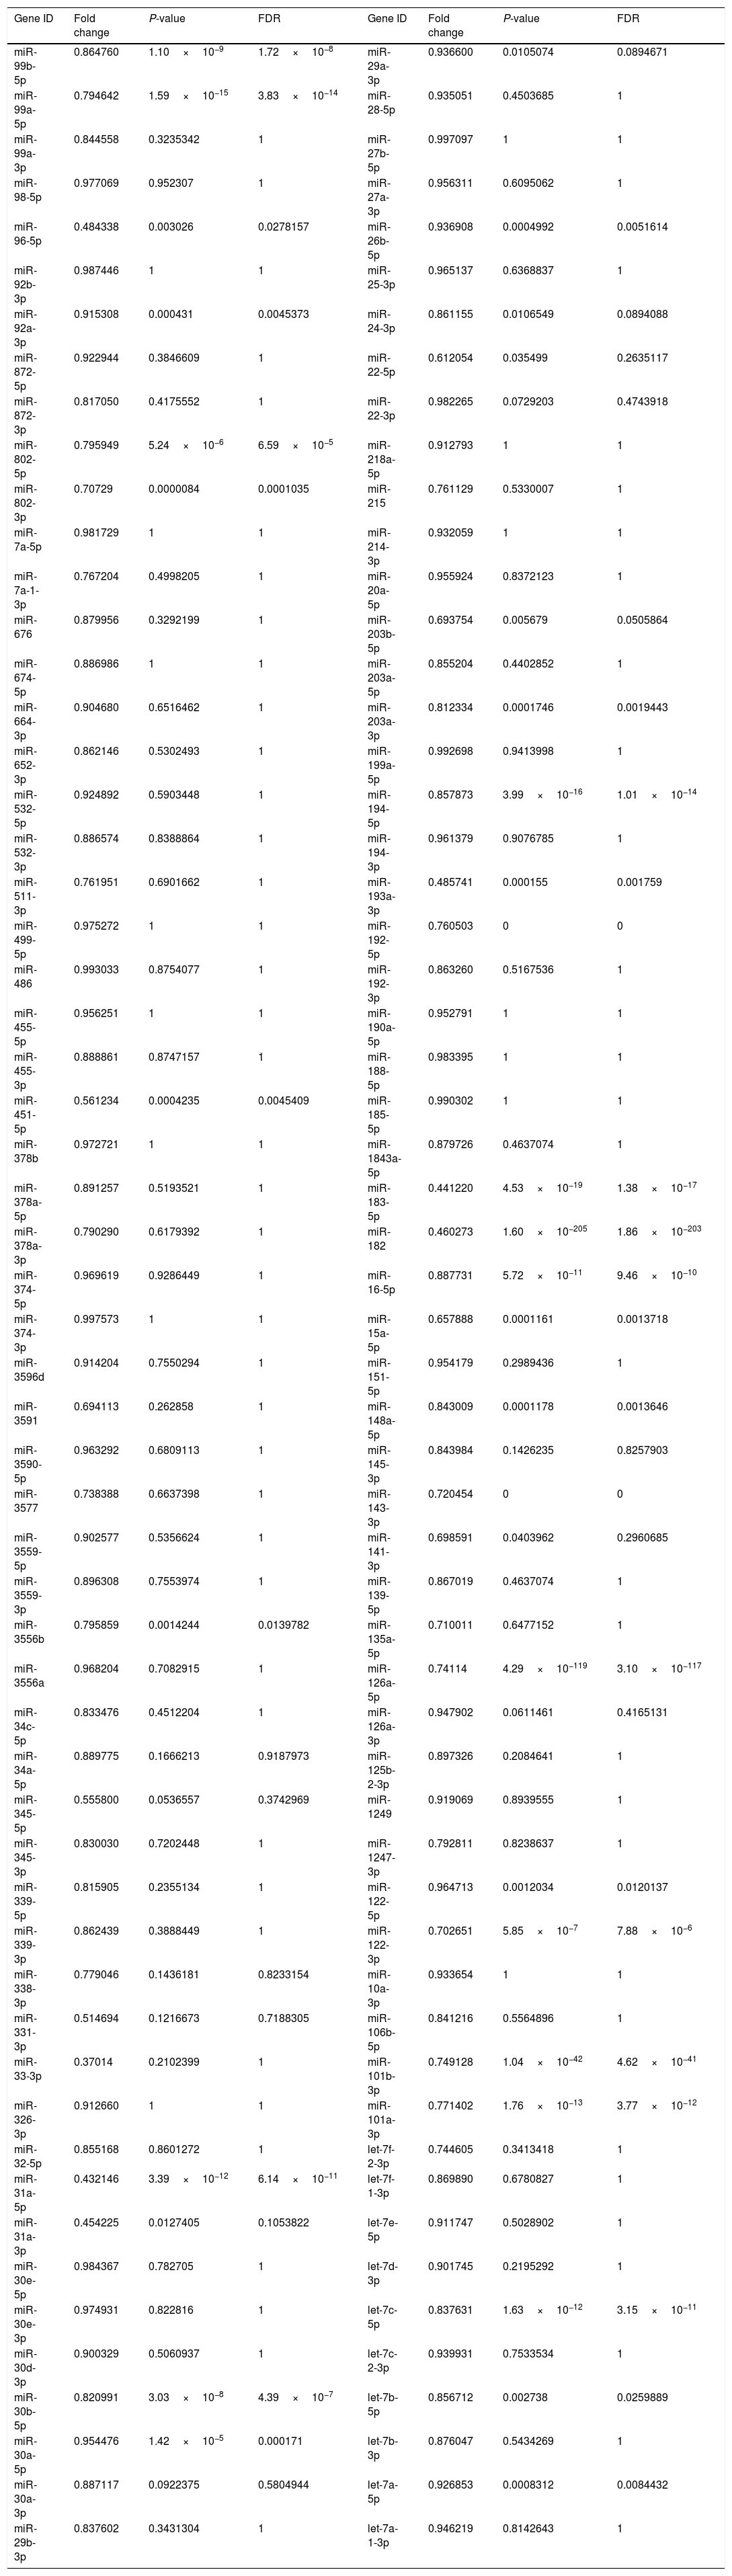
3.4High-throughput sequencing and identification of DE-miRsHepatic miR expression profiles were analyzed using edgeR software. After normalization of the TPM value, it was revealed that compared with aged control hepatic tissues, 116 miRs (Table A.1) were upregulated in the aged NAFLD hepatic tissues, of which 6 (miR-881-3p, miR-871-3p, miR-335, miR-223-3p, miR-155-5p, miR-146b-5p) were significantly upregulated. In addition, 116 miRs were downregulated (Table A.2), of which 4 (miR-96-5p, miR-193-3p, miR-182, miR-31a-5p) were significantly downregulated (Table 3).
Differently expressed miRs in the aged NAFLD group vs. in control group.
| Genes | TPM | Fold change | P-value | FDR | Up/down regulation | |
|---|---|---|---|---|---|---|
| HFD | Control | |||||
| miR-96-5p | 27.121 | 55.997 | 0.484 | 0.003 | 0.028 | Down |
| miR-881-3p | 0.781 | 0.272 | 2.875 | 7.10×10⁻⁷ | 9.34×10⁻⁶ | Up |
| miR-871-3p | 0.580 | 0.146 | 3.978 | 1.05×10⁻¹² | 2.09×10⁻¹¹ | Up |
| miR-335 | 239.911 | 115.771 | 2.072 | 3.84×10⁻⁸ | 5.42×10⁻⁷ | Up |
| miR-223-3p | 207.325 | 91.419 | 2.268 | 7.74×10⁻¹² | 1.36×10⁻¹⁰ | Up |
| miR-193a-3p | 40.716 | 83.822 | 0.486 | 0.001 | 0.002 | Down |
| miR-31a-5p | 925.422 | 2141.458 | 0.432 | 3.39×10⁻¹² | 6.14×10⁻¹¹ | Down |
| miR-182 | 2168.670 | 4711.702 | 0.460 | 1.60×10−205 | 1.86×10−203 | Down |
| miR-155-5p | 103.060 | 21.700 | 4.749 | 2.89×10⁻¹⁴ | 6.68×10⁻¹³ | Up |
| miR-146b-5p | 2041.111 | 541.795 | 3.767 | 9.13×10−208 | 1.32×10−205 | Up |
TPM, transcripts per million; TPM=(miR read number/total read number)×106. Fold change: The ratio of read counts in HFD group to that in control group, fold change=TPMHFD/TPMControl. FDR, false discovery rate. After normalization, obtained average values for each miR spot were used for statistics. miR with expression fold change >2 or <0.5, and with FDR <0.05 was considered statistically significant.
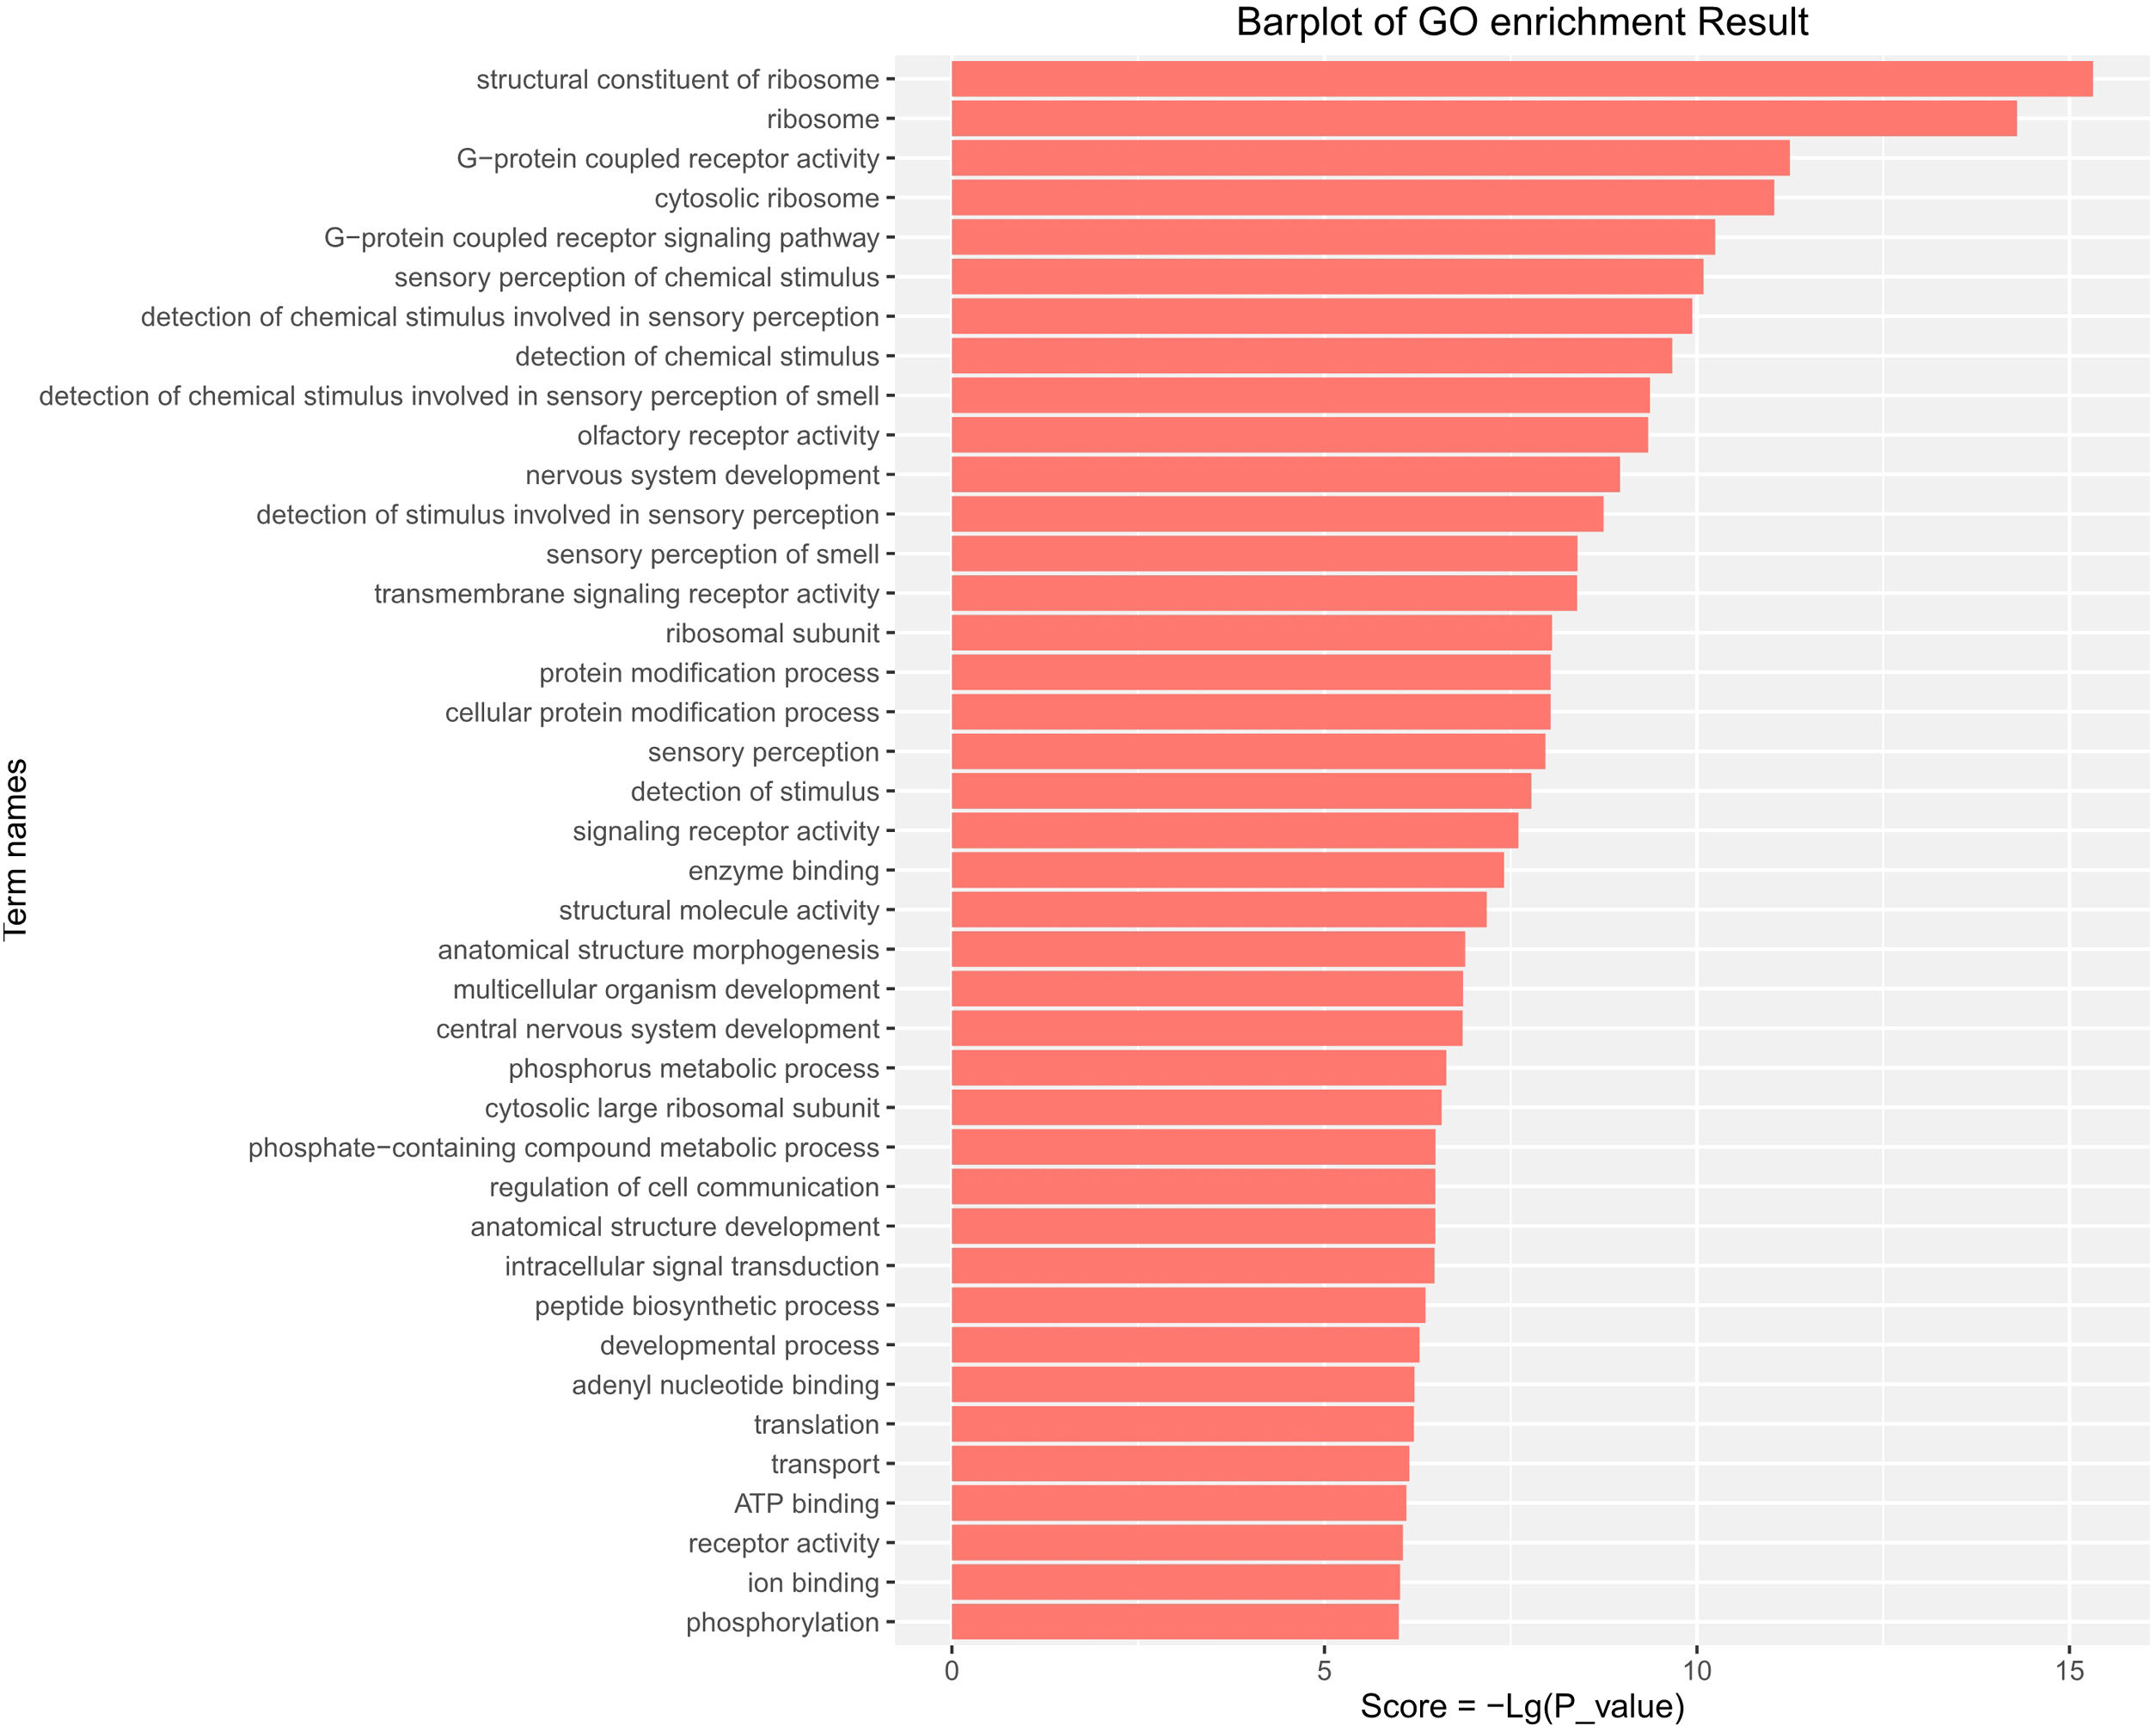
GO functional enrichment analysis indicated that the DE-miRs were associated with four cell components, including the ribosome, cytosolic ribosome, ribosomal subunit, and cytosolic large ribosomal subunit. Further analysis demonstrated that the DE-miRs were associated with 11 molecular functions, including G-protein coupled receptor activity, signaling receptor activity, enzyme binding and ATP binding, and had involvement in the regulation of 25 biological processes, such as the G-protein coupled receptor signaling pathway, protein modification process, phosphorus metabolic process, intracellular signal transduction, developmental process and phosphorylation (P<0.01) (Fig. 4).
. The higher the enrichment score is, the more specific the corresponding function is. X-coordinate represents the negative logarithm of P(−Lg; P_value). Y-coordinate denotes the name of the path. GO, Gene Ontology; miRs, microRNAs.")
GO pathway analysis of the differentially expressed miRs in the aged rats. Enrichment score is equal to −log10(P_value). The higher the enrichment score is, the more specific the corresponding function is. X-coordinate represents the negative logarithm of P(−Lg; P_value). Y-coordinate denotes the name of the path. GO, Gene Ontology; miRs, microRNAs.
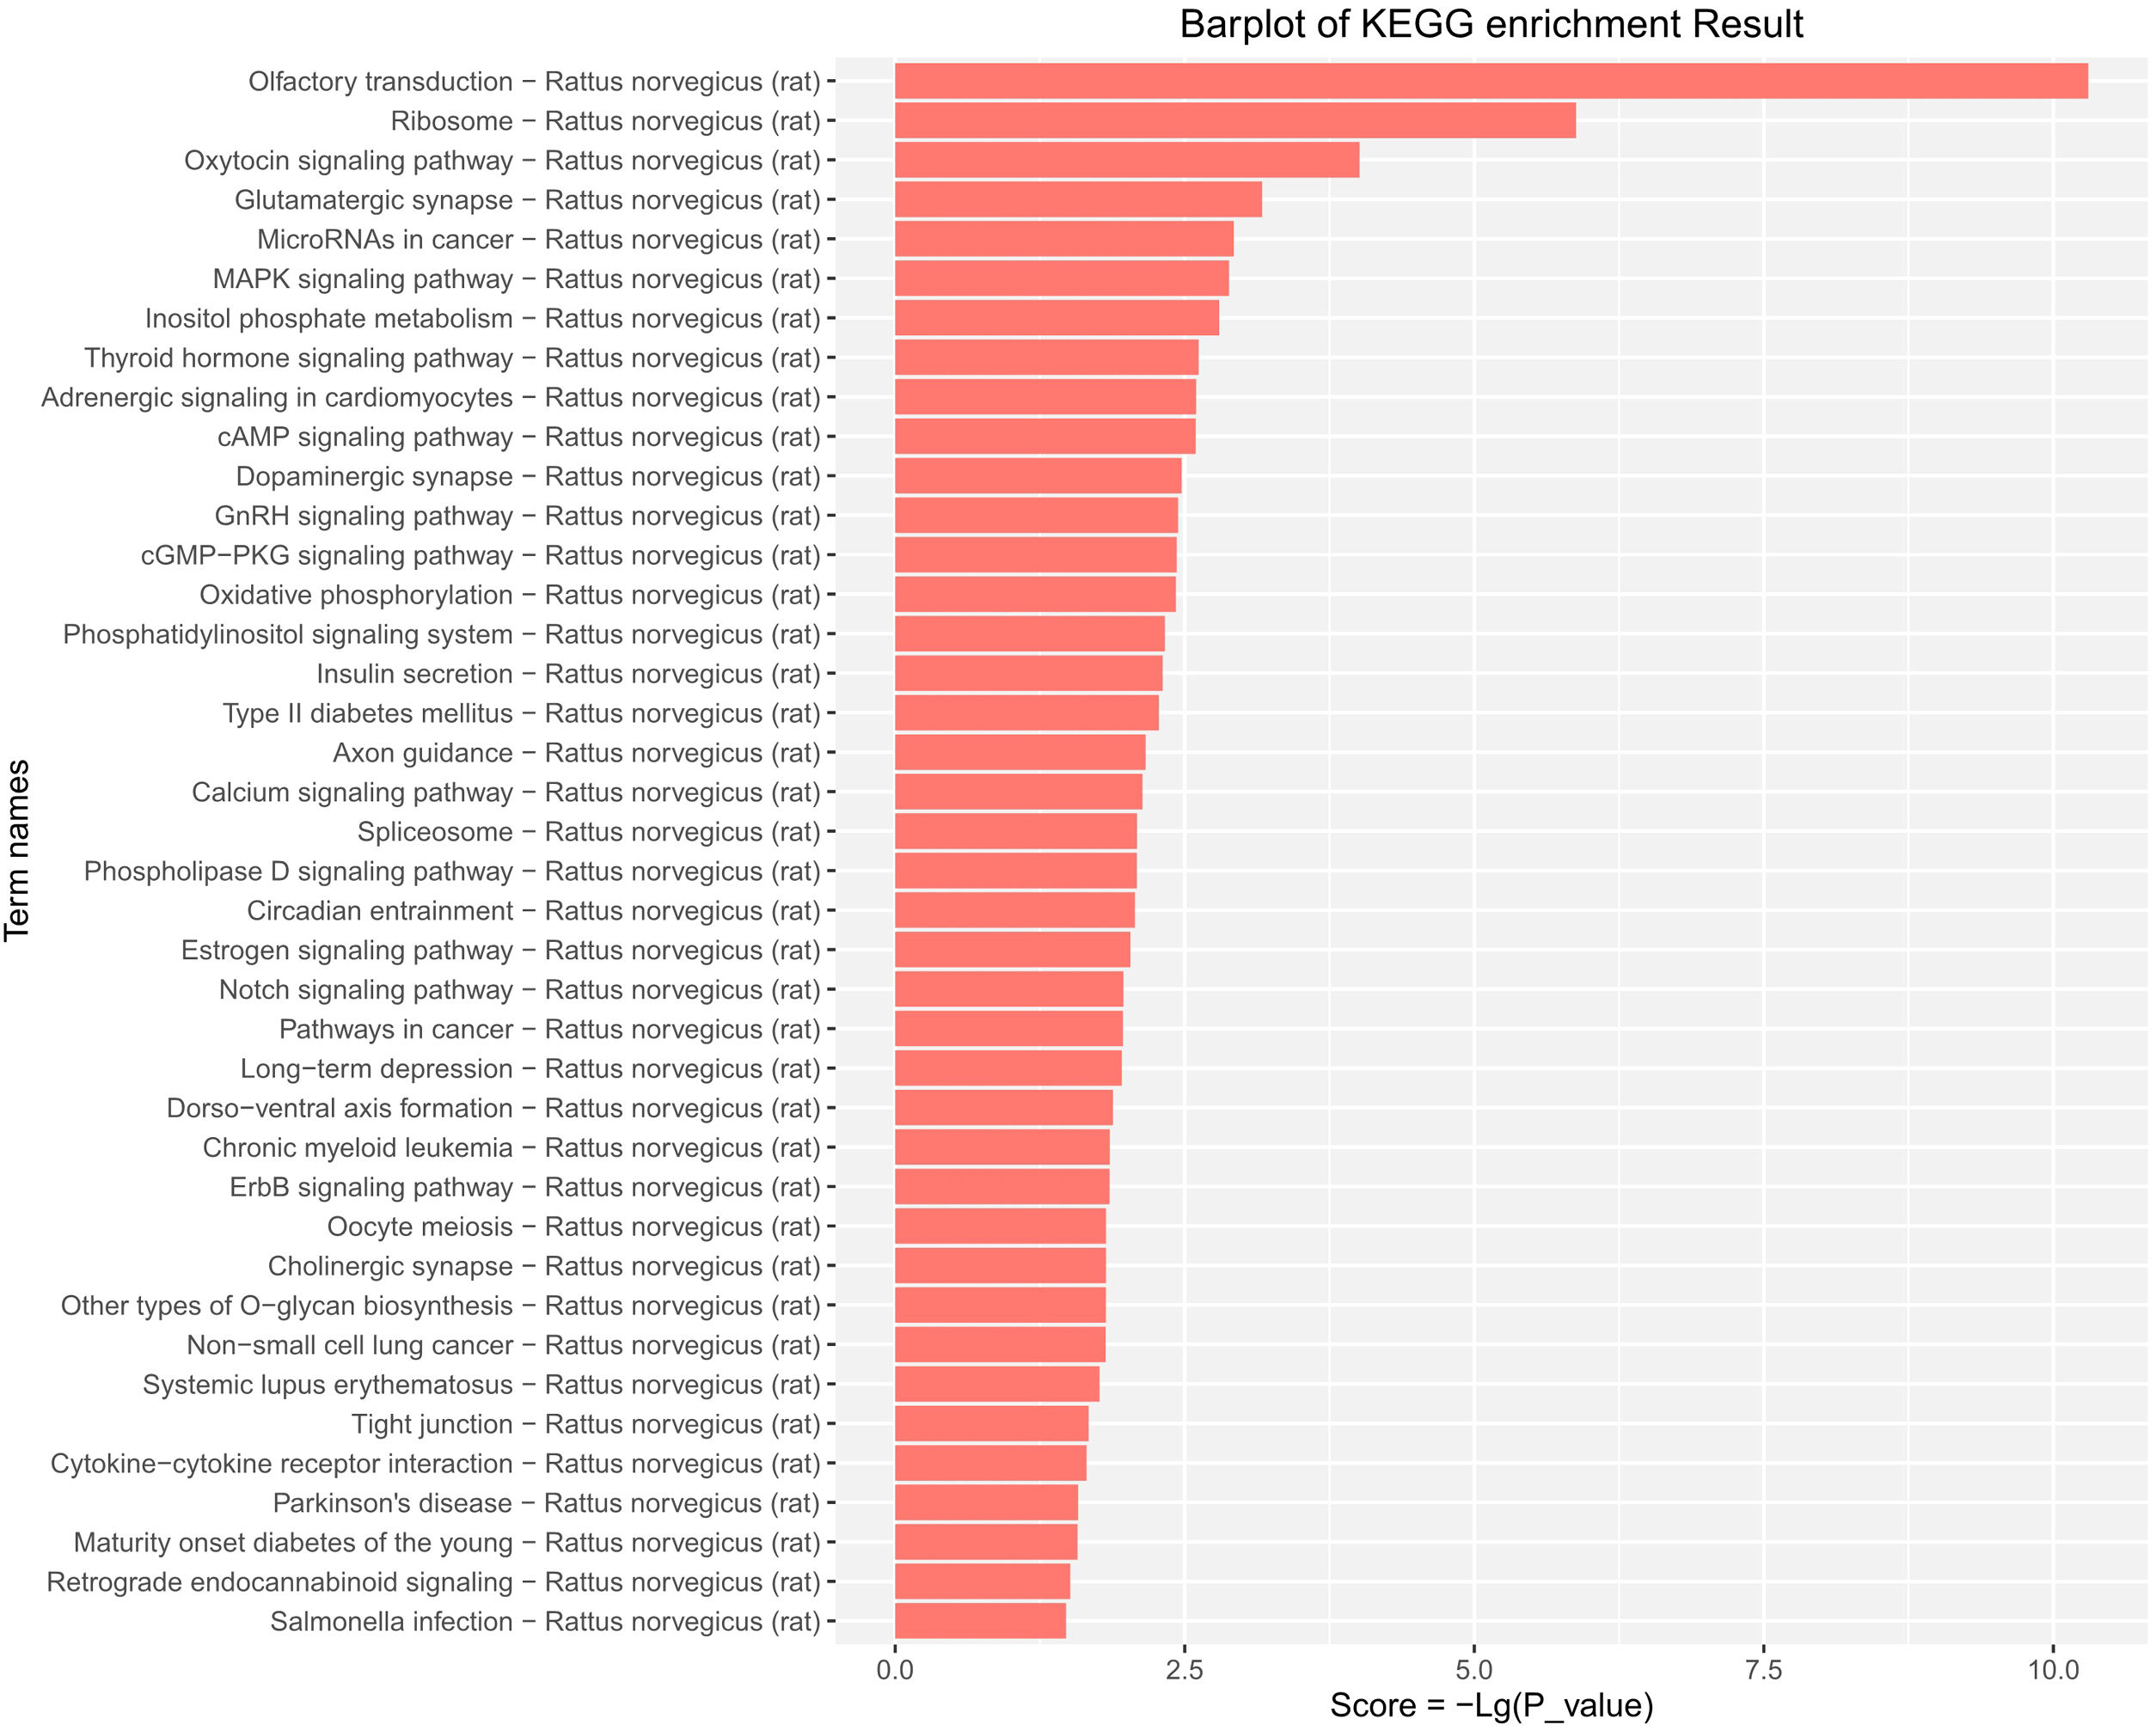
KEGG pathway enrichment analysis provided evidence that the DE-miRs were significantly enriched in MAPK, cAMP, pathways relevant to insulin secretion, glycerophospholipid metabolism, and certain age-related diseases including cancer, type-II diabetes, long-term depression and Parkinson's disease (P<0.05) (Fig. 5).
. The higher the enrichment score is, the more specific the corresponding signaling pathway is. X-coordinate represents the negative logarithm of P(−Lg; P_value). Y-coordinate denotes the name of the path. KEGG, Kyoto Encyclopedia of Genes and Genomes; miRs, microRNAs.")
KEGG pathway analysis of the differentially expressed miRs in the aged rats. Enrichment score is equal to −log10(P_value). The higher the enrichment score is, the more specific the corresponding signaling pathway is. X-coordinate represents the negative logarithm of P(−Lg; P_value). Y-coordinate denotes the name of the path. KEGG, Kyoto Encyclopedia of Genes and Genomes; miRs, microRNAs.
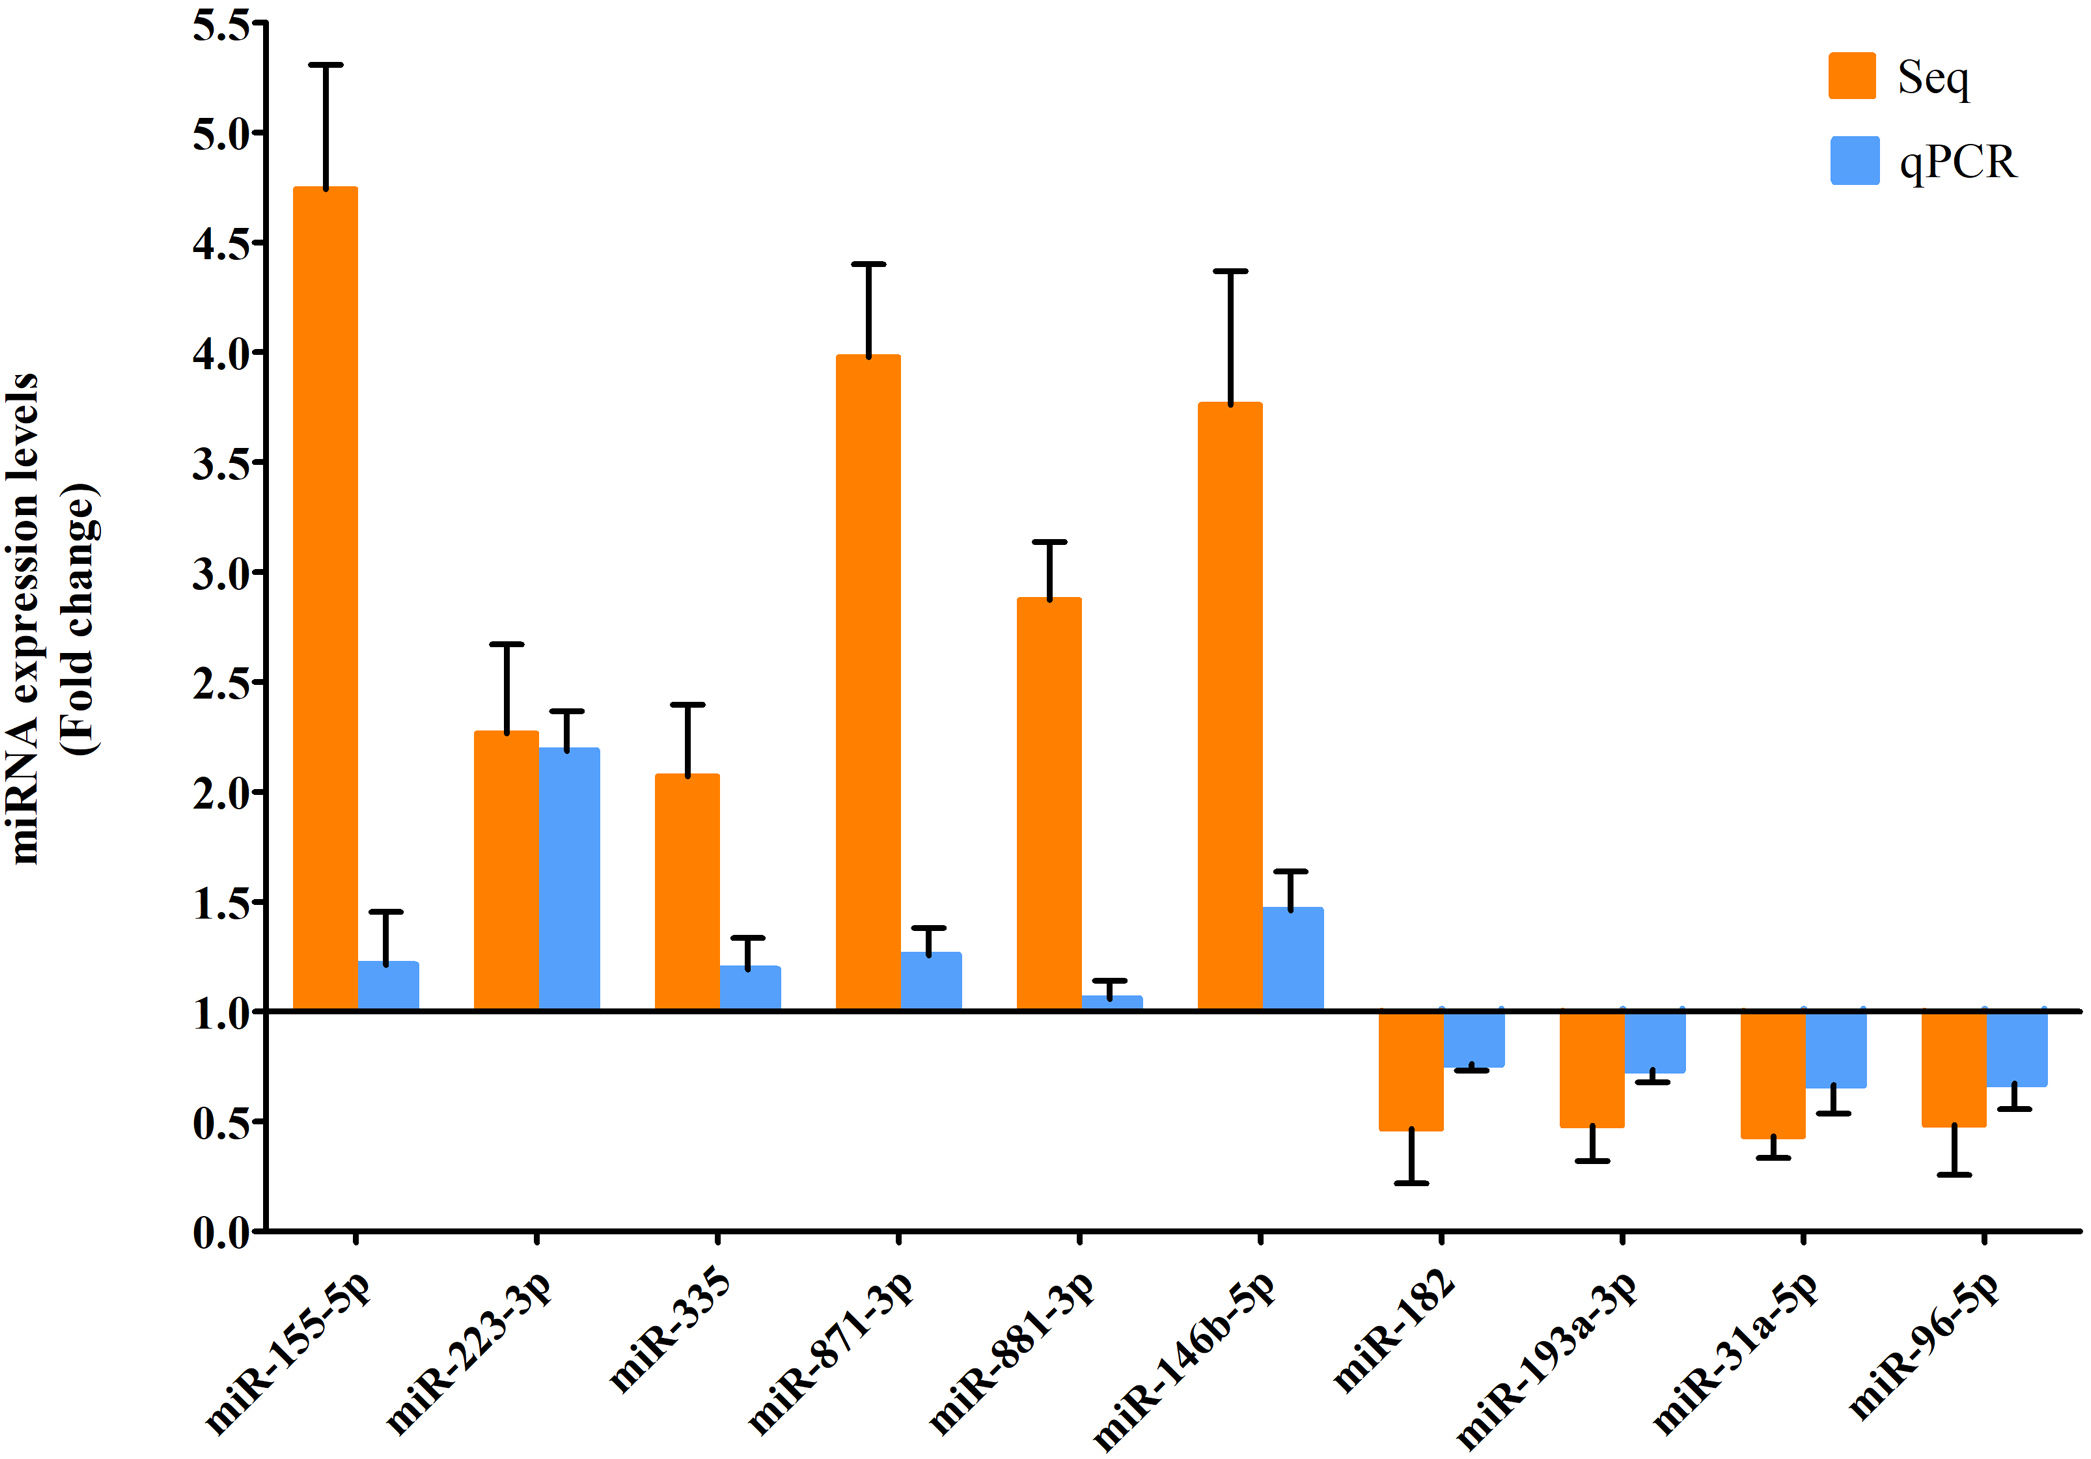
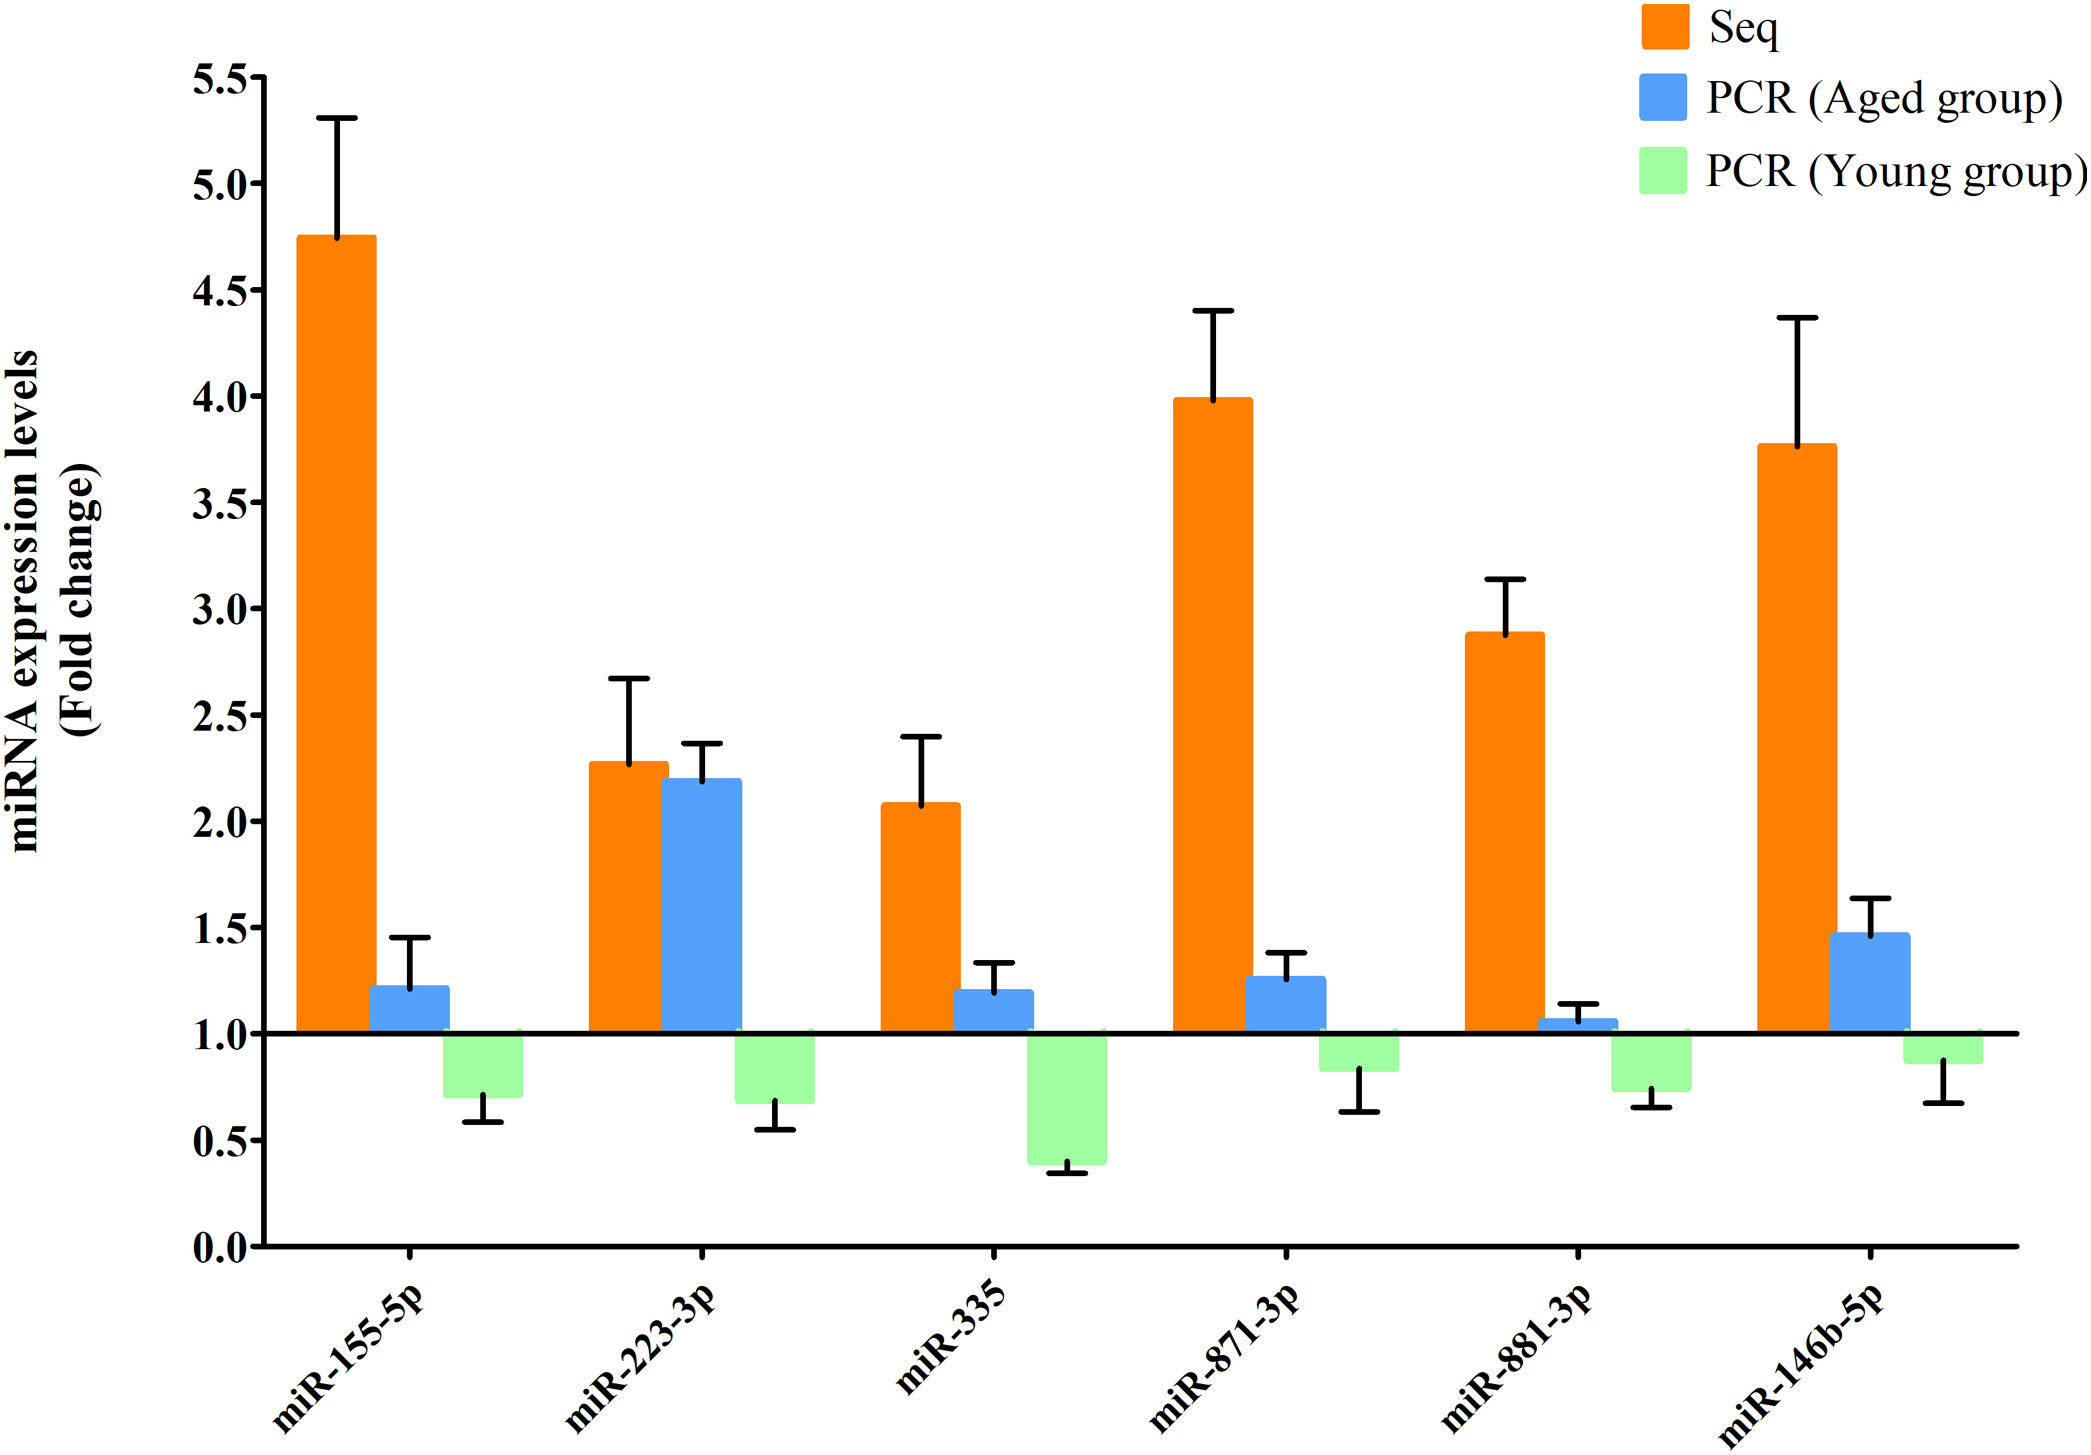
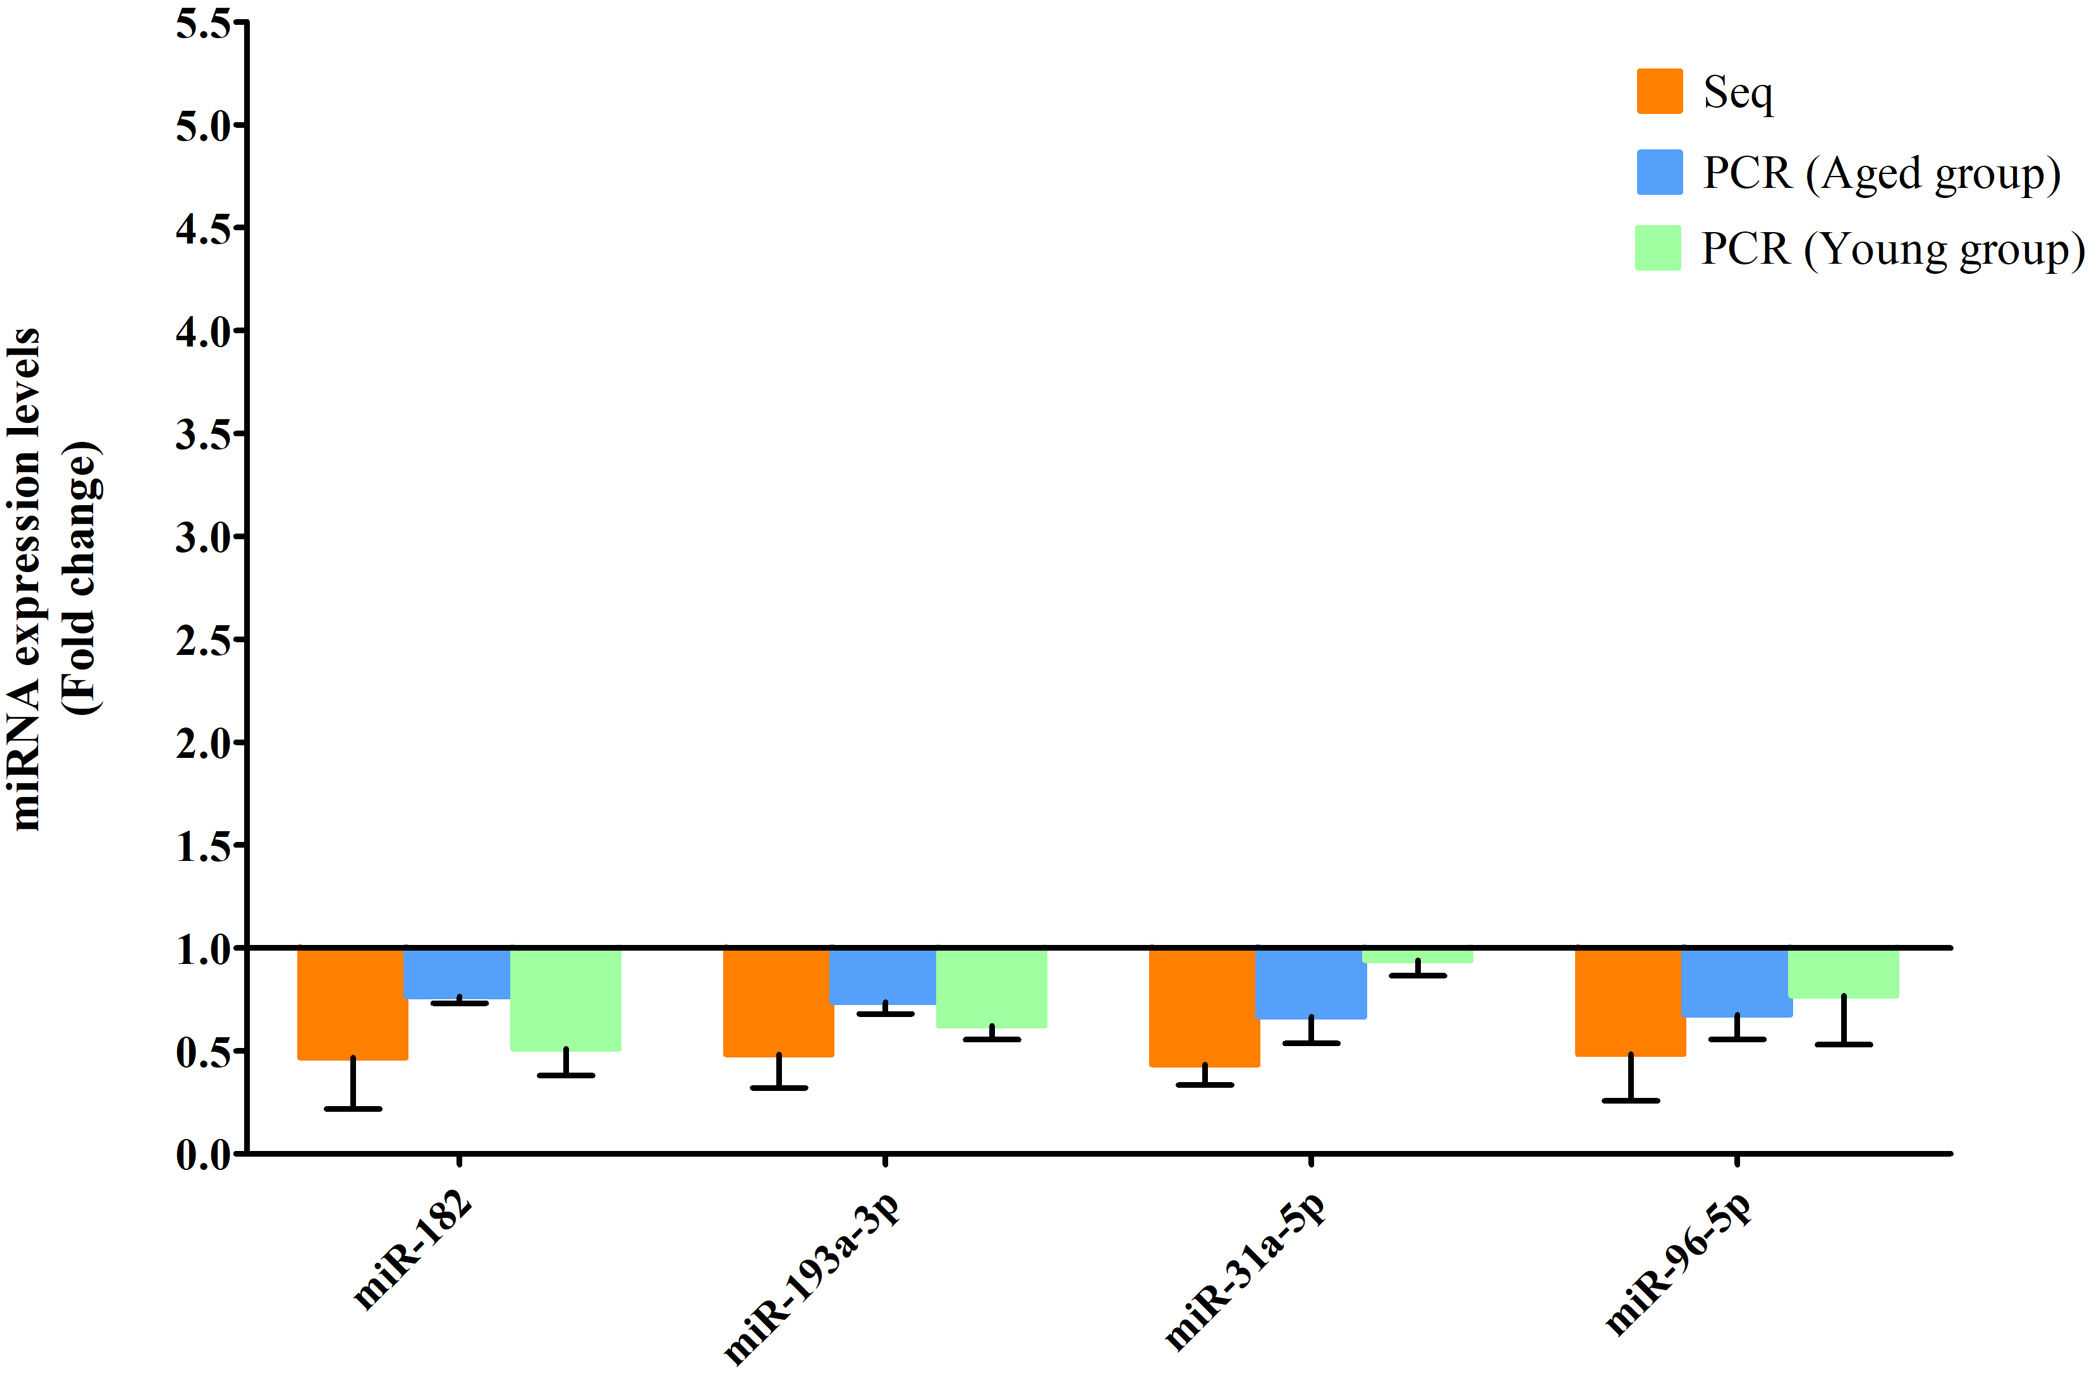
RT-qPCR was conducted to verify the expression status of the DE-miRs in the aged groups. The results demonstrated that 6 upregulated miRs (miR-155-5p, miR-223-3p, miR-335, miR-871-3p, miR-881-3p and miR-146b-5p) and 4 downregulated miRs (miR-182, miR-193-3p, miR-31a-5p and miR-96-5p) identified through high-throughput sequencing displayed a similar trend of expression when evaluated using RT-qPCR (Fig. 6), indicating a high consistency in the aged groups between these two techniques. However, no such upregulation trends regarding the 6 upregulated miRs (miR-155-5p, miR-223-3p, miR-335, miR-871-3p, miR-881-3p and miR-146b-5p) were found in the young NAFLD group (Fig. 7). Of note, miR-223-3p demonstrated a higher upregulated expression level in the aged NAFLD group (fold change=2.268, P=7.74×10⁻¹²) by both high-throughput sequencing and RT-qPCR; however, which was not presented in the young NAFLD group (Fig. 7). While 4 downregulated miRs (miR-182, miR-193-3p, miR-31a-5p and miR-96-5p) in the aged NAFLD group were also indicated to be significantly downregulated in the young NAFLD group (Fig. 8).
 with a false discovery rate (FDR) of <0.05.")
Verification of differentially expressed miRs in the aged rats by RT-qPCR analysis. Y-coordinate represents fold change of miR expression levels in liver tissues of aged NAFLD group vs. aged control group, that is, the ratio of miR expression levels in aged NAFLD group to that in aged control group. miR-155-5p, miR-223-3p, miR-335, miR-871-3p, miR-881-3p and miR-146b-5p were significantly increased, whereas miR-182, miR-193-3p, miR-31a-5p and miR-96-5p were significantly decreased in aged NAFLD rats compared with control rats. miRs, microRNAs; Seq, high-throughput sequencing; qPCR, reverse transcription-quantitative polymerase chain reaction. In high-throughput sequencing analysis, differentially expressed miRs were defined as the fold change in expression of >2 or <0.5 between the two groups (aged NAFLD group and aged control group) with a false discovery rate (FDR) of <0.05.
 were not found in the young group. miRs, microRNAs; Seq, high-throughput sequencing; qPCR, reverse transcription-quantitative polymerase chain reaction.")
Upregulated miRs in the aged and young groups were assessed using RT-qPCR analysis. Y-coordinate represents fold change of miR expression levels in liver tissues of NAFLD group vs. the control group. The upregulation trends of the 6 identified upregulated miRs (miR-155-5p, miR-223-3p, miR-335, miR-871-3p, miR-881-3p and miR-146b-5p) were not found in the young group. miRs, microRNAs; Seq, high-throughput sequencing; qPCR, reverse transcription-quantitative polymerase chain reaction.

Downregulated miRs in the aged and young groups were assessed using RT-qPCR. Y-coordinate represents fold change of miR expression levels in liver tissues of NAFLD group vs. the control group. The 4 downregulated miRs identified through high-throughput sequencing, that is, miR-182, miR-193-3p, miR-31a-5p and miR-96-5p, were also downregulated in the young NAFLD group which were assessed by RT-qPCR. miRs, microRNAs; Seq, high-throughput sequencing; qPCR, reverse transcription-quantitative polymerase chain reaction.
Hepatic insulin resistance is thought to be a core component of NAFLD [20]. HOMA-IR is a generally accepted method for quantifying insulin resistance in epidemiological studies. In the present study, serum insulin and HOMA-IR levels were significantly higher in the aged NAFLD group, which proved that insulin resistance occurred in aged NAFLD rats induced by high fat diet. Because of the unique process of natural aging and life habits conform to the human NAFLD evolution process [21], SD rats have been widely used in the fields of gerontology and geriatrics.
As we all know, aging and insulin resistance are complex biological processes regulated by multiple signaling pathways, and dysregulation of these pathways may lead to the initiation of disease or its progression. Currently, increasing evidence has revealed the etiological and epidemiological features of NAFLD, contributing to great progress in the diagnosis and prevention of NAFLD; however the detailed molecular mechanisms underlying the development of NAFLD in aged populations remain unclear. It has been reported that miRs functioned as crucial posttranscriptional regulators in liver metabolism [22,23]. Abnormally expressed miRs can bind to the 3′-UTR region of certain age-related genes, thereby altering their expression and affecting the aging process [7].
In the present study, a total of 10 differentially expressed miRs (6 upregulated and 4 downregulated) were identified through high-throughput sequencing technology in the aged rats with NAFLD, which confirmed by RT-qPCR analysis. Previous studies have reported that the most abundant miR in fatty liver was miR-122 which participated in the modulation of cholesterol and fatty acid metabolism [24,25]. Underexpression of miR-122 potentially contributes to altered lipid metabolism implicated in the pathogenesis of NASH [26]. Other highly-expressed miRs in fatty liver included miR-34a [27,28], miR-146a and miR-200b [29–31], which may affect the development of NAFLD by regulating the inflammatory response in lipopolysaccharide-stimulated Kupffer cells. However, expression patterns of the above mentioned miRs were not reflected in the present study. Furthermore, the 6 identified upregulated miRs (miR-881-3p, miR-871-3p, miR-335, miR-223-3p, miR-155-5p and miR-146b-5p) in the aged NAFLD group were not significantly upregulated in hepatic tissues of the young NAFLD group, further confirming that these identified DE-miRs were actually age related. A possible explanation for this discrepancy is that aging rats were used as subjects in the present study, and the impact of aging itself was excluded on the differential expression of miRs. Notably, NAFLD-associated miRs involved in regulating insulin resistance in aging organisms are different from that of young individuals. It remains unclear how these DE-miRs may affect lipid homeostasis of NAFLD in senescent organisms, and how they induce or aggravate the occurrence of hepatic insulin resistance of aged NAFLD. Some specific studies may be made to elicit how these DE-miRs effect on the pathogenesis of fatty liver and steatohepatitis in the elderly from a functional perspective.
It is estimated that miRs regulate 30–60% of protein-encoding genes, through which they exert an important influence on the pathological processes of many diseases [32]. Therefore, systemic prediction and identification of target genes regulated by a set of miRs during a pathological process, rather than analyzing a single miR-target interaction can provide a more accurate understanding of miR-based regulatory mechanisms in a particular disease.
In the present study, the 10 identified DE-miRs expressed in the aged NAFLD were found to be involved functionally in many biological processes, including intracellular signaling transduction, regulation of metabolism, the developmental process and phosphorylation. Furthermore, the results of KEGG enrichment analysis demonstrated that these DE-miRs were mainly enriched in mitogen-activated protein kinase and cAMP signaling, which are pathways closely associated with insulin secretion and glycerophospholipid metabolism. Moreover, the DE-miRs were also found to be associated with signaling pathways related to some senile diseases, including cancer, type II diabetes, long-term depression and Parkinson's disease, suggesting that they may also participate in the regulation of a number of other age-related biological processes, such as tumor formation or diseases of the nervous system.
In order to evaluate the specific effects of these DE-miRs on regulating lipid intake of the aged hepatic cells further and elucidate how they involve in this procedure, we intend to search for and verify the target genes or target proteins downstream of each miR according to GO and KEGG enrichment analysis results in the future experiments. As indicated in the previous literatures [33,34], the best approach to explore the way of these selected miRs impact on NAFLD of aged rats was cell transfection and luciferase reporter gene assays, which can confirm the targeted regulation relationship between miRs and their target genes in lipid metabolism in aged NAFLD rats. However, a single miR can regulate more than 100 target genes; conversely, the expression of a particular gene can be regulated positively or negatively by multiple miRs. So it is required to study and discuss the identified miRs one by one in the future experiments. Among the 10 identified DE-miRs, miR-223-3p demonstrated a higher upregulated expression level in the aged NAFLD group through both high-throughput sequencing methods and qPCR methods, but not highly upregulated in the young NAFLD group, suggesting the possibilities that miR-223-3p may be closely related to the occurrence and development of fatty change or hepatic insulin resistance in the aged. It was interesting to note that miR-223 was involved in the biological processes of cell growth, development and metabolism by targeting glucose transporter (GLUT) 4 [35]. miR-223 had also been demonstrated downregulating insulin-like growth factor-1 and the downstream phosphoinositide 3-kinases/Akt, and mammalian target of rapamycin signaling pathways [36]. These possibilities need to be explored in future experiments so as to explicit the molecular mechanism of miR-223-targeted insulin signaling pathways in hepatic insulin resistance in the aged.
In conclusion, the present study first identified DE-miRs in hepatic tissues of the aged rats with NAFLD, and thus expands the current understanding regarding the molecular etiology of aging-associated NAFLD. Considering that miR is being studied as an important serum biomarker in NAFLD progression, these identified differentially expressed miRs will be verified and explored in subsequent serological studies in human. Furthermore, the functional relevance of these DE-miRs and their potential mechanisms in regulating hepatic insulin resistance were also analyzed using a bioinformatics approach. Further studies are needed to be focused on the impact of these selected DE-miRs and their candidate targets on the aged NAFLD rats in more detail, in order to identify how to control lipid metabolism in NAFLD of the aged and provide the biological basis for prevention and early treatment for NAFLD in the aged population.AbbreviationsmiR microRNA nucleotide non-alcoholic fatty liver disease differentially expressed microRNA fasting blood glucose fasting insulin transcripts per million Gene Ontology Kyoto Encyclopedia of Genes and Genomes
This work was supported by the National Key Research and Development Program of China (grant number 2018YFC2002000); National Natural Science Foundation of China (grant number 81701374); Shanghai Excellent Young Medical Talents Training program (grant number 2018YQ58); Shanghai Municipal Science and Technology Committee Program (grant number YDZX20173100004026); Shanghai Municipal Commission of Health and Family Planning research program and Family Planning research program (grant number 201740216); Shanghai Medical Leadership Training Program (grant number 2019LJ09); and Shanghai Sailing program (grant number 17YF1405200).
Conflict of interestThe authors have no conflicts of interest to declare.
 and 3 aged control rats (D, E, F) respectively. The distribution of valid sequences in the two experimental groups had apparent similarities, that is, the mature miRs ranged principally from 21 to 24 nt in length (mostly 22 nt). X-coordinate denotes read lengths after clipping, Y-coordinate denotes number of reads. miRs, microRNAs; NAFLD, non-alcoholic fatty liver disease; nt, nucleotides.")
Sequence length distribution diagram of the liver samples of the aged group, which were randomly pooled from 3 aged NAFLD rats (A, B, C) and 3 aged control rats (D, E, F) respectively. The distribution of valid sequences in the two experimental groups had apparent similarities, that is, the mature miRs ranged principally from 21 to 24 nt in length (mostly 22 nt). X-coordinate denotes read lengths after clipping, Y-coordinate denotes number of reads. miRs, microRNAs; NAFLD, non-alcoholic fatty liver disease; nt, nucleotides.
Upregulated miRs.
| Gene ID | Fold change | P-value | FDR | Gene ID | Fold change | P-value | FDR |
|---|---|---|---|---|---|---|---|
| miR-98-3p | 1.230684 | 0.688396 | 1 | miR-223-3p | 2.267857 | 7.74×10⁻¹² | 1.36×10⁻¹² |
| miR-93-5p | 1.261026 | 0.001653 | 0.015953 | miR-221-3p | 1.484292 | 0.008318 | 0.071886 |
| miR-92a-1-5p | 1.241321 | 0.292275 | 1 | miR-21-5p | 1.120631 | 4.25×10−104 | 2.74×10−102 |
| miR-881-3p | 2.874598 | 7.10×10⁻⁷ | 9.34×10⁻⁶ | miR-21-3p | 1.198951 | 0.118136 | 0.705161 |
| miR-871-3p | 3.977559 | 1.05×10⁻¹² | 2.09×10⁻¹¹ | miR-204-5p | 1.159127 | 0.473252 | 1 |
| miR-743b-3p | 1.491166 | 2.66×10⁻⁶ | 3.42×10⁻⁵ | miR-203b-3p | 1.005348 | 0.930952 | 1 |
| miR-674-3p | 1.062051 | 0.742528 | 1 | miR-200b-3p | 1.437839 | 4.73×10⁻¹¹ | 8.06×10⁻¹⁰ |
| miR-671 | 1.165824 | 0.480729 | 1 | miR-200a-3p | 1.135863 | 0.454937 | 1 |
| miR-6329 | 1.15225 | 0.594615 | 1 | miR-19b-3p | 1.449333 | 1.44×10⁻⁸ | 2.14×10⁻⁶ |
| miR-582-3p | 1.641567 | 0.245183 | 1 | miR-19a-3p | 1.443749 | 0.152972 | 0.868344 |
| miR-542-3p | 1.293997 | 0.211163 | 1 | miR-199a-3p | 1.035143 | 0.518148 | 1 |
| miR-497-5p | 1.010333 | 0.811507 | 1 | miR-195-5p | 1.012771 | 0.651703 | 1 |
| miR-466c-5p | 1.020391 | 1 | 1 | miR-195-3p | 1.387836 | 0.163458 | 0.91002 |
| miR-450b-5p | 1.099582 | 0.454764 | 1 | miR-191b | 1.019895 | 0.837927 | 1 |
| miR-450a-5p | 1.213732 | 0.016527 | 0.134776 | miR-191a-5p | 1.167045 | 3.84×10−65 | 2.02×10−63 |
| miR-429 | 1.086396 | 0.638434 | 1 | miR-186-5p | 1.436299 | 1.11×10−54 | 5.35×10−53 |
| miR-425-5p | 1.214400 | 0.048836 | 0.349089 | miR-1843b-5p | 1.016608 | 1 | 1 |
| miR-425-3p | 1.167912 | 0.566186 | 1 | miR-184 | 1.492514 | 0.158657 | 0.891865 |
| miR-423-5p | 1.467510 | 1.03×10⁻⁹ | 1.65×10⁻⁸ | miR-1839-5p | 1.215046 | 0.29665 | 1 |
| miR-423-3p | 1.216513 | 0.005738 | 0.050341 | miR-181d-5p | 1.266952 | 0.509116 | 1 |
| miR-375-3p | 1.006099 | 0.714961 | 1 | miR-181c-5p | 1.006544 | 0.9037 | 1 |
| miR-365-3p | 1.148471 | 0.058222 | 0.401315 | miR-181b-5p | 1.692100 | 2.72×10⁻⁷ | 3.75×10⁻⁶ |
| miR-363-3p | 1.441075 | 0.200338 | 1 | miR-181a-5p | 1.731038 | 9.13×10−190 | 7.55×10−188 |
| miR-362-5p | 1.525023 | 0.356553 | 1 | miR-17-5p | 1.128717 | 0.388623 | 1 |
| miR-361-5p | 1.061213 | 0.495463 | 1 | miR-15b-5p | 1.276448 | 0.080247 | 0.510583 |
| miR-361-3p | 1.179414 | 0.393292 | 1 | miR-155-5p | 4.749237 | 2.89×10⁻¹⁴ | 6.68×10⁻¹³ |
| miR-3589 | 1.190087 | 0.389079 | 1 | miR-152-5p | 1.083824 | 0.7415 | 1 |
| miR-3586-3p | 1.273637 | 0.035279 | 0.268768 | miR-152-3p | 1.134749 | 0.071344 | 0.469414 |
| miR-3585-5p | 1.449256 | 0.307905 | 1 | miR-151-3p | 1.046254 | 0.034352 | 0.2652 |
| miR-3574 | 1.033192 | 0.841726 | 1 | miR-150-5p | 1.398956 | 0.000219 | 0.002392 |
| miR-3570 | 1.485842 | 0.099049 | 0.610097 | miR-148b-5p | 1.105382 | 0.72632 | 1 |
| miR-3560 | 1.164105 | 0.566186 | 1 | miR-148b-3p | 1.107297 | 0.002992 | 0.027939 |
| miR-3557-5p | 1.096255 | 2.10×10⁻²⁸ | 7.58×10⁻²⁷ | miR-148a-3p | 1.164109 | 4.62×10−98 | 2.67×10−96 |
| miR-351-5p | 1.448735 | 6.75×10⁻¹⁴ | 1.50×10⁻¹² | miR-147 | 1.715853 | 0.207499 | 1 |
| miR-342-3p | 1.275031 | 0.113545 | 0.684817 | miR-146b-5p | 3.767311 | 9.13×10−208 | 1.32×10−205 |
| miR-340-5p | 1.073086 | 0.403005 | 1 | miR-146a-5p | 1.790339 | 6.95×10−193 | 6.71×10−191 |
| miR-340-3p | 1.621818 | 0.066097 | 0.445 | miR-145-5p | 1.108945 | 0.113188 | 0.68985 |
| miR-335 | 2.072291 | 3.84×10⁻⁸ | 5.42×10⁻⁷ | miR-144-5p | 1.281066 | 0.470713 | 1 |
| miR-330-5p | 1.326267 | 0.455788 | 1 | miR-142-5p | 1.504442 | 9.16×10−36 | 3.79×10⁻³⁴ |
| miR-328a-3p | 1.025072 | 0.791762 | 1 | miR-142-3p | 1.538573 | 0.003403 | 0.030784 |
| miR-322-5p | 1.622113 | 1.99×10⁻¹⁷ | 5.77×10⁻¹⁶ | miR-140-5p | 1.171512 | 0.468567 | 1 |
| miR-322-3p | 1.147543 | 0.421038 | 1 | miR-140-3p | 1.054898 | 0.376974 | 1 |
| miR-320-3p | 1.062367 | 0.54846 | 1 | miR-130b-3p | 2.252224 | 0.073922 | 0.475564 |
| miR-30d-5p | 1.112735 | 5.47×10⁻³⁰ | 2.11×10⁻²⁸ | miR-128-3p | 1.273144 | 0.249252 | 1 |
| miR-30c-5p | 1.147895 | 1.85×10⁻¹² | 3.45×10⁻¹¹ | miR-127-3p | 1.821959 | 0.096912 | 0.603356 |
| miR-30c-2-3p | 1.04585 | 0.804673 | 1 | miR-125b-5p | 1.031797 | 0.019402 | 0.156021 |
| miR-30c-1-3p | 1.397398 | 0.212323 | 1 | miR-125a-5p | 1.159085 | 6.91×10⁻⁹ | 1.05×10⁻⁷ |
| miR-30b-3p | 1.034876 | 0.879775 | 1 | miR-1247-5p | 1.142019 | 0.020969 | 0.166315 |
| miR-3068-3p | 1.041984 | 0.879775 | 1 | miR-10b-5p | 1.008457 | 0.52421 | 1 |
| miR-301a-3p | 1.350638 | 0.035473 | 0.26674 | miR-10a-5p | 1.113068 | 8.04×10−242 | 1.55×10−239 |
| miR-29c-3p | 1.092374 | 0.186286 | 1 | miR-107-3p | 1.131039 | 0.046921 | 0.339591 |
| miR-28-3p | 1.222876 | 9.27×10⁻¹⁷ | 2.44×10⁻¹⁵ | miR-106b-3p | 1.184691 | 0.726915 | 1 |
| miR-27b-3p | 1.108844 | 7.93×10⁻²⁶ | 2.55×10⁻²⁴ | miR-103-3p | 1.04185 | 0.250292 | 1 |
| miR-26b-3p | 1.003730 | 1 | 1 | miR-100-5p | 1.045216 | 0.41352 | 1 |
| miR-26a-5p | 1.024912 | 2.45×10⁻¹³ | 5.07×10⁻¹² | let-7i-5p | 1.353470 | 2.31×10⁻¹⁷ | 6.36×10⁻¹⁶ |
| miR-24-2-5p | 1.112468 | 0.295538 | 1 | let-7g-5p | 1.039784 | 0.021242 | 0.166202 |
| miR-23b-3p | 1.021780 | 0.647588 | 1 | let-7f-5p | 1.127052 | 1.23×10⁻²⁶ | 4.19×10⁻²⁵ |
| miR-23a-3p | 1.113454 | 0.049816 | 0.351748 | let-7d-5p | 1.028778 | 0.398171 | 1 |
Fold change: The ratio of read counts in the NAFLD group to that in control group. FDR: false discovery rate.
After normalization, obtained average values for each miR spot were used for statistics. miR with expression fold change >2 and with FDR <0.05 was considered statistically significant.
Downregulated miRs.
| Gene ID | Fold change | P-value | FDR | Gene ID | Fold change | P-value | FDR |
|---|---|---|---|---|---|---|---|
| miR-99b-5p | 0.864760 | 1.10×10⁻⁹ | 1.72×10⁻⁸ | miR-29a-3p | 0.936600 | 0.0105074 | 0.0894671 |
| miR-99a-5p | 0.794642 | 1.59×10⁻¹⁵ | 3.83×10⁻¹⁴ | miR-28-5p | 0.935051 | 0.4503685 | 1 |
| miR-99a-3p | 0.844558 | 0.3235342 | 1 | miR-27b-5p | 0.997097 | 1 | 1 |
| miR-98-5p | 0.977069 | 0.952307 | 1 | miR-27a-3p | 0.956311 | 0.6095062 | 1 |
| miR-96-5p | 0.484338 | 0.003026 | 0.0278157 | miR-26b-5p | 0.936908 | 0.0004992 | 0.0051614 |
| miR-92b-3p | 0.987446 | 1 | 1 | miR-25-3p | 0.965137 | 0.6368837 | 1 |
| miR-92a-3p | 0.915308 | 0.000431 | 0.0045373 | miR-24-3p | 0.861155 | 0.0106549 | 0.0894088 |
| miR-872-5p | 0.922944 | 0.3846609 | 1 | miR-22-5p | 0.612054 | 0.035499 | 0.2635117 |
| miR-872-3p | 0.817050 | 0.4175552 | 1 | miR-22-3p | 0.982265 | 0.0729203 | 0.4743918 |
| miR-802-5p | 0.795949 | 5.24×10⁻⁶ | 6.59×10⁻⁵ | miR-218a-5p | 0.912793 | 1 | 1 |
| miR-802-3p | 0.70729 | 0.0000084 | 0.0001035 | miR-215 | 0.761129 | 0.5330007 | 1 |
| miR-7a-5p | 0.981729 | 1 | 1 | miR-214-3p | 0.932059 | 1 | 1 |
| miR-7a-1-3p | 0.767204 | 0.4998205 | 1 | miR-20a-5p | 0.955924 | 0.8372123 | 1 |
| miR-676 | 0.879956 | 0.3292199 | 1 | miR-203b-5p | 0.693754 | 0.005679 | 0.0505864 |
| miR-674-5p | 0.886986 | 1 | 1 | miR-203a-5p | 0.855204 | 0.4402852 | 1 |
| miR-664-3p | 0.904680 | 0.6516462 | 1 | miR-203a-3p | 0.812334 | 0.0001746 | 0.0019443 |
| miR-652-3p | 0.862146 | 0.5302493 | 1 | miR-199a-5p | 0.992698 | 0.9413998 | 1 |
| miR-532-5p | 0.924892 | 0.5903448 | 1 | miR-194-5p | 0.857873 | 3.99×10⁻¹⁶ | 1.01×10⁻¹⁴ |
| miR-532-3p | 0.886574 | 0.8388864 | 1 | miR-194-3p | 0.961379 | 0.9076785 | 1 |
| miR-511-3p | 0.761951 | 0.6901662 | 1 | miR-193a-3p | 0.485741 | 0.000155 | 0.001759 |
| miR-499-5p | 0.975272 | 1 | 1 | miR-192-5p | 0.760503 | 0 | 0 |
| miR-486 | 0.993033 | 0.8754077 | 1 | miR-192-3p | 0.863260 | 0.5167536 | 1 |
| miR-455-5p | 0.956251 | 1 | 1 | miR-190a-5p | 0.952791 | 1 | 1 |
| miR-455-3p | 0.888861 | 0.8747157 | 1 | miR-188-5p | 0.983395 | 1 | 1 |
| miR-451-5p | 0.561234 | 0.0004235 | 0.0045409 | miR-185-5p | 0.990302 | 1 | 1 |
| miR-378b | 0.972721 | 1 | 1 | miR-1843a-5p | 0.879726 | 0.4637074 | 1 |
| miR-378a-5p | 0.891257 | 0.5193521 | 1 | miR-183-5p | 0.441220 | 4.53×10⁻¹⁹ | 1.38×10⁻¹⁷ |
| miR-378a-3p | 0.790290 | 0.6179392 | 1 | miR-182 | 0.460273 | 1.60×10−205 | 1.86×10−203 |
| miR-374-5p | 0.969619 | 0.9286449 | 1 | miR-16-5p | 0.887731 | 5.72×10⁻¹¹ | 9.46×10⁻¹⁰ |
| miR-374-3p | 0.997573 | 1 | 1 | miR-15a-5p | 0.657888 | 0.0001161 | 0.0013718 |
| miR-3596d | 0.914204 | 0.7550294 | 1 | miR-151-5p | 0.954179 | 0.2989436 | 1 |
| miR-3591 | 0.694113 | 0.262858 | 1 | miR-148a-5p | 0.843009 | 0.0001178 | 0.0013646 |
| miR-3590-5p | 0.963292 | 0.6809113 | 1 | miR-145-3p | 0.843984 | 0.1426235 | 0.8257903 |
| miR-3577 | 0.738388 | 0.6637398 | 1 | miR-143-3p | 0.720454 | 0 | 0 |
| miR-3559-5p | 0.902577 | 0.5356624 | 1 | miR-141-3p | 0.698591 | 0.0403962 | 0.2960685 |
| miR-3559-3p | 0.896308 | 0.7553974 | 1 | miR-139-5p | 0.867019 | 0.4637074 | 1 |
| miR-3556b | 0.795859 | 0.0014244 | 0.0139782 | miR-135a-5p | 0.710011 | 0.6477152 | 1 |
| miR-3556a | 0.968204 | 0.7082915 | 1 | miR-126a-5p | 0.74114 | 4.29×10−119 | 3.10×10−117 |
| miR-34c-5p | 0.833476 | 0.4512204 | 1 | miR-126a-3p | 0.947902 | 0.0611461 | 0.4165131 |
| miR-34a-5p | 0.889775 | 0.1666213 | 0.9187973 | miR-125b-2-3p | 0.897326 | 0.2084641 | 1 |
| miR-345-5p | 0.555800 | 0.0536557 | 0.3742969 | miR-1249 | 0.919069 | 0.8939555 | 1 |
| miR-345-3p | 0.830030 | 0.7202448 | 1 | miR-1247-3p | 0.792811 | 0.8238637 | 1 |
| miR-339-5p | 0.815905 | 0.2355134 | 1 | miR-122-5p | 0.964713 | 0.0012034 | 0.0120137 |
| miR-339-3p | 0.862439 | 0.3888449 | 1 | miR-122-3p | 0.702651 | 5.85×10⁻⁷ | 7.88×10⁻⁶ |
| miR-338-3p | 0.779046 | 0.1436181 | 0.8233154 | miR-10a-3p | 0.933654 | 1 | 1 |
| miR-331-3p | 0.514694 | 0.1216673 | 0.7188305 | miR-106b-5p | 0.841216 | 0.5564896 | 1 |
| miR-33-3p | 0.37014 | 0.2102399 | 1 | miR-101b-3p | 0.749128 | 1.04×10−42 | 4.62×10−41 |
| miR-326-3p | 0.912660 | 1 | 1 | miR-101a-3p | 0.771402 | 1.76×10⁻¹³ | 3.77×10⁻¹² |
| miR-32-5p | 0.855168 | 0.8601272 | 1 | let-7f-2-3p | 0.744605 | 0.3413418 | 1 |
| miR-31a-5p | 0.432146 | 3.39×10⁻¹² | 6.14×10⁻¹¹ | let-7f-1-3p | 0.869890 | 0.6780827 | 1 |
| miR-31a-3p | 0.454225 | 0.0127405 | 0.1053822 | let-7e-5p | 0.911747 | 0.5028902 | 1 |
| miR-30e-5p | 0.984367 | 0.782705 | 1 | let-7d-3p | 0.901745 | 0.2195292 | 1 |
| miR-30e-3p | 0.974931 | 0.822816 | 1 | let-7c-5p | 0.837631 | 1.63×10⁻¹² | 3.15×10⁻¹¹ |
| miR-30d-3p | 0.900329 | 0.5060937 | 1 | let-7c-2-3p | 0.939931 | 0.7533534 | 1 |
| miR-30b-5p | 0.820991 | 3.03×10⁻⁸ | 4.39×10⁻⁷ | let-7b-5p | 0.856712 | 0.002738 | 0.0259889 |
| miR-30a-5p | 0.954476 | 1.42×10⁻⁵ | 0.000171 | let-7b-3p | 0.876047 | 0.5434269 | 1 |
| miR-30a-3p | 0.887117 | 0.0922375 | 0.5804944 | let-7a-5p | 0.926853 | 0.0008312 | 0.0084432 |
| miR-29b-3p | 0.837602 | 0.3431304 | 1 | let-7a-1-3p | 0.946219 | 0.8142643 | 1 |
Fold change: The ratio of read counts in NAFLD group to that in control group. FDR: false discovery rate.
After normalization, obtained average values for each miR spot were used for statistics. miR with expression fold change <0.5 and with FDR <0.05 was considered statistically significant.


