This study aimed to confirm the association of the transmembrane 6 superfamily member 2 (TM6SF2) E167K variant with non-alcoholic fatty liver disease (NAFLD) and the degree of steatosis, as well as the additive effect of body mass index (BMI) or the patatin-like phospholipase domain-containing protein 3 (PNPLA3) I148M and TM6SF2 E167K variants in NAFLD.
Materials and methodsA total of 158 NAFLD patients and 158 matched controls were recruited. Steatosis was classified as mild, moderate and severe by FibroScan. Associations between the TM6SF2 E167K variant and NAFLD as well as clinical parameters were evaluated.
ResultsAlthough the frequency of the T allele was low in the Chinese population (MAF=7.4%), there was still a significant association between the E167K variant and NAFLD (odds ratio=3.379, 95% confidence interval: 1.500–7.612, P=0.003). In particular, the TM6SF2 genotype was also associated with the degree of steatosis (P=0.023). The TM6SF2 variant was associated with increased alanine aminotransferase (ALT) but no other clinical parameters, such as aspartate aminotransferase (AST), alkaline phosphatase (ALP) and lipids. Notably, we also found that an additive effect of the TM6SF2 E167K and PNPLA3 I148M variants in NAFLD. Furthermore, we did not identify an association between the TM6SF2 E167K variant and NAFLD in the non-obese population.
ConclusionThe TM6SF2 E167K variant was associated with NAFLD in northeast China, and there was an interaction between the PNPLA3 I148M and TMS6F2 E167K variants in NAFLD.
Non-alcoholic fatty liver disease (NAFLD) comprises a spectrum of diseases ranging from simple steatosis and non-alcoholic steatohepatitis to progressive hepatic fibrosis, cirrhosis and eventually hepatocellular carcinoma without excessive alcohol consumption [1]. Along with the increasing prevalence of obesity and lifestyle changes, NAFLD has recently become the most common chronic liver disease in developed Western countries and affects 20–34% of individuals [2]. NAFLD also affects 25% of the population in Japan [3] and 15% of the population in China [4]. Although the morbidity rate of NAFLD is relatively low in Asian populations, it is worth noting that due to lifestyle, the prevalence of NAFLD has increased dramatically in the last two decades [5].
Similar to other complex diseases, the pathogenesis of NAFLD is affected by multiple factors, such as obesity, dyslipidaemia, insulin resistance, type 2 diabetes mellitus (T2DM), gut microbiota, genetic background and epigenetic factors [6], but the underlying mechanism remains unclear.
A genome-wide association study in 2008 identified a variant (rs738409) of PNPLA3 that is strongly associated with the fat content of the liver [7]. Our subsequent study confirmed that the variant is also associated with steatosis severity [8]. Recently, scholars discovered that the Glu167Lys TM6SF2 variant breaks the normal function of TM6SF2 and is associated with increased liver fat content [9]. TM6SF2 is highly expressed in the liver and small intestine, and in the rs5852926 variant, cytosine is substituted by thymine in coding nucleotide 499, which results in glutamate being replaced by lysine at residue 167 [9]. Subsequent studies have confirmed that the variant is associated with NAFLD in both adults [10] and children [11], and the association has been confirmed in different ethnic groups [9,12,13]. Indeed, the association has been proven by meta-analysis [14]. However, there are a limited number of studies based on Chinese populations, and the results are inconsistent [13,15]. Furthermore, a study based on a Japanese population found that the TM6SF2 variant was not associated with biopsy-proven histological features [16]. Our study aimed to confirm the association between the TM6SF2 E167K variant and NAFLD in northeast China and investigate whether TM6SF2 variant is associated with the degree of steatosis. In addition, given that the PNPLA3 I148M variant and body mass index (BMI) have been shown to be associated with NAFLD, we attempted to determine whether there is an interaction between them in NAFLD in a Chinese population.
2Materials and methods2.1SubjectsOur study included 158 patients with NAFLD diagnosed by FibroScan recruited from an outpatient liver clinic at the First Affiliated Hospital of China Medical University in Shenyang, China, between October 2014 and December 2015. During and after data collection, we still had access to information identifying individual participants. The patients were confirmed to have hepatic steatosis via liver FibroScan with a controlled attenuation parameter (CAP)≥238, which was classified into three categories: mild, moderate, and severe for CAP≥238, CAP≥259, and CAP≥292, respectively, as reported by Sasso et al. [17]. All examinations were performed by one experienced radiologist, who was unaware of the patients’ clinical details and laboratory findings. The exclusion criteria included ethanol intake >140g/week for male, 70g/week for female, receiving total parenteral nutrition, hepatitis B and hepatitis C virus positivity, presence of liver disease (such as Wilson's disease, hemochromatosis, alpha1-antitrypsin deficiency, autoimmune liver disease, drug-induced liver injury), use of hepatotoxic drugs, use of drugs that promote steatosis, and use of hepatotoxic drugs. In addition, 158 ethnic-matched controls without NAFLD by FibroScan were recruited from primary care outpatient clinics at the same institution. All participants were of Han ethnicity. Written informed consent was obtained using a protocol approved by the ethics committee ([2012]81) of the First Affiliated Hospital of China Medical University.
2.2Clinical parametersAge and sex were self-reported. BMI was calculated according to the measured height and weight at the time of recruitment. Obesity was defined as BMI≥25.0kg/m2[18]. Venous blood samples were obtained from the subjects after an overnight fast (12h). The alanine aminotransferase (ALT), aspartate aminotransferase (AST), gamma-glutamyl transpeptidase (GGT), alkaline phosphatase (ALP), total cholesterol (TC), high-density lipoprotein cholesterol (HDL-C), low-density lipoprotein cholesterol (LDL-C), triglyceride (TG), and fasting blood glucose (FBG) levels were measured using an automated analyser.
2.3GenotypingDNA was extracted from EDTA-anticoagulated blood samples using a DNA extraction protocol (Tiangen DP329). Genotyping of PNPLA3 rs738409 and TM6SF2 rs58542926 polymorphisms was then performed using PCR-based assays with an AB 7900 Fast Real-Time PCR instrument (TaqMan SNP Genotyping Assays, Assay ID: C_7241_10 for PNPLA3 rs738409, C_89463510_10 for TM6SF2 rs58542926).
2.4Statistical analysisContinuous variables with a normal distribution are presented as the mean±standard error; otherwise, the data are described by the median (interquartile range). Categorical data are described by numbers. The PNPLA3 genotypic value was coded in an additive manner, i.e., 0, 1 and 2 denote the II, IM and MM genotypes, respectively, whereas the TM6SF2 genotypic value was coded as a dominant genetic model, i.e., 0 denotes the CC genotype, and 1 denotes the CT and TT genotypes. The Hardy–Weinberg equilibrium (HWE) of the genotype distribution was examined using the chi-square test, with P>0.05 indicating HWE. An independent t test or ANOVA was used to compare continuous data. The associations between genotype and continuous variables were tested using linear regression models. The chi-square test was used to compare categorical variables. The associations between genotype and categorical variables were tested using logistic regression models. P<0.05 was considered to indicate a significant difference. All statistical analyses were performed using SPSS 20.0 (IBM).
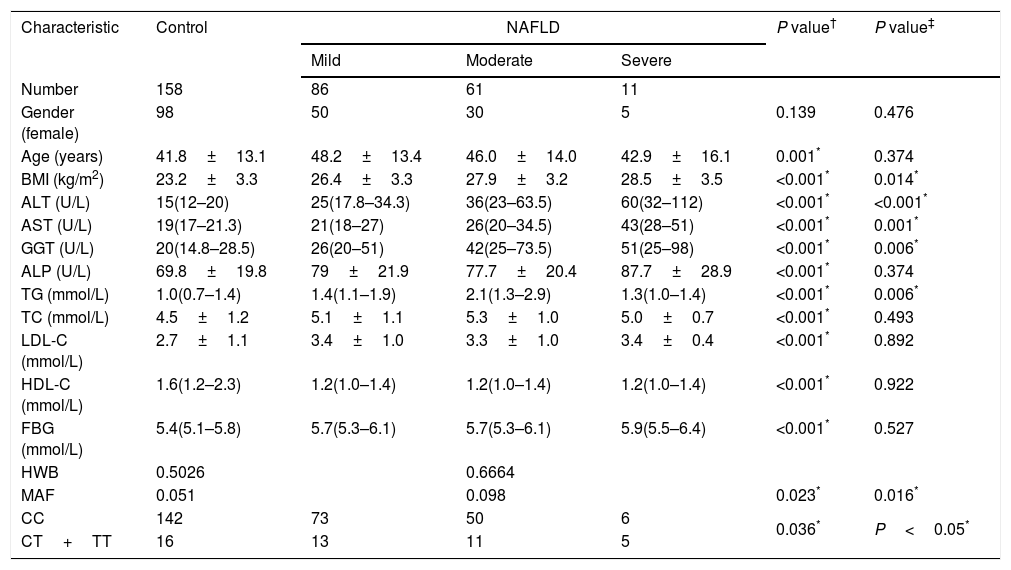
3ResultsDetails about the physical and clinical characteristics of the patients and controls are shown in Table 1.
Demographic and clinical data of the subjects.
| Characteristic | Control | NAFLD | P value† | P value‡ | ||
|---|---|---|---|---|---|---|
| Mild | Moderate | Severe | ||||
| Number | 158 | 86 | 61 | 11 | ||
| Gender (female) | 98 | 50 | 30 | 5 | 0.139 | 0.476 |
| Age (years) | 41.8±13.1 | 48.2±13.4 | 46.0±14.0 | 42.9±16.1 | 0.001* | 0.374 |
| BMI (kg/m2) | 23.2±3.3 | 26.4±3.3 | 27.9±3.2 | 28.5±3.5 | <0.001* | 0.014* |
| ALT (U/L) | 15(12–20) | 25(17.8–34.3) | 36(23–63.5) | 60(32–112) | <0.001* | <0.001* |
| AST (U/L) | 19(17–21.3) | 21(18–27) | 26(20–34.5) | 43(28–51) | <0.001* | 0.001* |
| GGT (U/L) | 20(14.8–28.5) | 26(20–51) | 42(25–73.5) | 51(25–98) | <0.001* | 0.006* |
| ALP (U/L) | 69.8±19.8 | 79±21.9 | 77.7±20.4 | 87.7±28.9 | <0.001* | 0.374 |
| TG (mmol/L) | 1.0(0.7–1.4) | 1.4(1.1–1.9) | 2.1(1.3–2.9) | 1.3(1.0–1.4) | <0.001* | 0.006* |
| TC (mmol/L) | 4.5±1.2 | 5.1±1.1 | 5.3±1.0 | 5.0±0.7 | <0.001* | 0.493 |
| LDL-C (mmol/L) | 2.7±1.1 | 3.4±1.0 | 3.3±1.0 | 3.4±0.4 | <0.001* | 0.892 |
| HDL-C (mmol/L) | 1.6(1.2–2.3) | 1.2(1.0–1.4) | 1.2(1.0–1.4) | 1.2(1.0–1.4) | <0.001* | 0.922 |
| FBG (mmol/L) | 5.4(5.1–5.8) | 5.7(5.3–6.1) | 5.7(5.3–6.1) | 5.9(5.5–6.4) | <0.001* | 0.527 |
| HWB | 0.5026 | 0.6664 | ||||
| MAF | 0.051 | 0.098 | 0.023* | 0.016* | ||
| CC | 142 | 73 | 50 | 6 | 0.036* | P<0.05* |
| CT+TT | 16 | 13 | 11 | 5 | ||
BMI, body mass index; ALT, alanine aminotransferase; AST, aspartate aminotransferase; GGT, gamma-glutamyl transpeptidase; ALP, alkaline phosphatase; TG, triglycerides; TC, total cholesterol; LDL-C, low-density lipoprotein cholesterol; HDL-C, high-density lipoprotein cholesterol; FBG, fasting blood glucose; CC, subjects with CC genotype; CT, subjects with CT genotype; TT, subjects with TT genotype; MAF, minor allele frequency; HWB, Hardy–Weinberg equilibrium.
P value†: comparison between control group and NAFLD group.
P value‡: comparison of subjects with mild, moderate and severe steatosis.
P value† were calculated using independent t test or Mann–Whitney for continuous variables or chi-square test for categorical variables.
P value‡ were calculated using Kruskal–Wallis H test for continuous variables or chi-square test for categorical variables.
The TM6SF2 rs58542926 genotype was found to be in HWE for both groups (Table 1, P=0.5026 for the control group and P=0.6664 for the NAFLD group). The frequency of the Glu167Lys TM6SF2 variant was relatively low in the control group (Table 1, MAF=5.1%), and the frequency of the Glu167Lys TM6SF2 variant was significantly higher in the NAFLD group than in the control group (Table 1, P=0.023). The frequency of the Glu167Lys TM6SF2 variant was associated with the degree of steatosis, with T allele frequencies of 8.1%, 9.0%, and 27.3% in mild, moderate, and severe cases, respectively (Table 1, P=0.016).
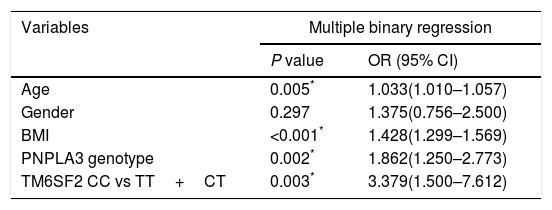
3.1Association of TMS6F2 rs58542926 variant with NAFLD and degree of steatosisDiscrete trait analysis showed that TM6SF2 rs58542926 was associated with NAFLD in a dominant model (Table 1, P=0.036). A multivariate binary regression analysis showed that TM6SF2 rs58542926 was still associated with NAFLD after adjusting for potential confounding factors (Table 2, odds ratio [OR]=3.379, 95% confidence interval [CI]: 1.500–7.612, P=0.003). Indeed, NAFLD was also associated with age (Table 2, OR=1.033, 95% CI: 1.010–1.057, P=0.005), BMI (Table 2, OR=1.428, 95% CI: 1.299–1.569, P<0.001) and PNPLA3 genotype (Table 2, OR=1.862, 95% CI: 1.250–2.773, P=0.002).
Factors associated with NAFLD.
| Variables | Multiple binary regression | |
|---|---|---|
| P value | OR (95% CI) | |
| Age | 0.005* | 1.033(1.010–1.057) |
| Gender | 0.297 | 1.375(0.756–2.500) |
| BMI | <0.001* | 1.428(1.299–1.569) |
| PNPLA3 genotype | 0.002* | 1.862(1.250–2.773) |
| TM6SF2 CC vs TT+CT | 0.003* | 3.379(1.500–7.612) |
BMI, body mass index; CC, subjects with CC genotype; CT, subjects with CT genotype; TT, subjects with TT genotype; PNPLA3, patatin-like phospholipase domain-containing protein 3; OR: odds ratio, CI: confidence interval.
P value was calculated using binary logistic regression model after adjusting for age, gender, BMI and PNPLA3 genotype.
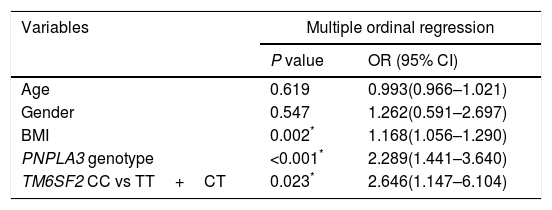
Table 1 shows that the TM6SF2 genotype was associated with the severity of steatosis in the dominant model (Table 1, P<0.05). In addition, the association remained after adjusting for potential confounding factors, such as age, sex, BMI and PNPLA3 genotype (Table 3, P=0.023).
Factors associated with steatosis grade.
| Variables | Multiple ordinal regression | |
|---|---|---|
| P value | OR (95% CI) | |
| Age | 0.619 | 0.993(0.966–1.021) |
| Gender | 0.547 | 1.262(0.591–2.697) |
| BMI | 0.002* | 1.168(1.056–1.290) |
| PNPLA3 genotype | <0.001* | 2.289(1.441–3.640) |
| TM6SF2 CC vs TT+CT | 0.023* | 2.646(1.147–6.104) |
BMI, body mass index; CC, subjects with CC genotype; CT, subjects with CT genotype; TT, subjects with TT genotype.
P value was calculated using ordinal logistic regression model after adjusting for age, gender, BMI and PNPLA3 genotype.
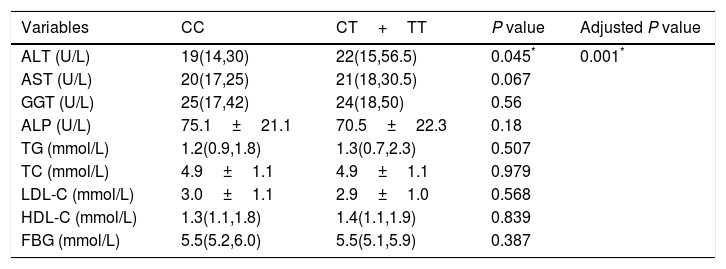
The associations between the TM6SF2 E167K variant and the hepatic enzyme, lipid, and FBG levels are shown in Table 4. In summary, the E167K variant was associated with an increased ALT level (P=0.045); however, we did not find an association between the TM6SF2 E167K variant and other hepatic enzymes, lipids or FBG. The association was still significant after adjusting for age, sex, BMI, and PNPLA3 genotype (Table 4, adjusted P=0.001).
Effect of T allele on liver function and lipids.
| Variables | CC | CT+TT | P value | Adjusted P value |
|---|---|---|---|---|
| ALT (U/L) | 19(14,30) | 22(15,56.5) | 0.045* | 0.001* |
| AST (U/L) | 20(17,25) | 21(18,30.5) | 0.067 | |
| GGT (U/L) | 25(17,42) | 24(18,50) | 0.56 | |
| ALP (U/L) | 75.1±21.1 | 70.5±22.3 | 0.18 | |
| TG (mmol/L) | 1.2(0.9,1.8) | 1.3(0.7,2.3) | 0.507 | |
| TC (mmol/L) | 4.9±1.1 | 4.9±1.1 | 0.979 | |
| LDL-C (mmol/L) | 3.0±1.1 | 2.9±1.0 | 0.568 | |
| HDL-C (mmol/L) | 1.3(1.1,1.8) | 1.4(1.1,1.9) | 0.839 | |
| FBG (mmol/L) | 5.5(5.2,6.0) | 5.5(5.1,5.9) | 0.387 |
ALT, alanine aminotransferase; AST, aspartate aminotransferase; GGT, gamma-glutamyl transpeptidase; ALP, alkaline phosphatase; TG, triglycerides; TC, total cholesterol; LDL-C, low-density lipoprotein cholesterol; HDL-C, high-density lipoprotein cholesterol; FBG, fasting blood glucose.
P value was calculated using independent t test or Mann–Whitney.
Adjusted P value was calculated using lineal regression model after adjusting for age, gender, BMI and PNPLA3 genotype.
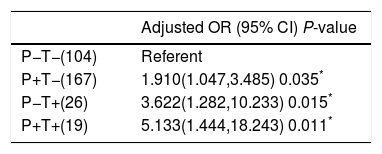
As PNPLA3 I148M variant was associated with NAFLD, we tried to investigate whether there was an interaction between the PNPLA3 I148M and TM6SF2 E167K variants in NAFLD. In the model, we set the group without either variant as the reference group. We found that compared to the reference group, all other groups were associated with NAFLD. In addition, the group with only the TM6SF2 E167K variant had a higher OR than the group with the PNPLA3 I148M variant. In particular, the group with both variants had the highest OR of 5.133 after adjusting for potential confounding factors (Table 5).
Additive effect of PNPLA3 I148M variant and TM6SF2 E167K variant on NAFLD.
| Adjusted OR (95% CI) P-value | |
|---|---|
| P−T−(104) | Referent |
| P+T−(167) | 1.910(1.047,3.485) 0.035* |
| P−T+(26) | 3.622(1.282,10.233) 0.015* |
| P+T+(19) | 5.133(1.444,18.243) 0.011* |
T+: TM6SF2 risk allele carrier; T−: subjects without TM6SF2 risk allele; P+: PNPLA3 risk allele carrier; P−: subjects without PNPLA3 risk allele; OR: odds ratio; CI: confidence interval.
P value was calculated using binary logistic regression after adjusting for age, gender and BMI; subjects without neither of variants were considered to be the reference group.
In a binary logistic regression model, we found that BMI was also a risk factor for NAFLD. To investigate whether there was an interaction between BMI and the TM6SF2 E167K variant in NAFLD, the group without obesity or the T risk allele was set as the reference group. As shown in Table 6, except for the non-obese group with the T allele, all of the other groups were associated with NAFLD, and the obese group with the T allele had the highest OR for NAFLD (OR=59.19, P<0.001).
Additive effect of obesity and TM6SF2 E167K variant on NAFLD.
| Adjusted OR (95% CI) P-value | |
|---|---|
| B−T−(137) | Referent |
| B−T+(23) | 1.237(0.310,4.946) 0.763 |
| B+T−(134) | 7.535(4.090,13.882) <0.001* |
| B+T+(22) | 59.190(12.646,277.053) <0.001* |
B+: subjects with obesity; B−: subjects with non-obesity; T+: TM6SF2 risk allele carrier; T−: subjects without TM6SF2 risk allele; OR: odds ratio, CI: confidence interval.
P value was calculated using binary logistic regression after adjusting for age, gender and PNPLA3 genotype. Subjects without neither variant or obesity were considered to be the reference group.
The TM6SF2 E167K variant has been reported to be associated with NAFLD as well as increased liver enzymes and decreased serum lipids in different ethnic groups [9,12,13]. We found that although the frequency of the TM6SF2 E167K variant was low, the TM6SF2 genotype was associated with the prevalence of NAFLD and the degree of steatosis in northeast China. Notably, we also discovered that there was an additive effect of the PNPLA3 I148M and TM6SF2 E167K variants in NAFLD. In addition, when performing subgroup analysis based on obesity, we did not find an association between the TM6SF2 E167K variant and NAFLD in the non-obese group.
The association between the TM6SF2 E167K variant and NAFLD has been proven in multiple ethnic groups [9,12,13], but studies based on Chinese populations are rare, with different results [13,15]. The results of our study were similar to those of Wang's study, indicating that despite a low risk allele frequency in the population of northeast China, a significant association exists between the TM6SF2 genotype and NAFLD. The association between the TM6SF2 E167K variant and NAFLD may be attributed to the following two reasons: (1) TM6SF2 is associated with very-low-density lipoprotein (VLDL) secretion, whereas with the TM6SF2 E167K variant decreases VLDL secretion and results in a higher liver fat content [9]. A subsequent study showed that TM6SF2 is mainly involved in mobilizing neutral lipids in VLDL assembly [19]. (2) TM6SF2 is involved in cholesterol synthesis [20] through the EXPERA domain of the TM6SF2 protein [21].
The association between the TM6SF2 E167K variant and steatosis severity has been proven in other ethnic groups [22] but not in Chinese populations. In this study, we found that the TM6SF2 E167K variant was associated with steatosis grade independent from potential confounding factors, and these findings are in line with those reported by Silvia Sookoian et al. [22]. They found that the E167K variant was associated with biopsy-proven steatosis severity after adjusting for age, sex, BMI and the PNPLA3 rs738409 genotype, indicating that the TM6SF2 E167K variant may be associated with the progression of NAFLD because the degree of steatosis is positively correlated with steatohepatitis [23].
The TM6SF2 E167K variant is associated with increased liver enzyme and decreased lipid levels [9]. Accordingly, we found that the TMS6F2 E167K variant was associated with an increased ALT level compared with other clinical indexes. ALT is considered a sensitive marker of liver injury, which suggests that this variant is associated with liver injury. The reason why the TMS6F2 E167K variant is associated with liver injury may be that the T allele is associated with the postprandial redistribution of lipoprotein cholesterol [24], which is associated with a higher level of cytokeratin (CK)-18, a marker of liver injury, after a meal [25]. Previous studies have shown that the T allele is associated with lower serum lipid levels [9,14,26]; however, we did not find an association between the TMS6F2 E167K variant and lipid levels, which may be due to selective bias and differences among races. Therefore, further large-sample studies are needed to confirm these results.
Given that the PNPLA3 I148M variant is a strong modulating genetic factor of NAFLD and accounts for approximately 5% of NAFLD cases [27], we attempted to identify whether there is a combined effect of the variants. In line with the results reported by Wang [28], we found an additive effect for the two variants with regard to the prevalence of NAFLD, which may be explained by a Bayesian analysis [29], i.e., two genes may interact each other via DNMT3L and FASN. Notably, the modulatory effect of the PNPLA3 I148M variant on NAFLD was found to be lower than that of the TM6SF2 E167K variant in our study, which differs from the results of previous meta-analyses [14]. Carlos J. Pirola confirmed that compared with the PNPLA3 I148M variant, the TM6SF2 E167K variant had only a moderate effect on NAFLD, which may be caused by selective bias and the small sample size.
Notably, in the non-obese population, we did not find an association between the TM6SF2 E167K variant and NAFLD. Considering that subjects with both the PNPLA3 and TM6SF2 risk alleles benefit from diet restriction and physical exercises for improving steatosis [30], subjects with the PNPLA3 risk allele may benefit even more [31]. This result emphasizes that subjects with the T risk allele may also benefit from weight loss; thus, it is necessary to recommend adoption of lifestyle interventions to those with the risk allele as early as possible. However, because the size of our study sample was small, more large-sample studies are needed to confirm the result.
Although biopsy is considered the gold standard for diagnosing steatosis, it is an invasive examination and difficult for Chinese patients to accept. In this study, we used FibroScan to evaluate liver fat content, which is a more inexpensive approach than 1H-MRS and is more noninvasive than CT. Compared with traditional US, FibroScan has a higher sensitivity and accuracy [17]. Moreover, the results are independent of the operator via quantitative evaluation of liver fat content. The small sample size is another limitation of our study.
We are the first to report the association of the TM6SF2 E167K variant with steatosis severity in a Chinese population. In addition, we confirmed the interaction of the PNPLA3 I148M and TM6SF2 E167K variants in the prevalence of NAFLD. However, more large-sized studies are still needed to investigate these results in Chinese populations.
AbbreviationsNAFLD non-alcoholic fatty liver disease patatin-like phospholipase domain-containing protein 3 transmembrane 6 superfamily member 2 alanine aminotransferase aspartate aminotransferase alkaline phosphatase gamma-glutamyl transpeptidase total cholesterol high-density lipoprotein cholesterol low-density lipoprotein cholesterol triglycerides fasting blood glucose Hardy-Weinberg equilibrium
YL carried out clinical studies; MX, SZ, XW, JS and SZ carried out data collection and data analysis; MX and XY were in charge of manuscript writing.
Conflict of interestThe authors declare that they have no competing interests.
We thank the numerous individuals for participating in this study.
This work was supported by the National Natural Science Foundation of China (No. 81570519).


