


Background. The information available on time and dose effects of the exposure of hepatocytes to free fatty acids (FFA) in vitro is controversial, and very few studies have assessed the hepatocyte inflammatory response in an in vitro model.
Aim. To analyze the effect of treatment with FFA on cell viability and on the kinetics of cytokine expression using hepatic cell lines.
Material and methods. Hepatic cell lines, IHH and HuH7, were cultured for 3 h, 6 h, 12 h and 24 h in an enriched medium with palmitic and oleic acids. The cytotoxicity of the FFA was assessed by the MTT test and the intracellular fat content determined cytofluorimetrically and by fluorescence microscopy using Nile Red staining. The expression of mRNA for interleukin (IL)-6, IL-8 and tumor necrosis factor (TNF)-α was assessed by real time reverse transcription-polymerase chain reaction (RT-PCR).
Results. Treatment with 600 μM FFA did not affect the viability of either cell line despite a significant increase in the intracellular content of lipid droplets already evident after 3 h of treatment. A time- and dose-dependent upregulation of the expression of IL-6 and IL-8 mRNA was observed during the treatment at 3 and 24 h. In contrast, TNF-α mRNA expression was highly upregulated at 3 h after FFA exposure but returned to control values at 24 h. In conclusion, hepatocytes exposed in vitro for a short time to low FFA concentrations showed a significant upregulation of IL-6 and IL-8 to, and a rapid but transitory elevation of TNF-α.
There is a high prevalence of NAFLD, particularly in the Latino population.1–6 In Mexico, this disease is estimated to be the most prevalent cause of cirrhosis in women and the second leading cause in men, and it is expected that about one million people will have fatty liver cirrhosis in 2050.7 The prevalence of liver steatosis in a population-based study with ultrasound was 23%.8
The cornerstone of nonalcoholic fatty liver disease (NAFLD) is insulin resistance. There are clear clinical and in vivo data highlighting the roles of fat accumulation and inflammation as promoters of liver fibrosis in NAFLD. The addition of several phenotypic characteristics of insulin resistance increases the risk of adverse outcomes including type 2 diabetes mellitus.9 This additive damage is not only observed for insulin resistance: other pathophysiological events including oxidative stress, altered immune response, and lipotoxicity have important roles in the development and progression of NAFLD.10
There is substantial complexity in the pathways involved in NAFLD and there is an even more complex network of organs and tissues involved in fat accumulation. In addition to being the source of portal fatty acids,11 the adipose tissue plays an important role as an endocrine organ by producing several inflammatory cytokines12–14 and other specific cytokines (adipokines)15 that regulate many liver metabolic pathways.
Lipotoxicity is a well-described effect secondary to toxicity of fatty acids in many tissues.16 In the case of NAFLD, lipotoxicity is also an important player in the pathophysiologic pathway.17 Liver lipotoxicity is mediated by a complex signaling network triggered by free fatty acids (FFA). Adipocytes deliver FFA to the liver, causing an increased flux to the portal vein and finally an accumulation in the hepatocytes via multiple mechanisms. The FFA sources are:
- •
Dietary fatty acids (mainly through the uptake of intestine-derived chylomicron remnants).
- •
Increased lipolysis of peripheral fat stored in white adipose tissue that flows to the liver as plasma nonesterified fatty acids; and
- •
Fatty acids newly made within the liver through de novo lipogenesis. In all cases, the liver receives them directly via the portal flow.18
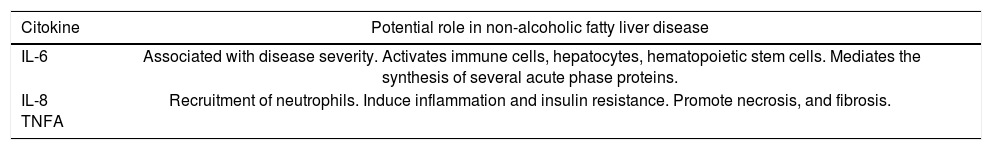
FFA cytotoxicity occurs via caspase-dependent apoptosis, and JNK triggers the mitochondrial pathway of apoptosis through Bim-dependent Bax activation.19 In addition, in vitro evidence suggests that by treating cultured hepatocytes with unsaturated FFA it is possible to mimic the two-hit theory of nonalcoholic steatohepatitis (NASH), in which the “first hit” involves lipid accumulation in the hepatocytes, increasing vulnerability to the “second hit” mediated by oxidative stress and subsequent lipid peroxidation, proinflammatory cytokines, adipokines, and mitochondrial dysfunction. The FFA sensitize hepatocytes to apoptosis induced by very low micromolar concentrations of glycochenodeoxycholic acid. Glycochenodeoxycholic acid induces significant apoptosis in fat-rich hepatocytes at concentrations not toxic in nonsteatotic cells, and induces significant transcription of the proinflammatory cytokines Interleukin (IL)-8 and IL-22 only in steatotic cells.20,21 However few information is available regarding the role of classic cytokines involved in NASH, as interleukin(IL)-6, IL-8 and tumor necrosis factor alpha (TNFα) (Table 1).22
Importance of IL-6, IL-8 and tumor necrosis factor alpha in non-alcoholic fatty liver disease.
| Citokine | Potential role in non-alcoholic fatty liver disease |
|---|---|
| IL-6 | Associated with disease severity. Activates immune cells, hepatocytes, hematopoietic stem cells. Mediates the synthesis of several acute phase proteins. |
| IL-8 TNFA | Recruitment of neutrophils. Induce inflammation and insulin resistance. Promote necrosis, and fibrosis. |
Modified from Braunersreuther, et al.22
Although the lipotoxicity induced by FFA has been described, the timing of the complex response to this damage remains unclear. The aim of this study is analyze the effect of treatment with FFA on cell viability and on the kinetics of cytokine expression using the novel in vitro model of NAFLD/ NASH we described previously.23
Material and MethodsChemicalsCell culture medium (Dulbecco’s modified Eagle’s high glucose medium (DMEM) (ECB7501L), L-glutamine (ECB3000D), and penicillin/streptomycin (ECB3001D) were obtained from EuroClone (Milan, Italy). DMEM/F12 media (11039021) was purchased from Invitrogen (Monza, Italy). Bicinchoninic acid solution kit (B9643), bovine albumin Cohn V fraction (A4503), bovine pancreas insulin (I1882), dexamethasone (D4902), dimethyl sulfoxide (DMSO) (D2438), fetal bovine serum (FBS) (F7524), Hoechst 33258 (B1155), oleic acid (C18:1) (O1008), palmitic acid (C16:0) (P0500), paraformaldehyde (P6148), phosphate-buffered saline (PBS) (D5652), propidium iodide (PI)(P4170), and TriReagent (T9424) were purchased from Sigma Chemicals (St. Louis, MO, USA). iScriptTM cDNA Synthesis kit (170-8890) and iQ SYBR Green Supermix (170-8860) were purchased from Bio-Rad Laboratories (Hercules, CA, USA).
Cell culture and FFA treatmentHepatoma-derived cell line HuH7 (JHSRRB, Cat #JCRB0403) was obtained from the Health Science Research Resources Bank (Osaka, Japan). Cells were grown in DMEM high glucose medium supplemented with 10% v/v FBS, 2mM L-glutamine, 10,000 U/mL penicillin, and 10 mg/mL streptomycin at 37 °C under 5% CO2, in a 95% humidified atmosphere. Immortalized human hepatocytes (IHH) were kindly provided by Dr. Trono.24 IHH cell culture was performed under the standard conditions described previously25 using DMEM/F12 1 x containing 15 mM Hepes buffer, L-glutamine and pyridoxine HCL, without phenol red, 1 x 10⁻⁶ M dexamethasone, 5 μg/mL bovine pancreas insulin, antibiotics (10,000 U/mL penicillin and 10 mg/mL streptomycin), and 10% (v/v) FBS.
For FFA treatment, palmitic and oleic acid 0.1 M stock solutions were prepared by dissolving FFA in DMSO. The cells were exposed for 24 h to increasing concentrations of a fresh mixture of exogenous FFA (200 μM, 400 μM, 600 μM and 1,200 μM) in a molar ratio of 1:2 palmitic:oleic acid. In these experiments a 24 h time course (sampling at 3 h, 6 h, 12 h and 24 h) was performed.
As FFA are highly insoluble in the aqueous phase, the major portion of FFA in the blood is carried in association with albumin. A small part of the total FFA within the blood, however, dissociates from the albumin. Consequently, serum levels of FFA are determined, or regulated, by the ratio of total serum FFA to total serum albumin. In the present study, the FFA were complexed with bovine serum albumin at a 4:1 molar ratio taking into consideration the albumin concentration already present in the medium because of the FBS supplementation. The experimental doses were determined in advance by performing dose curves and by assessing cell viability, which was always higher than 85% of that of control cells (100% viability) treated with the equivalent concentration v/v of the vehicle (DMSO).
3-(4,5-dimethylthiazol-2-yl)-2,5-diphenyltetrazolium bromide (MTT) assayCell viability was assessed using the MTT colorimetric assay. When taken up by living cells, MTT is converted from yellow to a water-insoluble blue-colored precipitate by cellular dehydrogenases.26 Briefly, 4 x 10⁴ cells/cm2 were plated in a 24 well dish and allowed to adhere overnight. The following day the cells were treated as described above. After 24 h of treatment, the medium was removed and the treatment was followed by addition of 0.5 mg/mL of MTT and incubation at 37 °C for 1 h. The medium was then removed, the cells were lysed and the resulting blue formazan crystals were dissolved in DMSO. The absorbance of each well was read on a microplate reader (Beckman Coulter LD 400C Luminescence detector) at 570 nm. The absorbance of the untreated controls was taken as 100% survival. Data are expressed as mean ± SD of three independent experiments.
Fluorimetric determination of intracellular fat content-Nile Red stainingIntracellular fat content was determined fluorimetrically based on staining with Nile Red, a vital lipophilic dye used to label fat accumulation in the cytosol.27–28 After 24 h of FFA exposure, adherent monolayer cells were washed twice with PBS and detached by trypsinization. After a 5 min centrifugation at 1,500 rpm, the cell pellet was resuspended in 3 mL of PBS and incubated with 0.75 μg/mL Nile Red dye for 15 min at room temperature.
Nile Red intracellular fluorescence was determined by flow cytometry using a Becton Dickinson FACSCalibur System on the FL2 emission channel through a 585 ± 21 nm band pass filter, following excitation with an argon ion laser source at 488 nm.29 Data were collected for 10,000 cells and analyzed using Cellquest software from BD Biosciences (San Jose, CA, USA).
Intracellular lipid droplet analysis by fluorescence microscopyHuH7 and IHH cells were seeded on a coverslip and exposed to FFA for 24 h as described above. Cells were then washed twice with PBS and fixed with 3% paraformaldehyde for 15 min. Intracellular neutral lipids were stained with Nile Red (3.3 μg/mL) for 15 min. Cell nuclei were stained with Hoechst 33258 dye for 15 min. All the staining procedures were carried out at room temperature while protecting the samples from direct light. Images were acquired with an inverted fluorescence microscope (Leica DM2000, Wetzlar Germany).
Extraction of RNA and cDNA synthesisAfter the cells were treated, the medium was removed, the cells were washed twice with PBS and after centrifugation, total RNA was isolated using TriReagent according to the manufacturer’s instructions. Briefly, cells were lysed with the reagent, chloroform was added and cellular RNA was precipitated with isopropyl alcohol. After washing with 75% ethanol, the RNA pellet was dissolved in nuclease-free water and stored at −80 °C until further analysis. RNA was quantified spectrophotometrically at 260 nm in a Beckman Coulter DU®730 spectrophotometer (Fullerton, CA, USA). The RNA purity was evaluated by measuring the ratio of absorbance at 260 nm/280 nm; RNA samples with appropriate purity showed values between 1.8 and 2.0. RNA integrity was evaluated by gel electrophoresis on standard 1% agarose/formaldehyde gels. Isolated RNA was resuspended in RNAse free water and stored at −80 °C until analysis. Total RNA (1 μg) was reverse transcribed using iScriptTM cDNA Synthesis kit (Bio-Rad) according to the manufacturer’s instructions. Reverse transcription was performed in a Thermal Cycler (Gene Amp PCR System 2400, Perkin Elmer, Boston, MA, USA) using the reaction protocol proposed by the manufacturer: 5 min at 25 °C (annealing), 45 min at 42 °C (cDNA synthesis), and 5 min at 85 °C (enzyme denaturation).
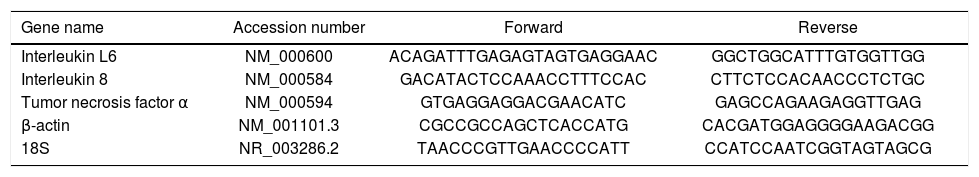
Real time quantitative PCRReal time quantitative PCR was performed on an i-Cycler IQ, 18S rRNA and β-actin were used as housekeeping genes. All primer pairs were synthesized by Sigma Genosys Ltd. (Haverhill, UK) and were designed using the software Beacon Designer 7.51 (PREMIER Biosoft International, Palo Alto, CA, USA). Primer sequences and references are specified in table 2. PCR amplification was carried out in a 25 μL reaction volume containing 25 ng of cDNA, 1 x iQ SYBR Green Supermix [100 mM KCl, 40 mM Tris-HCl pH 8.4, 0.4 mM each dNTP, 50 U/ mL iTaq DNA polymerase, 6 mM MgCl2, SYBR Green I, 20 nM fluorescein, and stabilizers] and 250 nM gene-specific sense and anti-sense primers and 100 nM primers for 18S. Standard curves using a “calibrator” cDNA (chosen from among the cDNA samples) were prepared for each target and reference gene. In order to verify the specificity of the amplification, a melt curve analysis was performed immediately after the amplification protocol. Nonspecific products of PCR were not found in any case. The relative quantification was calculated using the Pfaffl modification of the ΔΔCt equation, taking into account the efficiencies of individual genes. The results were normalized to 18S and β-actin, and the initial amount of the template in each sample was determined as relative expression vs. one of the samples chosen as reference (in this case the control sample), which is considered the 1 x sample. Results reported are the mean ± SD expression of at least 3 different determinations for each gene.
Set of primers used in Real-time quantitative PCR.
| Gene name | Accession number | Forward | Reverse |
|---|---|---|---|
| Interleukin L6 | NM_000600 | ACAGATTTGAGAGTAGTGAGGAAC | GGCTGGCATTTGTGGTTGG |
| Interleukin 8 | NM_000584 | GACATACTCCAAACCTTTCCAC | CTTCTCCACAACCCTCTGC |
| Tumor necrosis factor α | NM_000594 | GTGAGGAGGACGAACATC | GAGCCAGAAGAGGTTGAG |
| β-actin | NM_001101.3 | CGCCGCCAGCTCACCATG | CACGATGGAGGGGAAGACGG |
| 18S | NR_003286.2 | TAACCCGTTGAACCCCATT | CCATCCAATCGGTAGTAGCG |
Unless otherwise indicated, all the data are expressed as mean ± standard deviation of three independent experiments (biological replicates). Differences between groups were compared using Student’s t test. The level of significance was set at a P-value of 0.05.
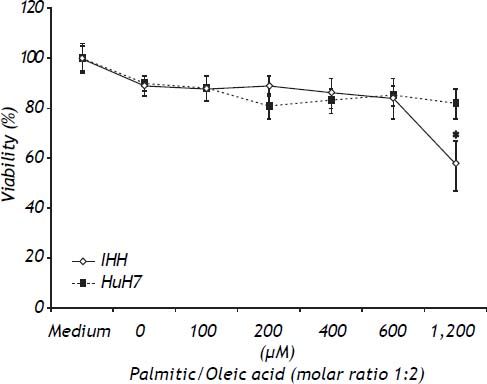
ResultsToxicity of the modelTo determine the toxic effects of the vehicle and the FFA, both cell lines were exposed to the same dose of vehicle (1.2% v/v), and increasing doses of the combination of palmitic/oleic acid (ratio 1:2) for 24 h. As shown in figure 1, the viability was lower in IHH than HuH7 cells at FFA doses higher than 600 μM (Figure 1). Based on these data, the highest doses of palmitic/oleic acid used for IHH and HuH7 were 600 and 1200 μM, respectively. Under these conditions the cell viability for both cell lines was higher than 85%.
 in medium containing bovine serum albumin in a molar ratio to free fatty acid of 1:4 and 1.2% v/v DMSO. * P < 0.05 vs. control (0 μM).")
Toxicity of FFA assessed by the MTT test. HuH7 and IHH cells were exposed for 24 h to increasing doses of palmitic/oleic acid (molar ratio of 1:2) in medium containing bovine serum albumin in a molar ratio to free fatty acid of 1:4 and 1.2% v/v DMSO. * P < 0.05 vs. control (0 μM).
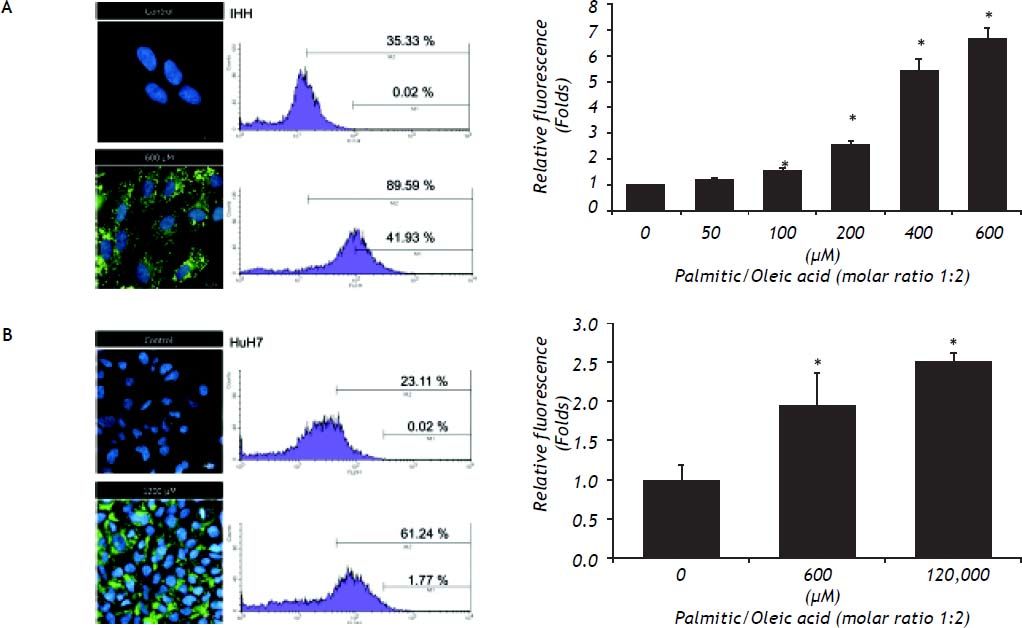
The content of intracellular lipid droplets was measured by flow cytometry. A dose-dependent effect was observed, with the increase starting to be significant from 100 μM (Figure 2, right panel) and reaching the highest value at 600 μM for IHH cells (6.4 times greater than control, P = 0.05) and HuH7 cells that were exposed to 1,200 μM FFA. The intracellular fat overload was confirmed by fluorescence microscopy, which showed the same dose dependence (Figure 2, left panel). Of note is the observation that, as shown in figure 1, no significant effect on cell viability was observed despite a significant intracellular accumulation of fatty acids.
 is concordant with the percentage of cells (right) with high (M2) and very high fluorescence (M1) assessed by flow cytometry. The overall increase in fluorescence due to the presence of lipid droplets in all the events measured (10,000 cells) is significant (low).* P < 0.05 vs. control (0 μM).")
The increase of lipid droplets induced by exposure to FFA observed by fluorescence microscopy with Nile Red dye (left) is concordant with the percentage of cells (right) with high (M2) and very high fluorescence (M1) assessed by flow cytometry. The overall increase in fluorescence due to the presence of lipid droplets in all the events measured (10,000 cells) is significant (low).* P < 0.05 vs. control (0 μM).
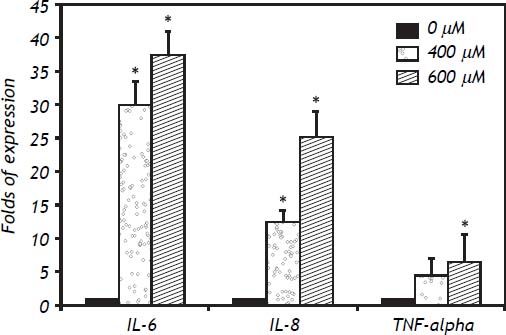
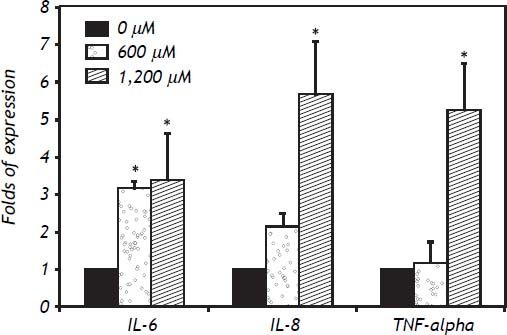
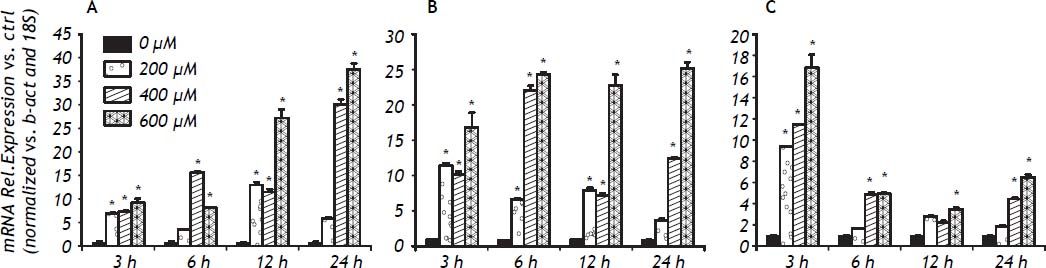
In IHH cells there was a notable upregulation of all three cytokines analyzed, the most highly expressed being IL-6, followed by IL-8 and TNF-α. In IHH cells there was an increase dependent on the dose of FFA (Figure 3). It is important to mention that the HuH7 cells show a similar dose response to that of IHH cells, but with lower magnitude (Figure 4). The similarity of the effects in two different hepatocyte cell lines strengthens the case for a role of FFA as promoters of hepatic inflammation.
. * P < 0.05 vs. control (0 μM).")
. * P < 0.05 vs. control (0 μM).")
The inflammatory response to FFA in IHH cells is not only related to the amount of FFA but also to the length of the exposure. Examination of the time course was important to detect differences between the cytokines analyzed: the fastest response was observed with TNF-α, followed by IL-8 and IL-6. The expression of IL-6 increased over the exposure, with maximum values seen at 24 h of exposure. For IL-8 a plateau effect was observed after 6 h, and even a small reduction at low doses of FFA. TNF-α showed a spike after 3 h of exposure to 600 μM of FFA (Figure 5).
Discussion. *P < 0.05 vs. control (0 μM). A. IL-6 gene expression. B. IL-8 gene expression. C. TNF-α gene expression.")
In the context of the intensive interest in research on NAFLD, this manuscript provides useful evidence about the inflammatory reaction in hepatocytes secondary to FFA toxicity. First, our data indicate that there is a sequential pattern of inflammatory cytokine production in the response to FFA. This information is important for experimental design, providing information about the role of time in FFA exposure under experimental conditions. Second, this study is a proof of concept of the influence of time on the response of the liver, consistent with previous data from in vivo models.
It is well known that the inflammatory response is a rapid host immune response against external or even internal damage,30 including lipotoxicity secondary to FFA exposure. The insult secondary to FFA is the trigger for the more complex pathological pathways involved in lipotoxicity, including oxidative stress and apoptosis.31 This phenomenon is observed in several in vitro conditions, but also is reproduced in vivo and in clinical settings. In subjects in whom a stress factor such as surgery is involved, a rapid inflammatory response is observed in the first hours after the stimulus. The IL-6 inflammatory response is particularly intense, the relevance of this fast response is related to its participation in the development of insulin resistance, as apart from cortisol levels, IL-6 level is the best predictor of insulin resistance.32
This type of response seems to be ubiquitous. In cultured visceral and subcutaneous abdominal adipose tissues an increase in TNF-α is observed during the first 4 h, followed by a large reduction during the next hours, while for IL-6 the highest peak is reached only after 4 h.33 This differential inflammatory response could be the trigger of a complex loop between adipose tissue and target organs (including the liver and muscle) that eventually promotes insulin resistance and a chronic inflammatory state.34 This suggests a complex interaction between the inflammatory and adipogenic responses, for which the initial stimuli are not defined. Our data show that FFA are an initiating stimulus for an inflammatory response, even in the absence of the classic inflammatory cells involved in liver physiology.35
The response observed in these experiments seems similar to those observed secondary to injury caused by cytotoxins36,37 or xenobiotics.38 This suggests that they represent a primitive response to any cellular damage, not just that resulting from lipotoxicity. However, in people with NAFLD this stimulus is permanent and promotes damage in hepatocytes and in the complex network of cells involved in liver physiology.
These results highlight some interesting issues, including the rapid immune (inflammatory) response from hepatocytes. This is a common pathway secondary to lipotoxicity in conventional immune cells.39 The other interesting issue is that the response observed in this in vitro system is very close to that observed in experimental models of diabetes and lipotoxicity. This gives support to the hypothesis regarding the importance of fatty acids as source of chronic low grade inflammation, a keystone of metabolic syndrome and its complications.40,41 The increased expression of TNF-α would participate not only in the apoptotic response, but also in the loop of liver steatosis mediated by inflammation.42
All together kinetics would help to analyze potential targets to treat the inflammatory response in NAFLD.
In conclusion, the inflammatory response of cultured hepatocytes treated with low doses of FFA is rapid and has differential kinetics depending on the inflammatory cytokine involved. This is important information for experimental design in future research.
AcknowledgementsThe present work was supported by European Union Seventh Framework Program (FP7/2007-2013) under grant agreement No. Health-F2-2009-241762, for the project FLIP; Italian National Grant MIUR (Art.13 D.LGS 297/99-Progetto Nutrizione e Salute), and Fondazione Italiana Fegato, ONLUS (FIF). NCT was supported by a research grant of FIF and Entry Level Fellowship Dame Sheila Sherlock EASL Fellowship Program.


