


Background and rationale. Nonalcoholic fatty liver disease (NAFLD) is the most common cause of pediatric liver disease in western countries. Its prevalence in Indian subcontinent is not well studied.
Material and methods. In a school based cross sectional study we have screened overweight and obese children in the age group of 11 to 15 years for NAFLD. Ultrasonography, elevated serum transaminases, fibroscan were used for defining NAFLD. Dietary habits, blood pressure, serum lipid profile, blood counts and insulin resistance were recorded. The relation of fibrosis 4 score, pediatric NAFLD fibrosis index, aspartate transaminases to platelet ratio index (APRI) with fibroscan was evaluated.
Results. Out of 616 students screened 198 were overweight and obese. Hundred students and their parents gave informed consent for the further evaluation. The prevalence of NAFLD was 62% in overweight and obese children. Fatty liver was found in 50 % students on ultrasonography, liver stiffness (≥ 6.1 Kilopascals) in 23% and raised alanine transaminase in 30%. Hypertension, dyslipidemia, diabetes mellitus and insulin resistance were seen in 6%, 18%, 2% and 66% students respectively. Systolic hypertension, serum triglyceride, aspartate transaminase, APRI was significantly higher in the NAFLD group. On binary logistic regression only systolic hypertension was an independent risk factor for NAFLD.
Conclusion. In conclusion NAFLD is common in asymptomatic overweight and obese Indian children. Systolic hypertension is the only independent factor associated with NAFLD. Fibroscan has limited role for screening. We recommend screening for NAFLD in this high risk group with alanine transaminases and ultrasonography.
The term nonalcoholic fatty liver disease (NAFLD) encompasses a progressive disorder from fatty liver to nonalcoholic steatohepatitis to cirrhosis. The worldwide increase in obesity, insulin resistance, dyslipidemia, secondary to changes in dietary habits and increased sedentary lifestyle, has been accompanied by a worldwide spread of NAFLD. It is considered as a hepatic manifestation of metabolic syndrome. The disease is increasingly affecting lower prevalence areas such as developing countries. This is particularly worrying in young adults and children.1 Over the past 3 decades the prevalence of NAFLD has increased to epidemic proportion. It is the most common cause of chronic liver disease in western countries in the pediatric population.2 Overweight and obesity are risk factors for NAFLD.3 Serum transaminases, ultrasonography and liver biopsy were used for assessing prevalence in previous studies.2 The sensitivity of each of the tests varies. The role of transient elastography and controlled attenuation parameter in diagnosis of NAFLD is not clear at present.4 Due to paucity of studies from India the exact prevalence of NAFLD in children is not known. We have done a school based cross sectional study with screening for NAFLD in overweight and obese children using ultrasonography, transaminases and fibroscan.
Material and MethodsThis was a school based cross sectional study, conducted in a convent high school in south Mumbai. The study was approved by institutional ethics committee of our hospital. Informed consent from parents and assent consent from children were obtained. Height and weight of school children in the age group 11 to 15 years (between sixth to ninth classes) were measured. The body mass index (BMI) was calculated. The BMI cutoffs for overweight and obese Indian subjects (Khadilkar, et al.) differ from international (Cole, et al.) standards.5,6 Categorization in overweight and obese was done using both Khadilkar, et al. criteria as well as Cole, et al. criteria. A detailed proforma of demographic profile, dietary habits over a preceding week, history of diabetes mellitus and hypertension was completed. Dietary habits questionnaire included vegetarian and non-vegetarian meals per week, fish/egg/other non-vegetarian meal per week, type and quantity of fast foods, soft drinks and chocolates consumed per week. Anthropometric measurements of height, weight, waist circumference, hip circumference were taken. Complete blood count, serum alanine and aspartate transaminases, total cholesterol, triglyceride, insulin level and fasting blood sugar were done. Homeostasis model assessment estimated insulin resistance (HOMA IR) was calculated from fasting insulin and blood sugar values. The fibrosis 4 score (FIB 4),7 pediatric NAFLD fibrosis index8 (PNFI), aspartate transaminase to platelet ratio index (APRI)9 were calculated. Abdominal ultrasonography and transient elas-tography were done. For those students who had fatty liver on ultrasonography, abnormal liver enzymes or fibroscan, HBsAg, Anti-HCV, ceruloplasmin and anti-nuclear antibody were also tested.
The current gold standard for diagnosis of NAFLD is liver biopsy. However, it is invasive, costly and has complications. It is limited by operator experience.10 Hence liver biopsy was not used in the present study.
The diagnosis of NAFLD was made by investigations used in daily clinical practice. Elevated serum glutamic pyruvate transaminase (SGPT) levels (> 40 IU/l) is used in our clinical practice to diagnose steatohepatitis. The proposed low threshold by Prati, et al.11 and Schwimmer, et al.12 are still not used routinely. On ultrasonography (USG) NAFLD is diagnosed by the presence of at least two of three abnormal findings: diffusely increased liver echogenicity (greater than kidney or spleen), vascular blurring and deep attenuation of the ultrasound signal.13 Fibroscan is used to measure stiffness in right lobe of the liver in supine position with abduction of the right arm. Speed of propagation of the wave in liver depends on its stiffness. The velocity of shear wave increases in proportion to the stiffness of the liver. The stiffness derived is in kilopascal (KPa) unit. Probe of the fibroscan is equipped with a 3.5 MHz central frequency and a 9 mm external diameter ultrasonic transducer mounted on the axis of a vibrator. The probe was placed between the ribs on the right lobe of the liver. The liver parenchyma free of large vascular structures is noted. When the probe is pressed the vibrator gives a painless push to the liver tissue which creates shear wave. As the shear wave propagates in the liver tissue the readings were taken. On each subject 10 readings were taken. The fibroscan reading is valid only if the interquartile range (IQR) for all successful measurements of less than 30% of the median value with at least 60% succes rate. Fibroscan measures stiffness in 1 cm diameter core of liver tissue in depth between 2.5 and 6.5 cm. Fibroscan has been reported as a good predictor for significant fibrosis in NAFLD children at stiffness ≥ 6.1 KPa.14 The diagnosis of NAFLD includes the whole spectrum of steatosis, steatohepatitis and significant fibrosis.
Blood pressure (BP) was measured by the auscultatory method in sitting position with back supported and after sitting quietly for 5 min. Feet were on the floor, right arm supported and cubital fossa was at the heart level. Cuffs of appropriate size as per the size of the arm were used. In children with elevated readings, BP was again measured after 10 min.15 Hypertension is defined as BP ≥ 135/85 mmHg.16
The waist circumference was calculated using tape applied horizontally just above the upper lateral border of the right ileum. Waist circumference > 90 cm for males and > 80 cm for females was considered abnormal.16 Standing height was measured using a portable stadiometer. Weight was measured using portable electronic weighing scale accurate to 100 g.
The sample size was calculated using α error of 0.05, β error of 0.20 with prevalence of NAFLD in obese children being 59%17 and in normal pediatric population it is 3%.18 Using below mentioned formula and website (http:// www2.ccrb.cuhk.edu.hk/stat/proportion/OSp_equality.htm) sample size calculated was 7.

In view of sufficient resources and availability of tools we decided to enroll minimum of 90 subjects.
StatisticsQualitative data was represented in form of frequency and percentage. Qualitative data included gender, investigations like USG, BMI categories, etc. Association between gender of subject and prevalence of NAFLD by USG, SGPT and Fibroscan abnormality was assessed by χ2 test. In view of small counts, adjacent row data was pooled & χ2 test reapplied. Quantitative data was represented using mean ± standard deviation (SD) and median & IQR. Quantitative data included age, systolic & diastolic BP, waist circumference (cm) and other anthropometric measurements, and level of various biochemical variables like Aspartate Transaminase, SGPT and HOMA IR, etc. Analysis of quantitative data between the subjects with & without NAFLD was done using unpaired t-test if the data passed ‘Normality test’ or by Mann-Whitney test as data failed ‘Normality test’. Correlation between Fibros-can-Stiffness (KPa), APRI, FIB 4 score & PNFI was done by using Pearson’s correlation. To assess the statistically significant predictors of NAFLD, binary logistic regression was applied between NAFLD as dependent variable and a set of Independent (Predictor) variables. Results were graphically represented where deemed necessary. Microsoft Excel 2010 was used for data entry and PSPP (0.8.5) was used for statistical analysis. Graphical representation was done using Excel 2010.
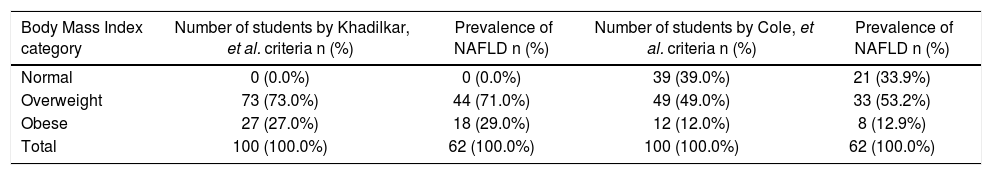
ResultsSix hundred and sixteen students between age group 11 to 15 years were screened for overweight and obesity using Khadilkar, et al. criteria; 198 (32.14 %) were overweight and obese. These were also classified as overweight/obese (114 students, 18.5%) by Cole, et al. criteria. The consent for the further evaluation was given by hundred students and their parents. The prevalence of NAFLD was 62 (62%) (Table 1). Out of 39 students whose BMI was normal by Cole, et al. criteria 21 students had NAFLD.
Prevalence of normal BMI, overweight, obesity and NAFLD according to Khadilkar, et al. and Cole, et al. criteria.
| Body Mass Index category | Number of students by Khadilkar, et al. criteria n (%) | Prevalence of NAFLD n (%) | Number of students by Cole, et al. criteria n (%) | Prevalence of NAFLD n (%) |
|---|---|---|---|---|
| Normal | 0 (0.0%) | 0 (0.0%) | 39 (39.0%) | 21 (33.9%) |
| Overweight | 73 (73.0%) | 44 (71.0%) | 49 (49.0%) | 33 (53.2%) |
| Obese | 27 (27.0%) | 18 (29.0%) | 12 (12.0%) | 8 (12.9%) |
| Total | 100 (100.0%) | 62 (100.0%) | 100 (100.0%) | 62 (100.0%) |
NAFLD: nonalcoholic fatty liver disease.
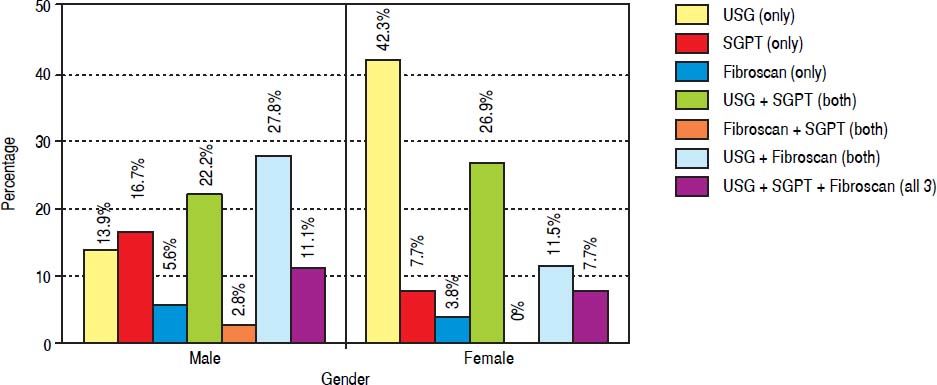
Abdominal obesity was present in 16 (16%) students with males having significantly higher prevalence than females (P value 0.03). Ten out of 16 students with abdominal obesity had NAFLD. On ultrasound fatty liver was found in 50 (50%) students out of which 48 students (96%) were having grade 1 and 4% (2 students) were having grade 2 fatty liver. Fibrosis value ≥ 6.1 KPa was found in 23 (23%) students. Fibroscan stiffness was invalid in 21% students due to low success rate or high IQR/Median ratio and in 1 student fibroscan could not be done due to obesity. Raised SGPT was seen in 30% students when cut off used was 40 IU/L but when cut off used was 30 IU/l in males and 19 IU/l in females then the raised SGPT was seen in 90 % students. The prevalence of raised SGPT increases further to 98 % if cut off of 25.8 for boys and 22.1 IU/l for girls was used. The male to female ratio in NAFLD group is 1.4 (36:26). The prevalence of NAFLD by different modalities and gender is shown in figure 1.

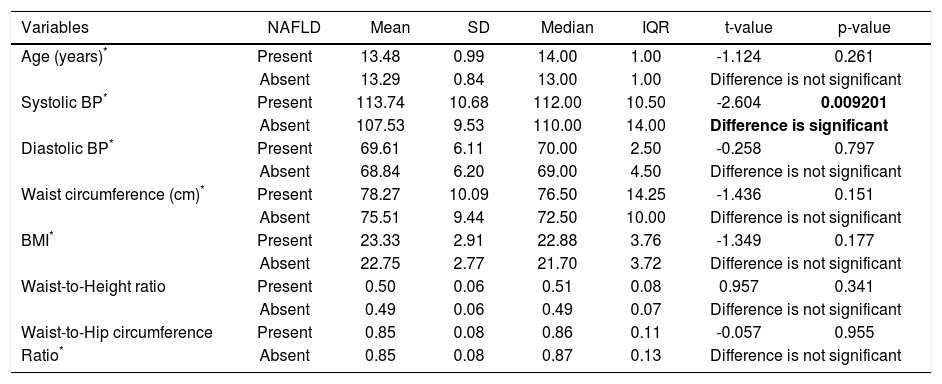
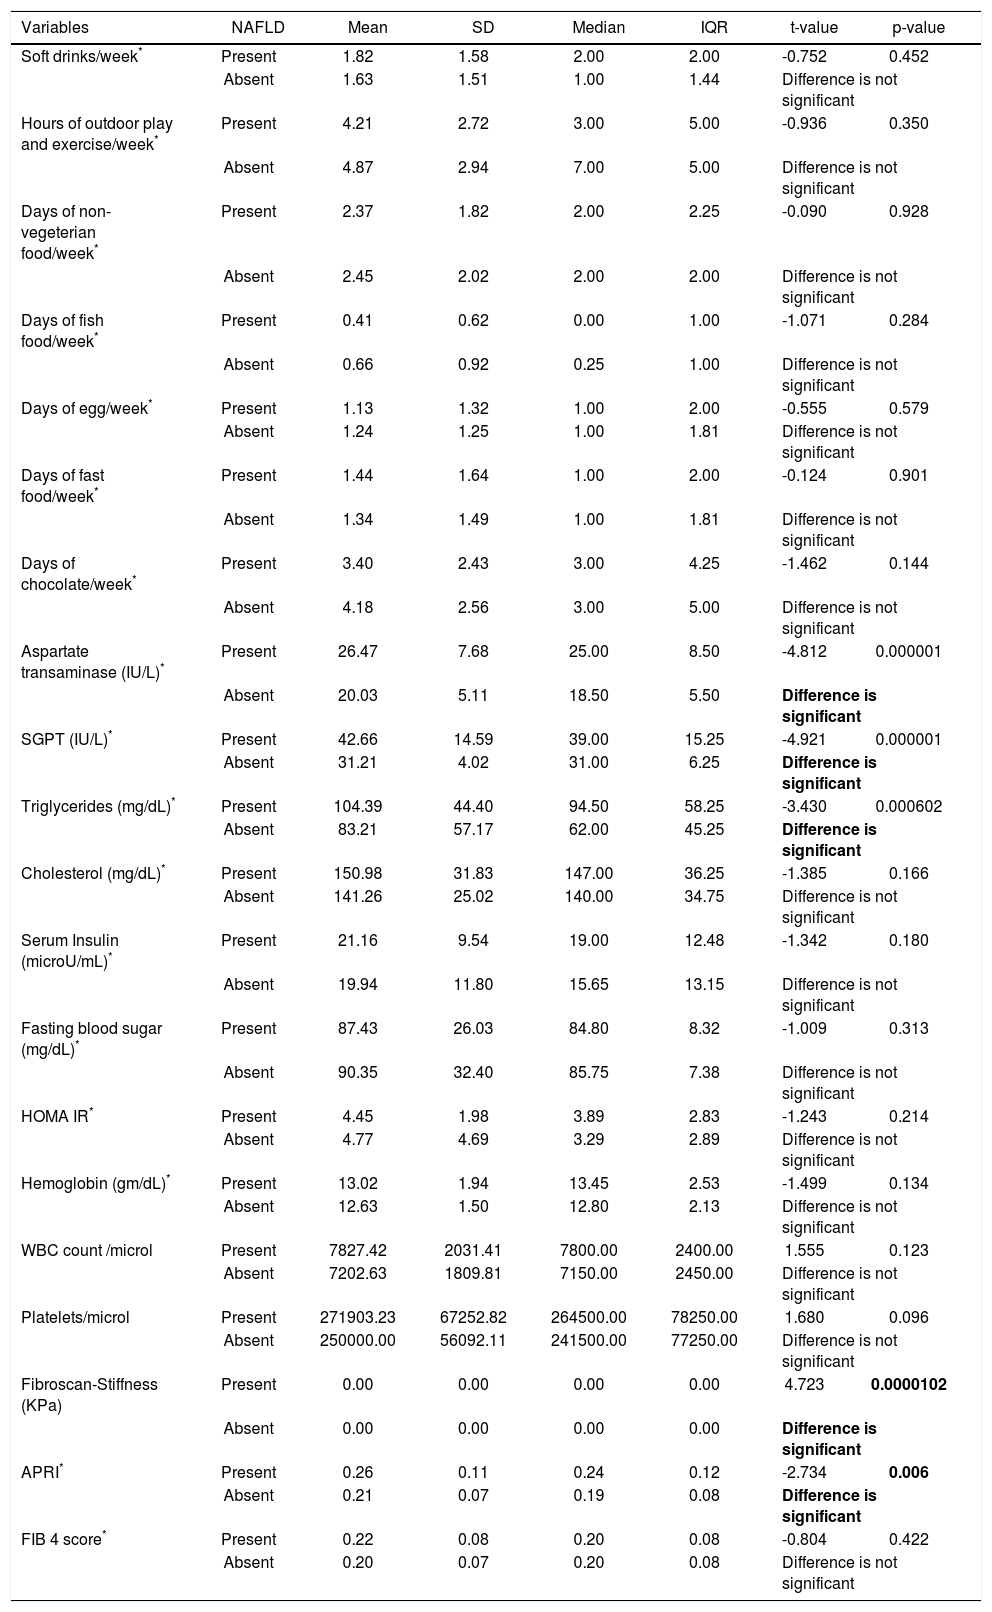
Hypertension was detected in 6% students. Systolic BP was elevated in 4% students and all of them were diagnosed as NAFLD. Isolated diastolic hypertension was seen in 2% students. Combined hypertension was seen in 2% students. Hypertriglyceridemia was noted in 14% students, hypercholesterolemia in 4%, diabetes mellitus in 2%, impaired fasting glucose levels in 1% and hyperin-sulinemia in 38%. The insulin resistance with HOMA IR (cut off > 3) was present in 66% students. On applying independent t test for continuous variables between the NAFLD and non-NAFLD group (Tables 2 and 3) serum triglyceride, systolic hypertension, aspartate transaminase and APRI value were significantly different. Waist circumference, WBC count, Waist to height, waist to hip ratio, BMI, HOMA IR, serum cholesterol, days of nonvegeterian diet, days of fast food/chocolate eating per week, days of outdoor play (at least 1 h per day) per week were not significant. Fifty-two percent of the students never did exercise or played outdoors for one hour per day. Out of these 65 % (34 students) were having NAFLD. Of the 48 (48%) who did exercise and played outdoors 28 students (58%) had NAFLD. This difference was not statistically significant. Diabetes mellitus was found in 2 students out of which 1 student had NAFLD. Acanthosis nigricans was detected in 2 students. Binary Logistic regression analysis was applied in the NAFLD group. Only systolic hypertension was found to be independently related to NAFLD. No dietary pattern was significant (Table 4). The correlation between fibroscan stiffness, APRI, FIB 4, PNFI scores of fibrosis are shown in table 5. Fibroscan stiffness correlates significantly with PNFI and APRI correlates significantly with FIB 4 score.
Comparison of age, BP & various anthropometric variables between students with & without NAFLD.
| Variables | NAFLD | Mean | SD | Median | IQR | t-value | p-value |
|---|---|---|---|---|---|---|---|
| Age (years)* | Present | 13.48 | 0.99 | 14.00 | 1.00 | -1.124 | 0.261 |
| Absent | 13.29 | 0.84 | 13.00 | 1.00 | Difference is not significant | ||
| Systolic BP* | Present | 113.74 | 10.68 | 112.00 | 10.50 | -2.604 | 0.009201 |
| Absent | 107.53 | 9.53 | 110.00 | 14.00 | Difference is significant | ||
| Diastolic BP* | Present | 69.61 | 6.11 | 70.00 | 2.50 | -0.258 | 0.797 |
| Absent | 68.84 | 6.20 | 69.00 | 4.50 | Difference is not significant | ||
| Waist circumference (cm)* | Present | 78.27 | 10.09 | 76.50 | 14.25 | -1.436 | 0.151 |
| Absent | 75.51 | 9.44 | 72.50 | 10.00 | Difference is not significant | ||
| BMI* | Present | 23.33 | 2.91 | 22.88 | 3.76 | -1.349 | 0.177 |
| Absent | 22.75 | 2.77 | 21.70 | 3.72 | Difference is not significant | ||
| Waist-to-Height ratio | Present | 0.50 | 0.06 | 0.51 | 0.08 | 0.957 | 0.341 |
| Absent | 0.49 | 0.06 | 0.49 | 0.07 | Difference is not significant | ||
| Waist-to-Hip circumference | Present | 0.85 | 0.08 | 0.86 | 0.11 | -0.057 | 0.955 |
| Ratio* | Absent | 0.85 | 0.08 | 0.87 | 0.13 | Difference is not significant | |
Unpaired t-test applied.
Comparison of frequency per week of various food items & biochemical investigations between students with & without NAFLD.
| Variables | NAFLD | Mean | SD | Median | IQR | t-value | p-value |
|---|---|---|---|---|---|---|---|
| Soft drinks/week* | Present | 1.82 | 1.58 | 2.00 | 2.00 | -0.752 | 0.452 |
| Absent | 1.63 | 1.51 | 1.00 | 1.44 | Difference is not significant | ||
| Hours of outdoor play and exercise/week* | Present | 4.21 | 2.72 | 3.00 | 5.00 | -0.936 | 0.350 |
| Absent | 4.87 | 2.94 | 7.00 | 5.00 | Difference is not significant | ||
| Days of non-vegeterian food/week* | Present | 2.37 | 1.82 | 2.00 | 2.25 | -0.090 | 0.928 |
| Absent | 2.45 | 2.02 | 2.00 | 2.00 | Difference is not significant | ||
| Days of fish food/week* | Present | 0.41 | 0.62 | 0.00 | 1.00 | -1.071 | 0.284 |
| Absent | 0.66 | 0.92 | 0.25 | 1.00 | Difference is not significant | ||
| Days of egg/week* | Present | 1.13 | 1.32 | 1.00 | 2.00 | -0.555 | 0.579 |
| Absent | 1.24 | 1.25 | 1.00 | 1.81 | Difference is not significant | ||
| Days of fast food/week* | Present | 1.44 | 1.64 | 1.00 | 2.00 | -0.124 | 0.901 |
| Absent | 1.34 | 1.49 | 1.00 | 1.81 | Difference is not significant | ||
| Days of chocolate/week* | Present | 3.40 | 2.43 | 3.00 | 4.25 | -1.462 | 0.144 |
| Absent | 4.18 | 2.56 | 3.00 | 5.00 | Difference is not significant | ||
| Aspartate transaminase (IU/L)* | Present | 26.47 | 7.68 | 25.00 | 8.50 | -4.812 | 0.000001 |
| Absent | 20.03 | 5.11 | 18.50 | 5.50 | Difference is significant | ||
| SGPT (IU/L)* | Present | 42.66 | 14.59 | 39.00 | 15.25 | -4.921 | 0.000001 |
| Absent | 31.21 | 4.02 | 31.00 | 6.25 | Difference is significant | ||
| Triglycerides (mg/dL)* | Present | 104.39 | 44.40 | 94.50 | 58.25 | -3.430 | 0.000602 |
| Absent | 83.21 | 57.17 | 62.00 | 45.25 | Difference is significant | ||
| Cholesterol (mg/dL)* | Present | 150.98 | 31.83 | 147.00 | 36.25 | -1.385 | 0.166 |
| Absent | 141.26 | 25.02 | 140.00 | 34.75 | Difference is not significant | ||
| Serum Insulin (microU/mL)* | Present | 21.16 | 9.54 | 19.00 | 12.48 | -1.342 | 0.180 |
| Absent | 19.94 | 11.80 | 15.65 | 13.15 | Difference is not significant | ||
| Fasting blood sugar (mg/dL)* | Present | 87.43 | 26.03 | 84.80 | 8.32 | -1.009 | 0.313 |
| Absent | 90.35 | 32.40 | 85.75 | 7.38 | Difference is not significant | ||
| HOMA IR* | Present | 4.45 | 1.98 | 3.89 | 2.83 | -1.243 | 0.214 |
| Absent | 4.77 | 4.69 | 3.29 | 2.89 | Difference is not significant | ||
| Hemoglobin (gm/dL)* | Present | 13.02 | 1.94 | 13.45 | 2.53 | -1.499 | 0.134 |
| Absent | 12.63 | 1.50 | 12.80 | 2.13 | Difference is not significant | ||
| WBC count /microl | Present | 7827.42 | 2031.41 | 7800.00 | 2400.00 | 1.555 | 0.123 |
| Absent | 7202.63 | 1809.81 | 7150.00 | 2450.00 | Difference is not significant | ||
| Platelets/microl | Present | 271903.23 | 67252.82 | 264500.00 | 78250.00 | 1.680 | 0.096 |
| Absent | 250000.00 | 56092.11 | 241500.00 | 77250.00 | Difference is not significant | ||
| Fibroscan-Stiffness (KPa) | Present | 0.00 | 0.00 | 0.00 | 0.00 | 4.723 | 0.0000102 |
| Absent | 0.00 | 0.00 | 0.00 | 0.00 | Difference is significant | ||
| APRI* | Present | 0.26 | 0.11 | 0.24 | 0.12 | -2.734 | 0.006 |
| Absent | 0.21 | 0.07 | 0.19 | 0.08 | Difference is significant | ||
| FIB 4 score* | Present | 0.22 | 0.08 | 0.20 | 0.08 | -0.804 | 0.422 |
| Absent | 0.20 | 0.07 | 0.20 | 0.08 | Difference is not significant | ||
Unpaired t-test applied.
Data failed ’Normality’ test. Hence Mann-Whitney test applied. T-value replaced by Z-value. APRI: aspartate transaminase to Platelet Ratio Index. FIB 4: fibrosis 4. HOMA IR: homeostasis model assessment estimated insulin resistance. IQR: interquartile range. KPa: Kilopascals. NAFLD: nonalcoholic fatty liver disease. SD: standard deviation. SGPT: serum glutamic pyruvate transaminase. WBC: white blood cell.
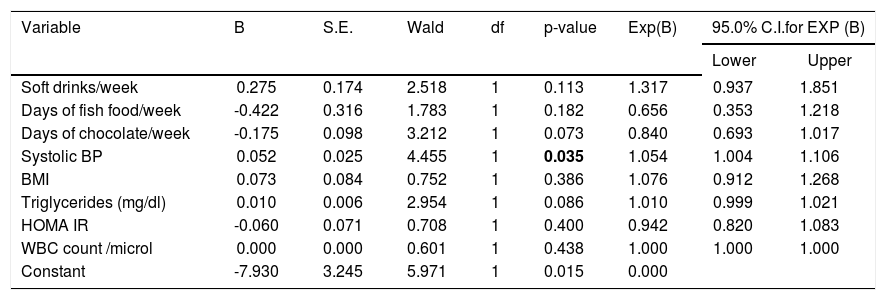
Binary logistic regression between ‘NAFLD present as 1, absent as 0’ as dependent variable & and a set of independent (predictor) variables.
| Variable | B | S.E. | Wald | df | p-value | Exp(B) | 95.0% C.I.for EXP (B) | |
|---|---|---|---|---|---|---|---|---|
| Lower | Upper | |||||||
| Soft drinks/week | 0.275 | 0.174 | 2.518 | 1 | 0.113 | 1.317 | 0.937 | 1.851 |
| Days of fish food/week | -0.422 | 0.316 | 1.783 | 1 | 0.182 | 0.656 | 0.353 | 1.218 |
| Days of chocolate/week | -0.175 | 0.098 | 3.212 | 1 | 0.073 | 0.840 | 0.693 | 1.017 |
| Systolic BP | 0.052 | 0.025 | 4.455 | 1 | 0.035 | 1.054 | 1.004 | 1.106 |
| BMI | 0.073 | 0.084 | 0.752 | 1 | 0.386 | 1.076 | 0.912 | 1.268 |
| Triglycerides (mg/dl) | 0.010 | 0.006 | 2.954 | 1 | 0.086 | 1.010 | 0.999 | 1.021 |
| HOMA IR | -0.060 | 0.071 | 0.708 | 1 | 0.400 | 0.942 | 0.820 | 1.083 |
| WBC count /microl | 0.000 | 0.000 | 0.601 | 1 | 0.438 | 1.000 | 1.000 | 1.000 |
| Constant | -7.930 | 3.245 | 5.971 | 1 | 0.015 | 0.000 | ||
B: estimated multinomial logistic regression coefficients for the model. BMI: body mass index. BP: blood pressure. CI: confidence interval. Constant: constant of regression model. df: degree of f-eedom. Exp (B): exponentiation of the B coefficient which is an odds Ratio. HOMA IR: homeostasis model assessment estimated insulin resistance. SE: standard errors of the individual regression coefficients. Wald: Wald χ2test that tests the null hypothesis that the estimate equals 0. WBC: white blood cell.
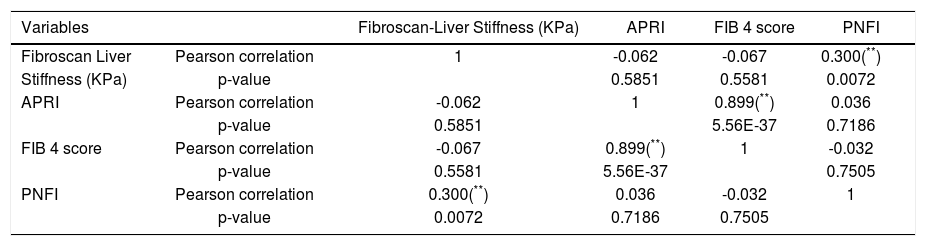
Correlation between fibroscan liver stiffness, APRI, FIB 4, PNFI scores of fibrosis.
| Variables | Fibroscan-Liver Stiffness (KPa) | APRI | FIB 4 score | PNFI | |
|---|---|---|---|---|---|
| Fibroscan Liver | Pearson correlation | 1 | -0.062 | -0.067 | 0.300(**) |
| Stiffness (KPa) | p-value | 0.5851 | 0.5581 | 0.0072 | |
| APRI | Pearson correlation | -0.062 | 1 | 0.899(**) | 0.036 |
| p-value | 0.5851 | 5.56E-37 | 0.7186 | ||
| FIB 4 score | Pearson correlation | -0.067 | 0.899(**) | 1 | -0.032 |
| p-value | 0.5581 | 5.56E-37 | 0.7505 | ||
| PNFI | Pearson correlation | 0.300(**) | 0.036 | -0.032 | 1 |
| p-value | 0.0072 | 0.7186 | 0.7505 |
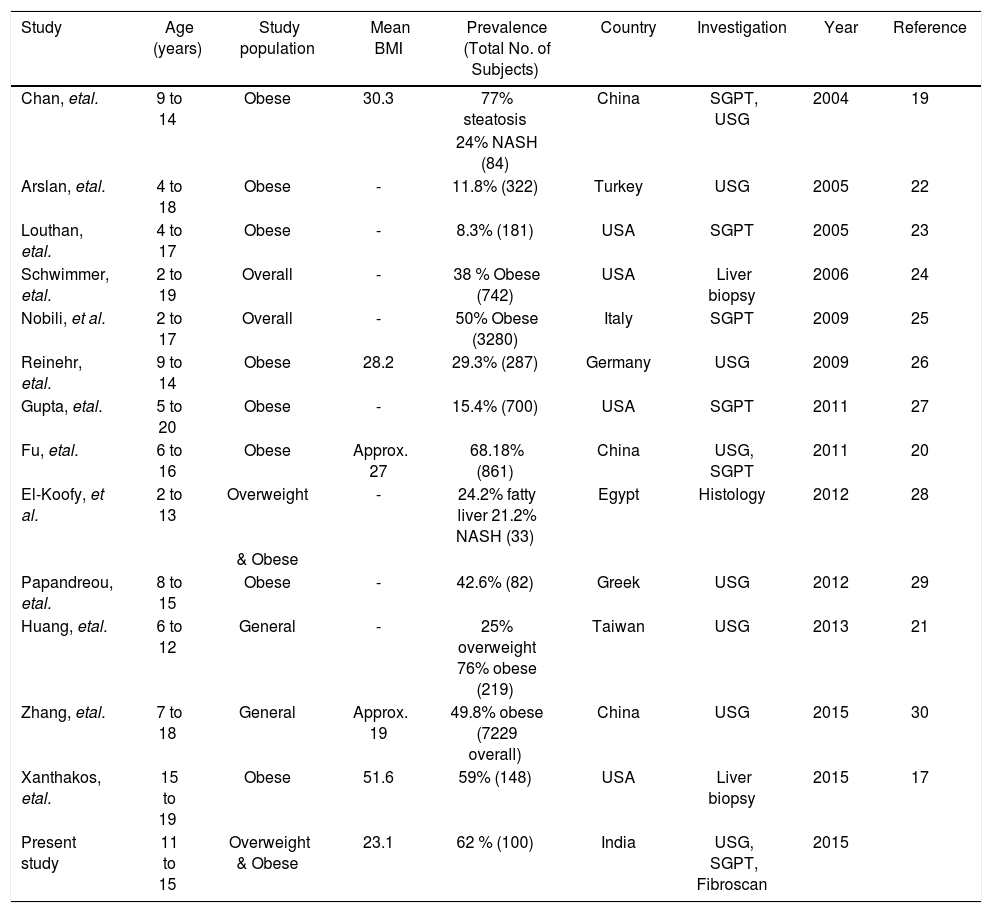
The prevalence of overweight and obesity in our study was 32.14 % by Khadilkar, et al. criteria and 18.5% with Cole, et al. criteria. The Khadilkar criteria are specially devised for Indian children and if we used only Cole, et al. criteria we will miss out a major portion of obese children who should be screened for NAFLD. This is reiterated by the fact that 21 out of 39 with normal BMI according to Cole, et al. criteria had NAFLD. The mean BMI in this study is 23.1 kg/m2 with maximum of 34.51 kg/m2. The prevalence of NAFLD in this study is 62% as suggested by fatty liver detected on ultrasonography, raised SGPT indicating NASH and liver stiffness pointing towards fibrosis. The highest prevalence of NAFLD in obese children was reported by Chan, et al.19 (77%), Fu, et al.20 (68.18%) and Huang, et al.21 (76%) by using ultrasonography. There is one research letter from India regarding prevalence of pediatric NAFLD.18 This study was hospital based in general pediatric population and used ultrasonography as a screening modality. They have not mentioned prevalence of obesity. The prevalence of NAFLD was 3%. The NAFLD was seen in 2 males with normal BMI and in 1 female with obesity. The comparison of prevalence of NAFLD in overweight and obese pediatric population in different studies is shown in table 6. Amongst all the studies in overweight and obesity with available mean BMI our study has the lowest BMI. This is due to the lower BMI used for defining overweight and obesity in Indian children as per Khadilkar, et al. criteria. Despite this low BMI the prevalence of NAFLD is amongst the highest. This indicates a predisposition of our population for NAFLD. Fibroscan could not be done in just 1 (1%) student. This means fibroscan can be done in this population with the adult probe. The fibrosis value ≥ 6.1 KPa was found in 23% students. The use of fibroscan is limited in screening as just 3 extra cases out of 62 were added by it when seen in respect of all cases detected and investigations used. However an importance of fibroscan lies in stratification of NAFLD. It is helpful for deciding on the need for frequent follow ups and liver biopsy. The cut off value for advanced fibrosis was adopted from another study in a different population.14 Still, the importance and its significance cannot be undermined. The prevalence of advanced fibrosis was 0.7% in a previous study using histology as the gold standard.17 In our study advanced fibrosis (≥ 6.9 KPa) was seen by fibroscan in 6 (9.6%) of NAFLD students. The prevalence of isolated fatty liver without abnormal SGPT and liver stiffness was 16% but hyperechoic liver was seen in 50%. This emphasizes the fact that hyperechoic liver on ultrasonography not only means fatty liver but it can be seen in steatohepatitis and even in significant fibrosis.
The prevalence of NAFLD in different studies world wide.
| Study | Age (years) | Study population | Mean BMI | Prevalence (Total No. of Subjects) | Country | Investigation | Year | Reference |
|---|---|---|---|---|---|---|---|---|
| Chan, etal. | 9 to 14 | Obese | 30.3 | 77% steatosis | China | SGPT, USG | 2004 | 19 |
| 24% NASH (84) | ||||||||
| Arslan, etal. | 4 to 18 | Obese | - | 11.8% (322) | Turkey | USG | 2005 | 22 |
| Louthan, etal. | 4 to 17 | Obese | - | 8.3% (181) | USA | SGPT | 2005 | 23 |
| Schwimmer, etal. | 2 to 19 | Overall | - | 38 % Obese (742) | USA | Liver biopsy | 2006 | 24 |
| Nobili, et al. | 2 to 17 | Overall | - | 50% Obese (3280) | Italy | SGPT | 2009 | 25 |
| Reinehr, etal. | 9 to 14 | Obese | 28.2 | 29.3% (287) | Germany | USG | 2009 | 26 |
| Gupta, etal. | 5 to 20 | Obese | - | 15.4% (700) | USA | SGPT | 2011 | 27 |
| Fu, etal. | 6 to 16 | Obese | Approx. 27 | 68.18% (861) | China | USG, SGPT | 2011 | 20 |
| El-Koofy, et al. | 2 to 13 | Overweight | - | 24.2% fatty liver 21.2% NASH (33) | Egypt | Histology | 2012 | 28 |
| & Obese | ||||||||
| Papandreou, etal. | 8 to 15 | Obese | - | 42.6% (82) | Greek | USG | 2012 | 29 |
| Huang, etal. | 6 to 12 | General | - | 25% overweight 76% obese (219) | Taiwan | USG | 2013 | 21 |
| Zhang, etal. | 7 to 18 | General | Approx. 19 | 49.8% obese (7229 overall) | China | USG | 2015 | 30 |
| Xanthakos, etal. | 15 to 19 | Obese | 51.6 | 59% (148) | USA | Liver biopsy | 2015 | 17 |
| Present study | 11 to 15 | Overweight & Obese | 23.1 | 62 % (100) | India | USG, SGPT, Fibroscan | 2015 |
BMI: body mass Index, NASH: non alcoholic steałohepatitis, SGPT: serum glutamic pyruvate tansaminase, USG: ultrasonography.
Raised SGPT was seen in 30 (30%) students when cut off used was 40 IU/L but prevalence of the raised SGPT was seen in 90% and 98 % students if different cut off used as proposed in previous studies.11,12 The accurate cut off value for liver enzymes is not studied in the Indian children. The serum glutamic oxaloacetic transaminase was significantly higher in NAFLD group. Similar findings have been reported in other study.22 Positive correlation was seen between SGPT and triglyceride values (Pearson coefficient 0.336, P value 0.001) in study population. Similar finding was also shown in the one previous study in pediatric patients.31 The Pearson correlation between SGPT and liver stiffness was negative but was not significant. The waist circumference was not higher in NAFLD group. Previous studies have found it significantly higher in them.20,29 Dietary & lifestyle habits were not found to be significantly different between two groups. These were based on weekly recall of activities and lapses in history may be possible. Gender was not a predisposing factor in NAFLD in the present study. However, many studies have showed NAFLD prevalence to be more in males than females.32,33 NAFLD students do not have higher BMI than non-NAFLD overweight and obese students in our subjects. Few studies have showed similar findings.17 Higher BMI in NAFLD group have been reported frequently.29,33,34 This means some unknown factor which differs between these overweight/obese children exists which predispose them to NAFLD. Serum triglyceride levels were higher in NAFLD group than non-NAFLD. Similar findings have been reported in the past.27,34 We did not find serum cholesterol to be significant in the NAFLD group unlike in other study.20 Diabetes mellitus was found in 2 students out of which 1 student had NAFLD. The HOMA IR, fasting insulin and fasting blood sugar levels were not significantly different between the NAFLD and non NAFLD group. This finding is in contradiction with many of the studies published.20,27,29 These findings indicate that hyperinsulinemia and increased insulin resistance alone are not enough to explain NAFLD in our patients. HOMA IR was having positive correlation with BMI (Pearson coefficient 0.214, P value 0.032) but not with waist circumference. Dyslipidemia was seen in 18% in overall students. It is lower than other studies where dyslipidemia was found in higher number of patients.17,26 The age wise prevalence in the NAFLD was not statistically different and probably age is not an important factor in this group with NAFLD. Other studies have showed age to be significantly different in patients with NAFLD.27,33,34,35 The socioeconomic status was not available for comparison as this was a cross section study in school and students were not aware of the details of the family income but depending upon school records and locality they belonged to lower middle socioeconomic class.
When binary logistic regression was applied in the NAFLD group only systolic hypertension was found to be independently related. This is probably an effect and not the cause. Similar finding has been reported in the past.17,34 Waist circumference and cholesterol have also been found to be independent predictors of NAFLD in other study.36
The APRI values were significantly different between the NAFLD and non NAFLD groups. The components of this score are Serum glutamic oxaloacetic transaminase and platelet count.9 In FIB 4 score, age and SGPT were additional factors.7 Probably age has taken away significance as age was not significant in the present study. Our study does show positive correlation between PNFI and fibroscan and also between APRI and FIB 4.
The longitudinal follow up of NAFLD children has showed progression of the disease.37 The present study shows high prevalence of NAFLD in overweight and obese students. If not tackled in time there will be an epidemic of not only symptomatic liver disease but also of cardiovascular diseases, diabetes mellitus and cancers. The screening can be done at present by easily available serum SGPT and ultrasonography of liver. Fibroscan adds on only a small percentage and has limited role in screening. We strongly recommend screening of NAFLD in the overweight and obese children.
This is first study to our knowledge from India which evaluated prevalence of whole spectrum of NAFLD in asymptomatic overweight/obese students. The effectiveness of fibroscan for use in screening for NAFLD was assessed. Many of the factors statistically derived were different suggesting that NAFLD in our population behaves differently. The limitation of our study was the nonavailability of liver biopsy for comparison with other investigations and scores.
ConclusionNAFLD is very common in our population of asymptomatic overweight and obese children. Systolic hypertension is the only independent factor responsible for NAFLD in students. The serum triglycerides, systolic hypertension, Serum glutamic oxaloacetic transaminase, APRI were significantly higher in NAFLD group. The pediatric NAFLD may behave differently in Indian children. Fibroscan has limited role in screening. We strongly recommend screening for NAFLD in this high risk group with SGPT and ultrasonography.
Abbreviations- •
Anti-HCV: anti Hepatitis C.
- •
APRI: aspartate transaminase to Platelet Ratio Index.
- •
BMI: body Mass Index.
- •
BP: blood pressure.
- •
FIB 4 Score: fibrosis 4 score.
- •
HBsAg: hepatitis B surface antigen.
- •
HOMA IR: homeostasis model assessment estimated insulin resistance.
- •
IQR: inter quartile range.
- •
KPa: kilopascal.
- •
NAFLD: nonalcoholic fatty liver disease.
- •
PNFI: pediatric NAFLD fibrosis index.
- •
SD: standard deviation.
- •
SGPT: serum glutamic pyruvate transaminase.
- •
USG: ultrasonography.
- •
WBC: white blood cell.
Rameshwardasji Birla Smarak Kosh, Bombay Hospital Institute of Medical Science (BHIMS).
AcknowledgmentWe thank Dr. Pravir Gambhire, Dr. Ravindra Surude, Dr. Abhiram Kasbe, Mrs. Marita, Mrs. Sujata for their help in the conducting and facilitating the study.


