


Fatty liver disease (FLD) may develop in liver transplant recipients. We investigated the recipient and donor risk factors for FLD development after liver transplantation (LT).
MethodsA total of 108 liver transplant recipients (54 men [50.0%]; median age, 52 [20–68] years) treated from 2011–2020 was enrolled. Three recipients died at < 3 months as a result of infection or blood flow impairment, and were excluded from the long-term FLD study. On evaluation of 88 prospective living donors, fatty liver was observed in 21. The prevalence and risk factors for FLD and survival were evaluated.
ResultsAfter LT, 28 of 105 recipients (26.7%) developed FLD. FLD was more common in patients with a high body mass index (BMI) and dyslipidemia (both p < 0.01), primary nonalcoholic steatohepatitis (p = 0.02), after living-donor LT (p = 0.03) and everolimus (EVL) use (p = 0.08). Factors predictive of FLD included EVL use and a high BMI (hazard ratios = 3.00 and 1.34; p = 0.05 and p < 0.01, respectively). Sixteen donors lost 6.5 kg (range: 2.0–16.0 kg) of body weight prior to LT. However, there were no cases of primary non-function, which did not affect the FLD prevalence. Development of FLD did not have a negative impact on LT outcome; the 5-year survival rate was 92.6%.
ConclusionsRecipient factors were more important than donor factors for FLD onset after LT.
Fatty liver disease (FLD) is becoming widespread worldwide, and is the most common reason for liver transplantation (LT) [1]. In a Japanese national study, nonalcoholic steatohepatitis (NASH) represented 9.2% of all cases of hepatocellular disease among adult deceased donor LT (DDLT) recipients [2]. The use of living-donor LT (LDLT) to treat hepatocellular disease is increasing in Japan, where the rate of NASH increased from 2% in 2007 to 11.5% in 2017 [2]. The FLD recurrence rate is 20–30% in patients undergoing LT to treat nonalcoholic fatty liver disease (NAFLD/NASH) [3,4]. Insulinresistance, type 2 diabetes, and dyslipidemia (components of metabolic syndrome) are important risk factors for FLD development [4,5]. Additionally, in LT recipients, the use of immunosuppressive drugs can contribute to persistent FLD or de novo FLD development [4,6]. Currently, the FLD prevalence is 25% in the general population [7]. FLD of a grafted liver is thus possible. NAFLD was diagnosed in 15–51% of potential donors [8]. Assessment of steatosis is essential. Ahn et al. [9] examined 492 donors without FLD. Although some had normal liver enzyme levels and ultrasound showed no evidence of steatosis, moderate and severe steatosis were observed in 10 and 0.6% of all subjects, respectively. Grafting of a steatotic liver reduced the tolerance to ischemia and increased the risk of reperfusion injury [10]. When selecting a donor, steatosis of the liver graft must be considered; a steatosis rate < 30% may be acceptable, while a rate > 60% is unacceptable because it confers a risk of primary non-function (PNF) [11]. The use of grafts with steatosis of 30–60% is controversial. However, microvesicular steatosis does not compromise graft survival [12].
We investigated the prevalence of FLD after LT, and the recipient and donor risk factors. We explored whether donor FLD and body weight affected LT outcomes. The study adhered to the principles of the Declaration of Helsinki and the ethical guidelines of Tokyo Women's Medical University Hospital (Tokyo, Japan). The Institutional Review Board of Tokyo Women's Medical University Hospital approved the study protocol. Informed consent was obtained from all participants.
2Methods2.1Patients and study designThis observational single-center study was performed at Tokyo Women's Medical University Hospital. A total of 108 Japanese patients who underwent LT between 2011 and 2020 was enrolled. Three recipients died at < 3 months as a result of infection or blood flow impairment and were excluded from the long-term FLD study. The median follow-up period was 3.8 years (range: 0.3–9.5 years).
2.2Diagnostic criteria of FLDFLD was evaluated regularly (every 6 months) by ultrasound imaging and computed tomography (CT) and/or pathological examination. FLD was diagnosed using evidence-based clinical practice guidelines [13,14]. Briefly, ≥ 20% of steatosis can be detected by imaging methods [15]. Episodic liver biopsy was performed when blood liver enzymes were elevated, or based on evaluation of follow-up images. FLD was pathologically staged using the system of Brunt et al. [16]. We collected detailed clinical and demographic data, including age, sex, body mass index (BMI), primary hepatic disease status, and lifestyle-related disease status and complications. Patients with a BMI ≥ 25 kg/m2 were defined as obese. Bodily composition (muscle and fat volume) was determined by bioelectrical impedance analysis (BIA). Diabetes was defined using the criteria of the American Diabetes Association [17] or based on treatment with anti-diabetic agents. The diagnoses of dyslipidemia and hypertension were based on the criteria used for evaluating metabolic syndrome [17,18], or according to the use of relevant medication. Blood samples for biochemical and hematological analyses were collected at the time of FLD diagnosis or last visit after LT. The levels of serum albumin (ALB, g/dL), total bilirubin (T-BIL, mg/dL), aspartate aminotransferase (AST, U/L), alanine aminotransferase (ALT, U/L), gamma-glutamyl transferase (GGT, U/L), and platelets (PLT, × 104/μL) were measured, along with the levels of fasting glucose, hemoglobin A1c, insulin, triglycerides, total cholesterol, low-density lipoprotein cholesterol (LDL-C), high-density lipoprotein cholesterol (HDL-C), ferritin and uric acid. Studies evaluating fibrosis in patients with chronic liver disease generally employ non-invasive markers such as the fibrosis-4 (FIB-4) index [19] and AST to PLT ratio index (APRI) [20]. Insulin resistance was evaluated by homeostatic model assessment of insulin resistance (HOMA-IR).
2.3Analysis of donor factorsThe living-donor LT (LDLT) factors of interest were sex mismatch, ABO blood type mismatch, and the relationship with the recipient. The size of the liver graft was estimated by calculating the graft/recipient weight ratio (GRWR) and standard liver volume (SLV) using CT. The SLV was calculated using the following established formula [21]: liver volume (mL) = 706.2 × body surface area (m2) + 2.4. The body surface area was derived from the weight and height, as described by DuBois et al. [22]. The fluorescent dye indocyanine green (ICG) test was used to evaluate liver function [23]. One vial of ICG (25 mg; Verdye; Diagnostic Green GmbH, Aschheim, Germany) was dissolved in 50 mL of a sodium hydrochloride solution or water prior to injection, according to the manual. After fasting, each patient was intravenously injected with 0.5 mg/kg of ICG and blood samples were drawn 5, 10, and 15 min later. The ICG retention at 15 min (ICG R15) was calculated. If fatty liver was evident, liver biopsy was performed prior to LT. Donors of fibrosis status ≥ F2 were excluded. In donors with mild fibrosis, LT proceeded after a reduction of body weight and treatment of lifestyle-related diseases.
2.4Liver transplantationPatients underwent deceased-donor LT (DDLT) from brain-dead patients or LDLT from relatives, depending on the wishes of the patient and their family. All recipients were given steroids, tacrolimus (TAC), and/or mycophenolate mofetil just before or after LT. Steroid was tapered and discontinued in patients without autoimmune liver disease within 3 months of LT. The complications induced by calcineurin inhibitors (CNI) and therapeutic TAC monitoring were managed by controlling the drug concentrations. We treated recipients who were ABO donor-mismatched with rituximab (to suppress the B cell response) ≥ 2 weeks before LT, and also administered immunosuppressants starting 1 week prior to LT. In patients with a malignancy, renal dysfunction, or evidence of graft rejection, everolimus (EVL) was administered 3 months after LT.
Nutrition after LT: An intestinal tube was inserted into the intestine during LT to provide postoperative nutritional support. Enteral nutrition was delivered via an intestinal tube, beginning with 5% glucose solution at 10 mL/h (240 mL/day) and increasing to 240–960 kcal depending on the oral intake of nutrients for about 3 weeks.
2.5Statistical analysisData are presented as medians with ranges. The significance of differences was assessed using the Kruskal-Wallis test, Mann-Whitney U test, or χ2 test. The analyses were performed using SPSS software (version 25.0; SPSS Inc., Chicago, IL, USA). A p-value < 0.05 was considered to indicate statistical significance. Cumulative survival curves for patients with new-onset FLD were constructed using the Kaplan-Meier method. Univariate and multivariate Cox's regression analyses were employed to evaluate the effects of patient characteristics on the time to FLD development, and hazard ratios (HRs) with 95% confidence intervals (CIs) were calculated. We evaluated the BMI post-LT, primary NASH, dyslipidemia, and EVL use.
3Results3.1Demographics of LT recipientsA total of 108 Japanese patients diagnosed between 2011 and 2020 underwent LT; a flow diagram is shown in Fig. 1a. The median patient age was 52 years (range: 20–68 years) and 54 (50.0%) were men. The primary liver disease was hepatitis B virus (HBV) infections in 6 patients (5.6%), hepatitis C virus (HCV) infection in 13 (12.0%), alcohol-use disorder in 16 (14.8%), NASH in 11 (10.2%), primary biliary cholangitis (PBC) in 13 (12.0%), primary sclerosing cholangitis (PSC) in 10 (9.3%), autosomal-dominant polycystic kidney disease (ADPKD)/Caroli disease in 7 (6.5%)/2 (1.9%), acute liver failure in 12 (11.1%), and other conditions in 18 (16.7%). LDLT was performed in 91 (84.3%) cases and DDLT in 17 (15.7%) cases. Ten patients (9.5%) with well-controlled thyroid disease were included in this study. Three recipients died at < 3 months as a result of infection or blood flow impairment, and were excluded from the long-term FLD study.
3.2FLD after LT and comparison of patients with and without FLD recipients and b) donors. FLD, fatty liver disease; LT, liver transplantation.")
FLD was confirmed by biopsy or imaging. Over 3.8 years (range: 0.3–9.5 years) of follow-up, 28 patients developed FLD among 105 cases (Table 1). In such cases, the BMI was significantly higher than in non-FLD cases (non-FLD, 22.1 kg/m2; FLD, 24.9 kg/m2, p < 0.01). The body fat mass was significantly higher (as assessed by BIA) in FLD cases (non-FLD, 15.9 kg; FLD, 23.9 kg, p < 0.01). A lifestyle-related disease (dyslipidemia) was more common in FLD than non-FLD patients (non-FLD, n = 15 [19.5%]; FLD, n = 13 [46.4%], odds ratio [OR] = 3.58, 95% CI: 1.41-9.10, p < 0.01). Primary liver diseases (alcoholic cirrhosis and NASH) were associated with a significant increased likelihood of FLD after LT compared to other causes of chronic liver disease (OR = 2.91, 95% CI: 1.12-7.56, p = 0.02). Recurrent alcohol intake post-LT was observed in four cases (25%), half of which developed FLD. Furthermore, primary NASH patients had a significantly higher likelihood of FLD development compared to non-NASH patients (OR = 6.73, 95% CI: 1.55-29.12, p < 0.01). LDLT patients were significantly more likely to develop FLD than DDLT cases (OR = 14.90, 95% CI: 1.85-120.10, p < 0.01). In terms of immunosuppressant use, EVL-treated cases showed a trend toward a higher likelihood of developing FLD compared to the other patients (n = 17 [22.1%] vs. n = 11 [39.3%], p = 0.08). The enteral nutrition period was non-significantly longer in FLD than non-FLD cases (19.0 vs. 17.5 days, p = 0.56).
Characteristics of patients developing FLD after LT.
FLD, fatty liver disease; LT, liver transplantation; BMI, body mass index; NASH, nonalcoholic steatohepatitis; PBC, primary biliary cholangitis; PSC, primary sclerosing cholangitis; APDKD, autosomal-dominant polycystic kidney disease; LDLT, living-donor LT; DDLT, deceased-donor LT; PSL, prednisolone; TAC, tacrolimus; MMF, mycophenolate mofetil; EVL, everolimus; vs., versus. * Measured by bioelectrical impedance analysis. ** Comparison of non-FLD and FLD patients.
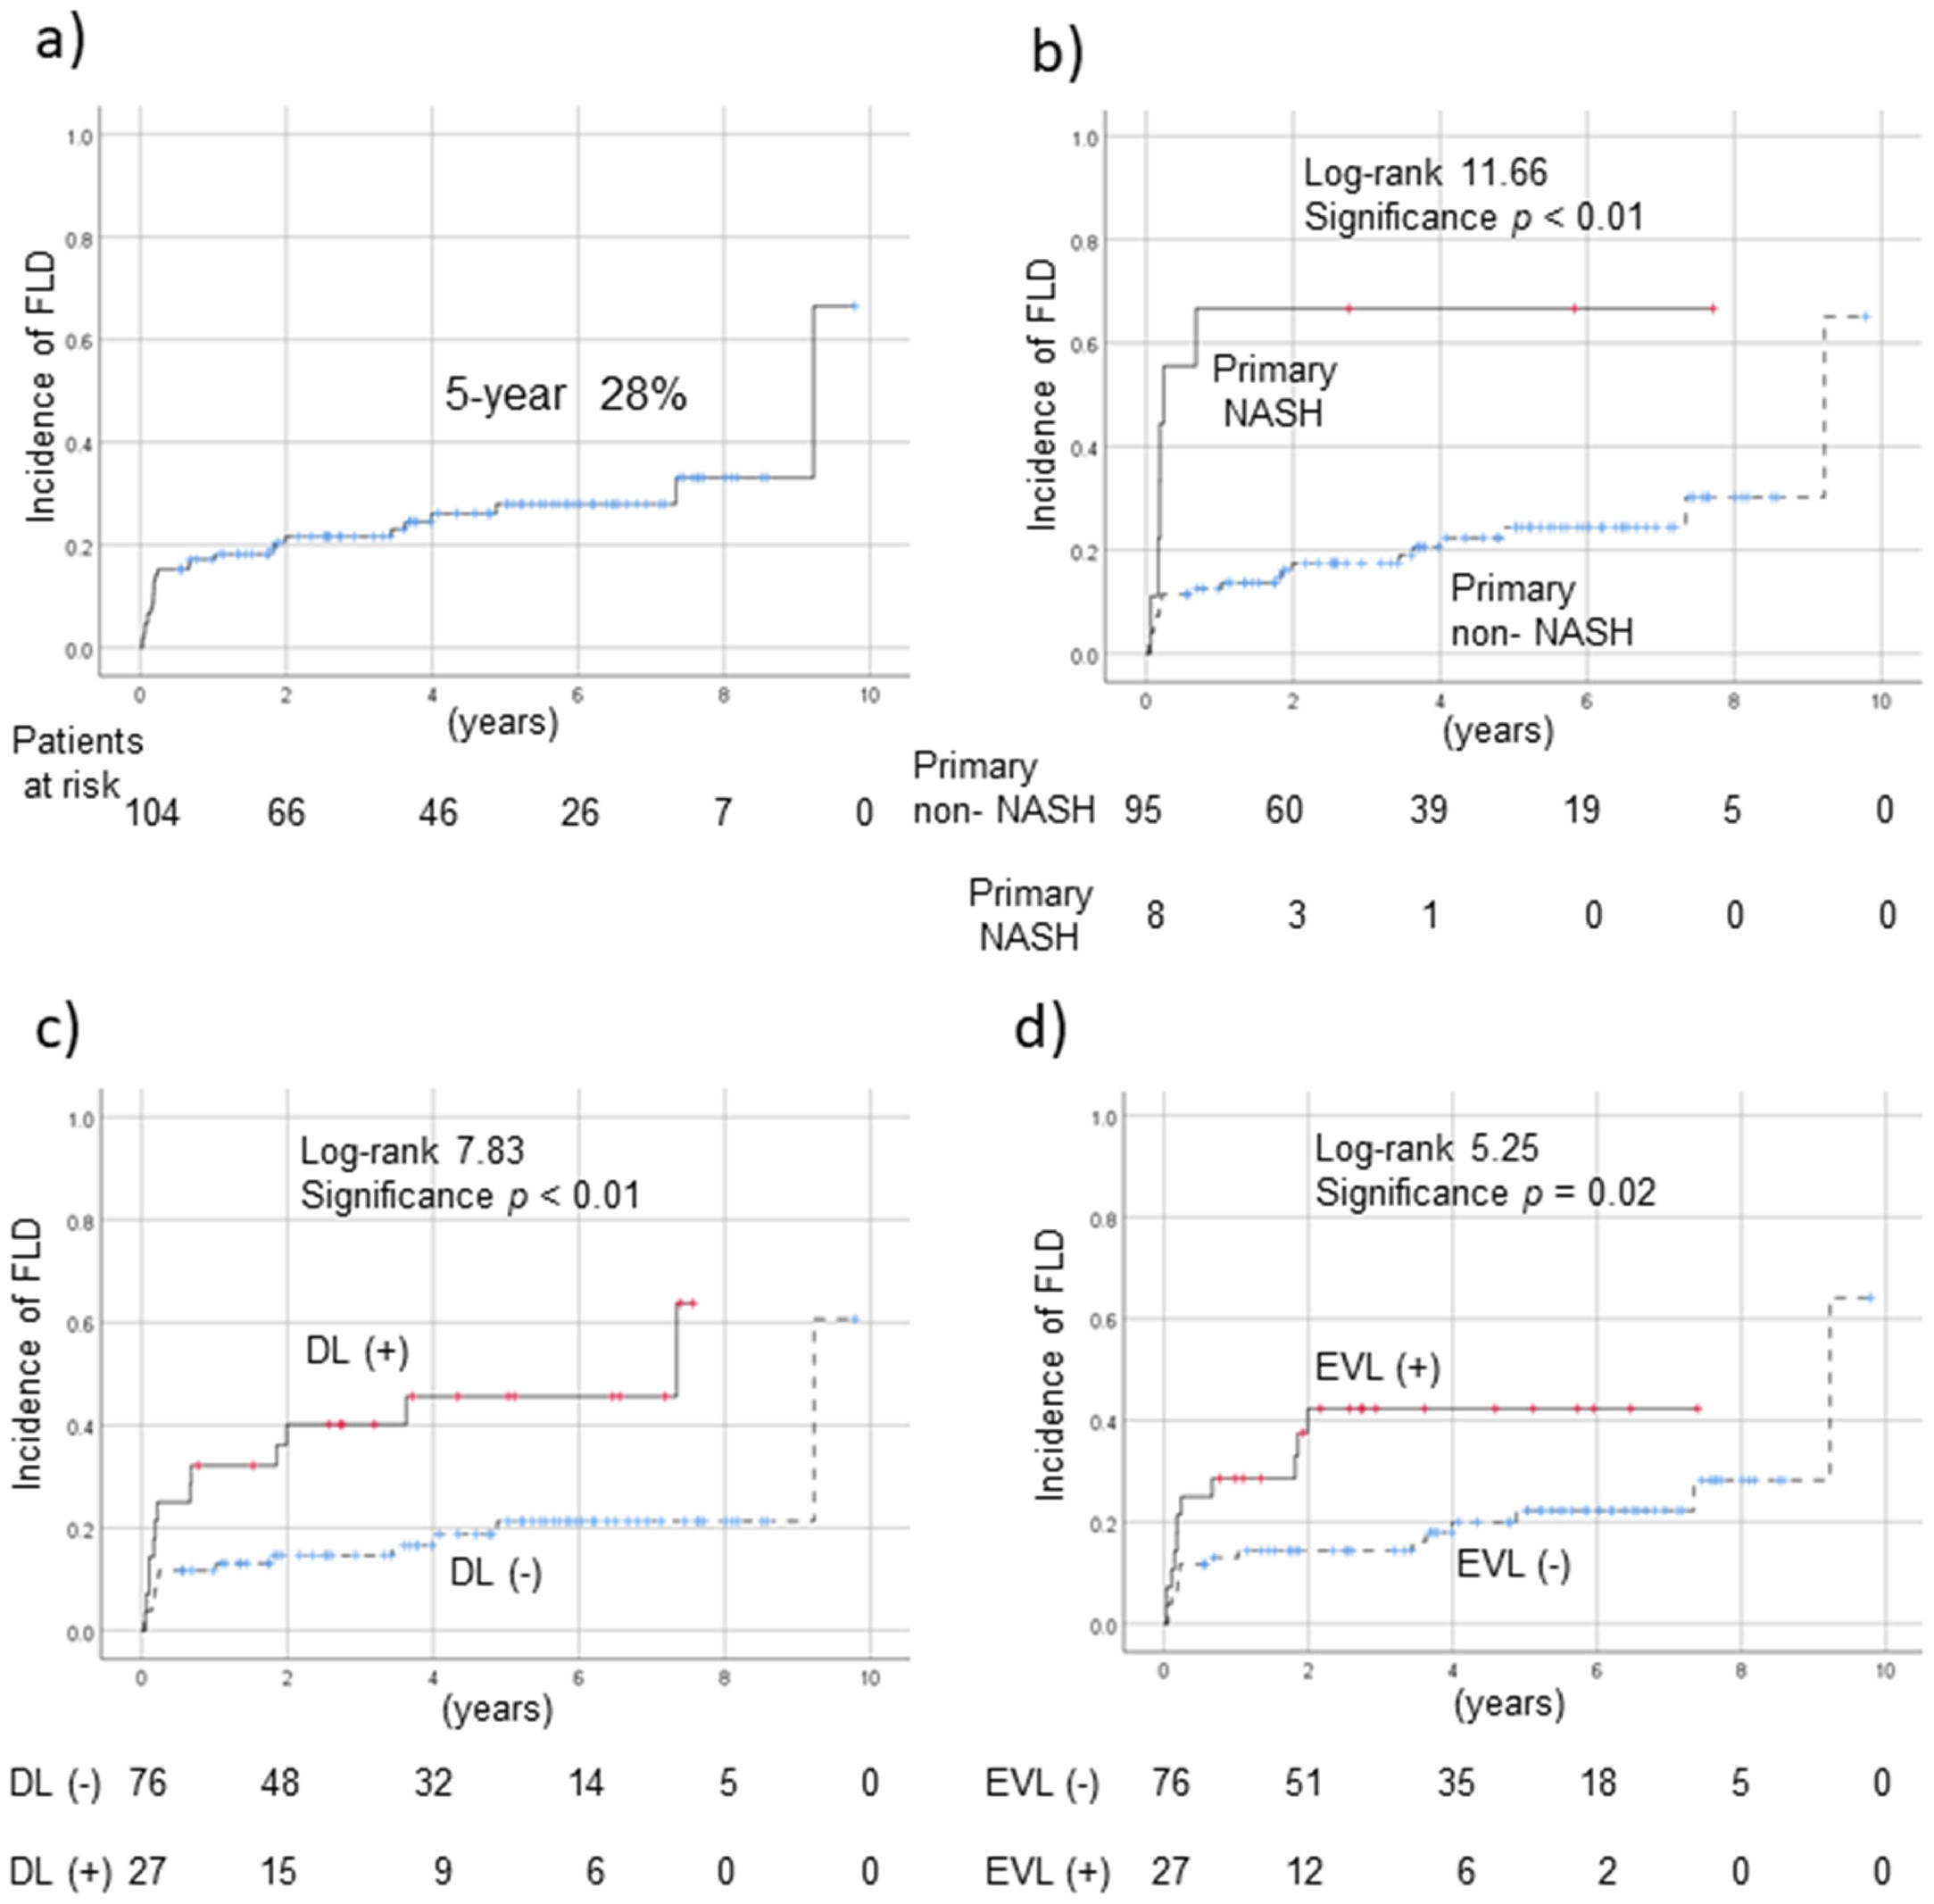
Biopsy of the grafted liver at the time of LT revealed steatosis in 27 of 84 cases (32.1%), but no PNF. New-onset FLD in recipients of donor tissue without steatosis developed in 15 of 57 cases (26.3%). Overall, 28 cases (26.7%) of FLD developed after LT; the 5-year prevalence was 28% (Fig. 2a). Use of a steatotic compared to non-steatotic donor liver did not increase the likelihood of FLD onset after LT. Patients with primary NASH (compared to no NASH; p < 0.01, Fig. 2b); dyslipidemia (compared to no dyslipidemia; p < 0.01, Fig. 2c); and use of EVL (compared to non-use; p = 0.02, Fig. 2d) were significantly more likely to develop FLD post-LT. FLD cases exhibited significantly reduced levels of serum ALB (non-FLD, 4.1 g/dL; FLD, 4.0 g/dL, p = 0.03) and HDL-cholesterol (non-FLD, 65 mg/dL; FLD, 50 mg/dL, p = 0.03, Table 2). The serum levels of AST (non-FLD, 19 U/L; FLD, 43 U/L, p < 0.01), ALT (non-FLD, 13 U/L; FLD, 55 U/L, p < 0.01) and fasting glucose (non-FLD, 97 mg/dL; FLD, 104 mg/dL, p = 0.03), and the APRI score (non-FLD, 0.32; FLD, 0.82, p < 0.01), were all significantly higher in FLD patients.
 Overall rate; (b) rate in patients with primary NASH; c) rate in dyslipidemic patients; and, d) rate in those using EVL. Cumulative survival curves of new-onset of FLD were constructed using the Kaplan-Meier method. The 5-year incidence of FLD was 28% (a). Patients with primary NASH (b), dyslipidemia (c), and EVL use (d) had a significantly increased risk of FLD post-LT compared to the other patients. EVL, everolimus; FLD, fatty liver disease; LT, liver transplantation; NASH, nonalcoholic steatohepatitis.")
FLD development rates post-LT. a) Overall rate; (b) rate in patients with primary NASH; c) rate in dyslipidemic patients; and, d) rate in those using EVL. Cumulative survival curves of new-onset of FLD were constructed using the Kaplan-Meier method. The 5-year incidence of FLD was 28% (a). Patients with primary NASH (b), dyslipidemia (c), and EVL use (d) had a significantly increased risk of FLD post-LT compared to the other patients. EVL, everolimus; FLD, fatty liver disease; LT, liver transplantation; NASH, nonalcoholic steatohepatitis.
Biochemical data obtained at FLD onset or the last visit
| Variable | Total (n = 105) | Non-FLD (n = 77) | FLD (n = 28) | p-value* |
|---|---|---|---|---|
| Albumin (g/dL) | 4.1 (2.0–4.9) | 4.1 (2.3–4.9) | 4.0 (2.0–4.6) | 0.03 |
| Total bilirubin (mg/dL) | 0.7 (0.2–33.5) | 0.7 (0.2–33.5) | 1.2 (0.4–16.3) | 0.28 |
| Aspartate aminotransferase (U/L) | 22 (9–165) | 19 (9–77) | 43 (15–165) | < 0.01 |
| Alanine transaminase (U/L) | 17 (5–356) | 13 (5–130) | 55 (11–356) | < 0.01 |
| γ-Glutamyl transferase (U/L) | 31 (6–1308) | 23 (6–1308) | 83 (12–417) | 0.20 |
| Fasting blood glucose (mg/dL) | 99 (80–187) | 97 (80–184) | 104 (81–187) | 0.03 |
| Hemoglobin A1c (%) | 5.5 (3.5–8.3) | 5.5 (4.0–8.3) | 5.8 (3.5–8.3) | 0.41 |
| IRI (μU/mL) | 6.7 (0.9–88.4) | 6.2 (0.9–66.0) | 8.2 (5.0–88.4) | 0.29 |
| Triglycerides (mg/dL) | 101 (23–307) | 98 (34–261) | 112 (23–307) | 0.55 |
| Total cholesterol (mg/dL) | 184 (30–468) | 186 (30–468) | 175 (52–259) | 0.07 |
| LDL-cholesterol (mg/dL) | 95 (7-260) | 93 (24-260) | 98 (7-179) | 0.59 |
| HDL-cholesterol (mg/dL) | 64 (5-203) | 65 (13-203) | 50 (5-125) | 0.03 |
| Ferritin (ng/mL) | 118 (8–6837) | 124 (16–6837) | 96 (8-1692) | 0.48 |
| Uric acid (mg/dL) | 5.0 (1.1-21.6) | 4.9 (1.5-9.9) | 5.7 (1.1-21.6) | 0.18 |
| Platelets (× 104/μL) | 17.3 (2.0–64.9) | 17.5 (2.0–64.9) | 16.4 (5.7–53.3) | 1.00 |
| Fibrosis-4 index | 1.51 (0.42-27.88) | 1.50 (0.42-27.88) | 1.87 (0.60-8.77) | 0.50 |
| HOMA-IR | 1.67 (0.21-22.81) | 1.43 (0.21-22.81) | 2.27 (1.15-22.05) | 0.27 |
| APRI score | 0.39 (0.10-3.84) | 0.32 (0.10-3.52) | 0.82 (0.21-3.84) | <0.01 |
IRI, insulin resistance index; LDL, low-density lipoprotein; HDL, high-density lipoprotein; HOMA-IR, homeostasis model assessment for insulin-resistance; APRI, aspartate aminotransferase to platelet ratio index.
Factors predictive of FLD after LT, as revealed by Cox's multivariate analysis, included EVL use (HR = 3.00, p = 0.05, 95% CI 0:.99–9.14) and a high BMI post-LT (HR = 1.34, p < 0.01; 95% CI: 1.16–1.55, Table 3).
Predictors of FLD after LT by Cox multivariate analysis
| Variable | Hazard ratio | 95% confidence interval | p-value |
|---|---|---|---|
| Everolimus use | 3.00 | 0.99–9.14 | 0.05 |
| Body mass index post-LT | 1.34 | 1.16–1.55 | < 0.01 |
NASH, nonalcoholic steatohepatitis; LT liver transplantation.
Factors analyzed: body mass index post-LT, dyslipidemia, primary NASH, and everolimus use.
Donor characteristics are shown in Table 4 and Fig. 1b. The median age was 46 years (range: 21–67 years) and 51 were male (58.0%). The mean BMI was 22.2 kg/m2 (range: 15.7–29.1 kg/m2); 16 (18.2%) donors were obese (BMI ≥ 25 kg/m2). The ICG R15 values did not differ significantly among the donors. The donors were parents (n = 7, 8.0%), children (n = 24, 27.3%), siblings (n = 15, 17.0%), and spouses (n = 42, 47.7%) of the recipients. The blood type compatibility status was identical in 52 patients (59.1%), compatible in 16 (18.2%), and incompatible in 20 (22.7%). The graft volume (evaluated using the GRWR and SLV ratios) did not differ significantly among the donors. In 21 cases, obesity or fatty liver changes were observed; body weight reductions ≥ 2.0 kg were achieved via dieting and prescription of dyslipidemia medication by 16 donors. Preoperatively, 10 cases underwent liver biopsy and 2 had 30–60% steatosis; the others had < 30% steatosis. There was no case with ≥ F2 fibrosis. A body weight reduction of 6.5 kg (range: 2.0–16.0 kg) was achieved over 3.5 months (range: 1.0–10.0 months) and fatty liver improved. In 10 cases, the grafted liver remained steatotic at the time of LT (so-called zero biopsy). In contrast, among the 72 donors who did not exhibit any fatty change or transaminase elevation prior to LT, 17 had steatosis at the time of zero biopsy. There was no case of PNF.
Donor characteristics
| Total(n = 88) | Non-FLD(n = 61) | FLD(n = 27) | p-value * | |
|---|---|---|---|---|
| Age at LT (years) | 46 (21-67) | 47 (21-62) | 44 (22-67) | 0.91 |
| Male sex (%) | 51 (58.0%) | 35 (57.4%) | 16 (59.3%) | 0.87 |
| BMI (kg/m2) | 22.2 (15.7-29.1) | 22.4 (15.7-29.1) | 21.5 (16.6-25.8) | 0.27 |
| Obese (BMI ≥ 25 kg/m2) | 16 (18.2%) | 13 (21.3%) | 3 (11.1%) | 0.25 |
| Body weight reduction before LT | 16 (18.2%) | 11 (18.0%) | 5 (18.5%) | 0.96 |
| Body weight reduction/ duration | - | - | 6.5 (2.0-16.0) kg/3.5 (1.0-10.0) months | |
| ICG R15 (%) | 5.9 (0.9-14.1) | 6.3 (1.4-14.1) | 4.6 (0.9-12.1) | 0.39 |
| MedicationUDCA/Vit E/ezetimibe/statin/ fibrate | 71/1/1/3/1 | 40/0/0/3/1 | 31/1/1/0/0 | 0.47 |
| Relationship (%) | 0.68 | |||
| Parent | 7 (8.0) | 6 (9.8) | 1 (3.7) | |
| Child | 24 (27.3) | 17 (27.9) | 7 (25.9) | |
| Sibling | 15 (17.0) | 9 (14.8) | 6 (22.2) | |
| Spouse | 42 (47.7) | 29 (47.5) | 13 (48.1) | |
| Blood type compatibility | 0.31 | |||
| Identical | 52 (59.1%) | 36 (59.0%) | 16 (59.3%) | |
| Compatible | 16 (18.2%) | 9 (14.8%) | 7 (25.9%) | |
| Incompatible | 20 (22.7%) | 16 (26.2%) | 4 (14.8%) | |
| GraftRight/left | 38/50 | 25/36 | 13/14 | 0.53 |
| Graft volume (mL) | 550 (315-880) | 550 (320-880) | 614 (315-714) | 0.96 |
| GRWR | 0.90 (0.52-1.76) | 0.92 (0.58-1.76) | 0.86 (0.52-1.32) | 0.09 |
| SLV ratio (%) | 46.3(28.1-82.3) | 45.9 (29.2-82.3) | 45.6 (28.1-64.3) | 0.73 |
| Pathological results of the grafted liver at the time of LT (zero biopsy)Steatosis S0/S0-1/S1/S2/S3 | 8457/11/15/1/0 | 5742/8/10/0/0 | 2715/3/5/1/0 | 0.42 |
| Activity A0/A0-1/A1/A1-2/A2/A3 | 9/25/40/6/4/0 | 6/21/25/4/4/0 | 3/4/15/2/0/0 | 0.27 |
| Fibrosis F0-1/F1/F1-2/F2//F3/F4 | 20/30/25/3/6/0/0 | 13/21/19/3/4/0/0 | 7/9/6/0/2/0/0 | 0.83 |
FLD, fatty liver disease; LT, liver transplantation; BMI, body mass index; ICG R15, indocyanine green retention at 15 min; GRWR, graft-to-recipient weight ratio; SLV, standard liver volume; UDCA, ursodeoxycholic acid; Vit E, vitamin E.
Twenty cases with liver enzyme elevations and seven with fatty liver changes were diagnosed with FLD after LT (on regular abdominal ultrasound examination). After LT, 19 cases underwent liver biopsy, and steatosis of < 30%, 30–60%, and ≥ 60% was observed in 5, 8, and 6 cases, respectively. NASH was observed in 13 cases (68.4%). Five recipients of tissue from 16 body weight-controlled donors developed FLD (31.3%). However, the prevalence of FLD after LT did not differ significantly between donors who had and had not lost weight (30.6% and 31.3% respectively, p = 0.96). The clinical courses of donor graft post-LT with preoperative body weight-controlled donors are shown in Table 5. In 2 of 6 (33.3%) cases of non-steatotic liver graft and 3 of 10 (30.0%) cases of steatotic graft, FLD progressed post-LT.
Clinical course of donor grafts post-LT with preoperative body weight-controlled donors
LT, liver transplantation.
When LT recipients with and without FLD were compared, donor age, sex, graft volume, blood type compatibility, and blood relative status showed no significantly associations with FLD development.
3.5Survival rates after FLD development and effect of donor body weight reductionThe survival rates after LT were assessed by drawing Kaplan-Meier curves. The mortality rates of patients who did and did not develop FLD post-LT did not differ significantly (Fig. 3a; the 5-year survival rate of FLD patients was 92.6% and that of non-FLD patients was 89.8%, p = 0.70). Also, the survival rates did not differ significantly when grafts from donors who did and did not lose body weight were compared (Fig. 3b).
 FLD status and b) donor body weight reduction. The mortality rates of patients with and without FLD did not differ significantly (5-year FLD and non-FLD survival rates of 92.6% and 89.8%, respectively, p = 0.70). Also, the survival rates did not differ significantly when the grafts were from donors who did and did not undergo body weight reduction. FLD, fatty liver disease; LT, liver transplantation.")
Survival rates post-LT by donor FLD status and body weight reduction. The survival rates were stratified by a) FLD status and b) donor body weight reduction. The mortality rates of patients with and without FLD did not differ significantly (5-year FLD and non-FLD survival rates of 92.6% and 89.8%, respectively, p = 0.70). Also, the survival rates did not differ significantly when the grafts were from donors who did and did not undergo body weight reduction. FLD, fatty liver disease; LT, liver transplantation.
We assessed the efficacy of steatotic liver grafts, FLD rates of LT recipients, and risk factors for FLD. The body weight reduction of donors with steatosis < 60% and mild fibrosis was not associated with PNF. Post-LT BMI, dyslipidemia, primary NASH, LDLT, and EVL use were associated with FLD development. Recipient factors influenced FLD development more than donor characteristics. Patients who use EVL and those of high BMI require particular attention. Donor body weight reduction did not affect FLD development or post-LT survival.
FLD after LT developed in 30–60% of patients followed-up for 1–5 years [24],[25]. We monitored 28 patients with FLD over 3.8 years (range: 0.3–9.5 years). The 5-year incidence of FLD was 28%, similar to that of previous studies [24],[25]. After LT, weight gain is common; amounts of 5 kg within year 1 and 10 kg within 3 years have been reported [26]. We found that although muscle volume (assessed by BIA) did not differ significantly between patients with and without FLD, fat volume was significantly higher in the former group. In Japan, oral intake post-operation is often poor; enteral nutrition in usually delivered via an intestinal tube. Such high-level alimentation enhances the growth of the grafted liver after LDLT, but may also be associated with FLD. The enteral nutrition period was non-significantly longer in FLD cases.
Dyslipidemia was more common in FLD than non-FLD cases (46.4% and 19.5% respectively). The HDL-C level was significantly lower in the FLD group. The serum fasting glucose level was significantly higher in FLD than non-FLD patients, but the type 2 diabetes rates did not differ significantly. FLD is associated with increases in the insulin resistance index (IRI) and hemoglobinA1c levels; we thus suspected subclinical glucose intolerance in FLD patients, who also had obesity and dyslipidemia.
Several prospective studies have shown that primary NASH increases the risk of FLD development/recurrence after LT [24]. In one meta-analysis, the 5-year incidences of FLD recurrence and de novo FLD were 82% and 78%, respectively. [27] We found that primary alcoholic cirrhosis and NASH significantly increased the FLD rate after LT, to 44.0% (11/25 cases). Of patients with primary NASH, 66.7% (6/9) developed FLD. The FLD incidence in those with non-primary alcoholic cirrhosis and NASH was 13.8% (11/80 cases). Primary NASH was a risk factor for FLD.
Immunosuppression after LT can trigger metabolic disorders [4],[6]. The incidence of new-onset diabetes is higher in patients on corticosteroids and TAC. EVL specifically triggers dyslipidemia. In the post-LT setting, immunosuppressants caused FLD. In the present study, 33.9% of FLD and 22.1% of non-FLD cases received EVL; thus, those receiving EVL showed a trend toward an increased risk of FLD development (p = 0.08). In Cox's multivariate analysis, EVL use and a higher BMI post-LT were risk factors for FLD development. Patsenker et al. [28] found that the free fatty acid level was higher in patients on EVL. Schieren et al. described a case of severe EVL-induced NASH [29]. In contrast, in a mouse model, EVL prevented high cholesterol-/high fructose-induced steatosis by inhibiting de novo lipogenesis [30]. In another study, EVL reduced insulin resistance and the likelihood of development of type 2 diabetes, but not the risk of steatosis, after kidney transplantation [31]. A prospective study is required to evaluate whether EVL promotes FLD development.
DDLT is rare in Japan; LDLT is more common. Because steatosis of a grafted liver promoted FLD development, fatty changes in donor livers should be assessed. In this study, the pre-LT donors underwent liver biopsy followed by body weight reduction or treatment of lifestyle-related diseases. However, some grafted livers were steatotic at the time of zero biopsy. Pathologically, three FLD donors exhibited S0-1 steatosis and five had S1 steatosis. In contrast, 8 cases of S0-1 steatosis and 10 of S1 steatosis were apparent among the non-FLD cases. When transplanting a steatotic liver, PNF is of concern, but we encountered no PNF cases. In 16 donors with fatty liver changes, the body weight was reduced by 6.5 kg (range: 2.0–16.0 kg) shortly before LT. Recipient FLD developed in five cases (31.3%) receiving body weight-reduced donor liver grafts. Of recipients whose donors did not undergo body weight control, 22 (30.6%) developed FLD. Thus, the likelihood of FLD development was not significantly associated with donor weight. Moreover, of the 57 patients without FLD at the time of zero biopsy, FLD developed in 15 (26.3%). We speculate that recipient factors were more important than donor factors in terms of FLD onset. Therefore, subjects with both steatosis and mild fibrosis (< F2) can be donors. In one case with S2 steatosis, PNF was not observed; however, the patient died of cytomegalovirus infection. Although it is not clear if FLD was associated with the death of this patient, donor body weight control and reduced graft steatosis remain important.
In terms of overall survival, Malik et al. [32] found that obesity (BMI > 30 kg/m2), type 2 diabetes, hypertension, and age > 60 years were associated with a 1-year mortality rate < 50%. The main causes of death were reported as sepsis and cardiovascular disease [33]. Allograft steatosis did not affect the post-LT outcomes [34]. The survival rate was not affected by FLD progression, similar to a previous study [33]. Moreover, reduction of donor body weight did not affect the post-LT outcomes. The 5-year survival rates of our FLD and non-FLD patients did not differ. However, in FLD patients, the APRI was significantly higher, and the serum ALB level significantly lower, than in non-FLD patients. Longer-term follow-up is essential to evaluate whether FLD affects outcomes.
This study had some limitations. First, it used a single-center observational design, and not all available pathological evaluations were performed. FLD was diagnosed via episodic liver biopsy when blood liver enzymes were elevated, or using follow-up images. Protocoled biopsy is required to detect asymptomatic FLD. Furthermore, longer-term follow-up is necessary. A Japanese national study reported that, among 1,792 cases of hepatocellular diseases, 7.1% (n = 127) were LDLT of NASH etiology, compared to 2.2% of all adult LT cases (n = 5,741) [2]. An HCV etiology was common. FLD development post-LT might be influenced by etiology.
We showed that the use of steatotic living donor liver grafts and donor steatosis might affect the likelihood of post-transplant FLD . We used steatotic livers for LDLT, because we performed transplants together with dietary intervention and/or drug treatment for steatosis. Although we do not generally recommend the use of steatotic grafts, we used a fatty liver graft for compelling clinical reasons.
5ConclusionsFLD was observed in 28% of LT recipients followed-up for 5 years. Recipient factors were more important than donor factors in terms of FLD onset. If a candidate donor's liver is fatty (steatosis < 60%) but liver fibrosis is not severe (< F2), they can be a donor after appropriate management.
Data availabilityThe datasets used and/or analyzed in this study are available from the corresponding author upon reasonable request.
Specific author contributionsConceptualization: TK; Data curation: KH and TK; Formal analysis: TK; Investigation: All authors; Methodology: TK and KT; Project administration: KT; Supervision: KT; Writing - original draft: TK; Writing - review & editing: KH, TK and KT. All authors have read and approved the final manuscript. All authors agree to be accountable for all aspects of the study; questions related to the accuracy or integrity of any part of the study will be addressed as appropriate.


