


Recent findings pointed out that even low-risk esophageal varices (EVs) are markers of severe prognosis. Accordingly, we analyzed spleen stiffness (SS) as a non-invasive method to predict EVs of any grade in a cohort of patients with compensated liver cirrhosis.
MethodWe measured SS and liver stiffness (LS) using point-Shear-Wave Elastography (pSWE) with Philips Affiniti 70 system in 210 cirrhotic patients who had undergone endoscopic screening for EVs. We compared SS and LS predictive capability for EVs of any grade.
ResultsSS was higher in cirrhotic patients with EVs if compared to patients without EVs (p<0.001). The cut-off analysis detected 31kPa (100% sensitivity and negative predictive value) as the value to rule-out EVs and 69kPa (100% specificity and positive predictive value) to rule-in EVs. Besides, we developed the Spleen Stiffness Probability Index (SSPI), that can provide a probability of presence/absence of EVs. SSPI was the best model according to all discriminative and calibration metrics (AIC=120, BIC=127, AUROC=0.95, Pseudo-R2=0.74). SS demonstrated higher correlation with spleen bipolar diameter and spleen surface (r=0.52/0.55) if compared to LS (r=0.30/0.25) – and with platelet count as well (r=0.67 vs r=0.4).
ConclusionSS showed significantly higher performance than other parameters, proving to be the best non-invasive test in the screening of EVs: by directly applying SS cut-off of 31kPa, our department could have safely avoided endoscopy in 36% of patients. Despite cut-off analyses, it was possible to create a probability model that could further stratify low-risk from high-risk patients (for any grade of EVs).
Portal hypertension (PH) is a common complication of liver cirrhosis. The increase in portal pressure beyond the threshold of 10mmHg (clinically significant portal hypertension, CSPH) defines a milestone in the natural history of liver cirrhosis, increasing the risk of esophageal varices (EVs) and manifestation of decompensating events (such as ascites, variceal hemorrhage, and hepatic encephalopathy) that mark the transition to a stage of liver disease characterized by a significantly reduced life expectancy [1,2]. Historically, EVs were diagnosed in nearly 50% of patients with cirrhosis. Nowadays, the advent of direct antiviral agents (DAA), which allowed successful eradication of hepatitis C virus (HCV), together with the high sensitivity of liver elastography in classifying liver fibrosis, has drastically changed the epidemiological scenario. However, EVs development depends on the severity of liver disease [3] and the degree of portal pressure [4,5], therefore appropriate risk-stratification is assessed by the two invasive gold-standards – hepatic vein pressure gradient (HVPG) measurements [6] and esophagogastroduodenoscopy (EGD) – which allow proper medical/endoscopic procedures in patients with high-risk EVs (HRVs), thus reducing the risk of hemorrhages. However, the invasive nature of both EGD and HVPG leads to significant patient discomfort and increased healthcare costs. As a result, there is a great interest in developing non-invasive techniques (NITs) with acceptable diagnostic accuracy to predict the occurrence and size of EVs, thus avoiding invasive methods in low-risk patients. The appropriate prescription of screening endoscopy in cirrhotic patients has been a matter of discussion in the last three decades [7]. Several serological and radiological parameters have been proposed to predict EVs such as liver stiffness (LS), platelet count to spleen diameter ratio (PSR) [8], and liver stiffness-spleen size to platelet ratio risk score (LSPS) [9]. In 2015, the Baveno VI consensus affirmed the importance of NITs in the screening of EVs, with particular emphasis on LS, concluding that individuals with LS<20kPa and platelet count>150g/L were considered unlikely to have HRVs (<5%) [10]. To date, several studies validated these criteria, confirming that following Baveno VI cut-offs could accurately classify 98–100% of patients who can safely avoid endoscopy [11,12]. A significant limitation of these criteria corresponds to the considerably low number of spared EGD (15–25%) [13,14], which has been improved by selecting different LS and platelet count thresholds [14–16]. Since 2010, spleen stiffness (SS) has been studied as a more performant predictor of PH [17], and it was recently combined with Baveno VI criteria, allowing to spare EGD in 44% of patients with a rate of missed HRVs<5% [18].
Most of the studies which investigated liver and spleen stiffness focused on its discriminatory role in HRVs and performed stiffness measurements using transient elastography (TE) machines in patients with ongoing liver injuring factors. That being said, according to both European and American guidelines, EGD is still recommended in the follow-up of compensated cirrhotic patients with a different time interval (from one to three years) according to (i) previous detection of EVs and (ii) ongoing/quiescent liver injury [10,19]. The continuous rely on EGD creates a never-ending cycle of invasive diagnostic routine during the lifetime of the cirrhotic patient.
The present study aimed at evaluating the predictive capability of SS on EVs (of any grade), by the development of a probability model in patients with compensated cirrhosis and without ongoing factors promoting liver injury (i.e., alcohol abuse, active HCV infection, etc). Besides, we wanted to compare SS to other NITs. We already assessed the reproducibility elsewhere [20–24].
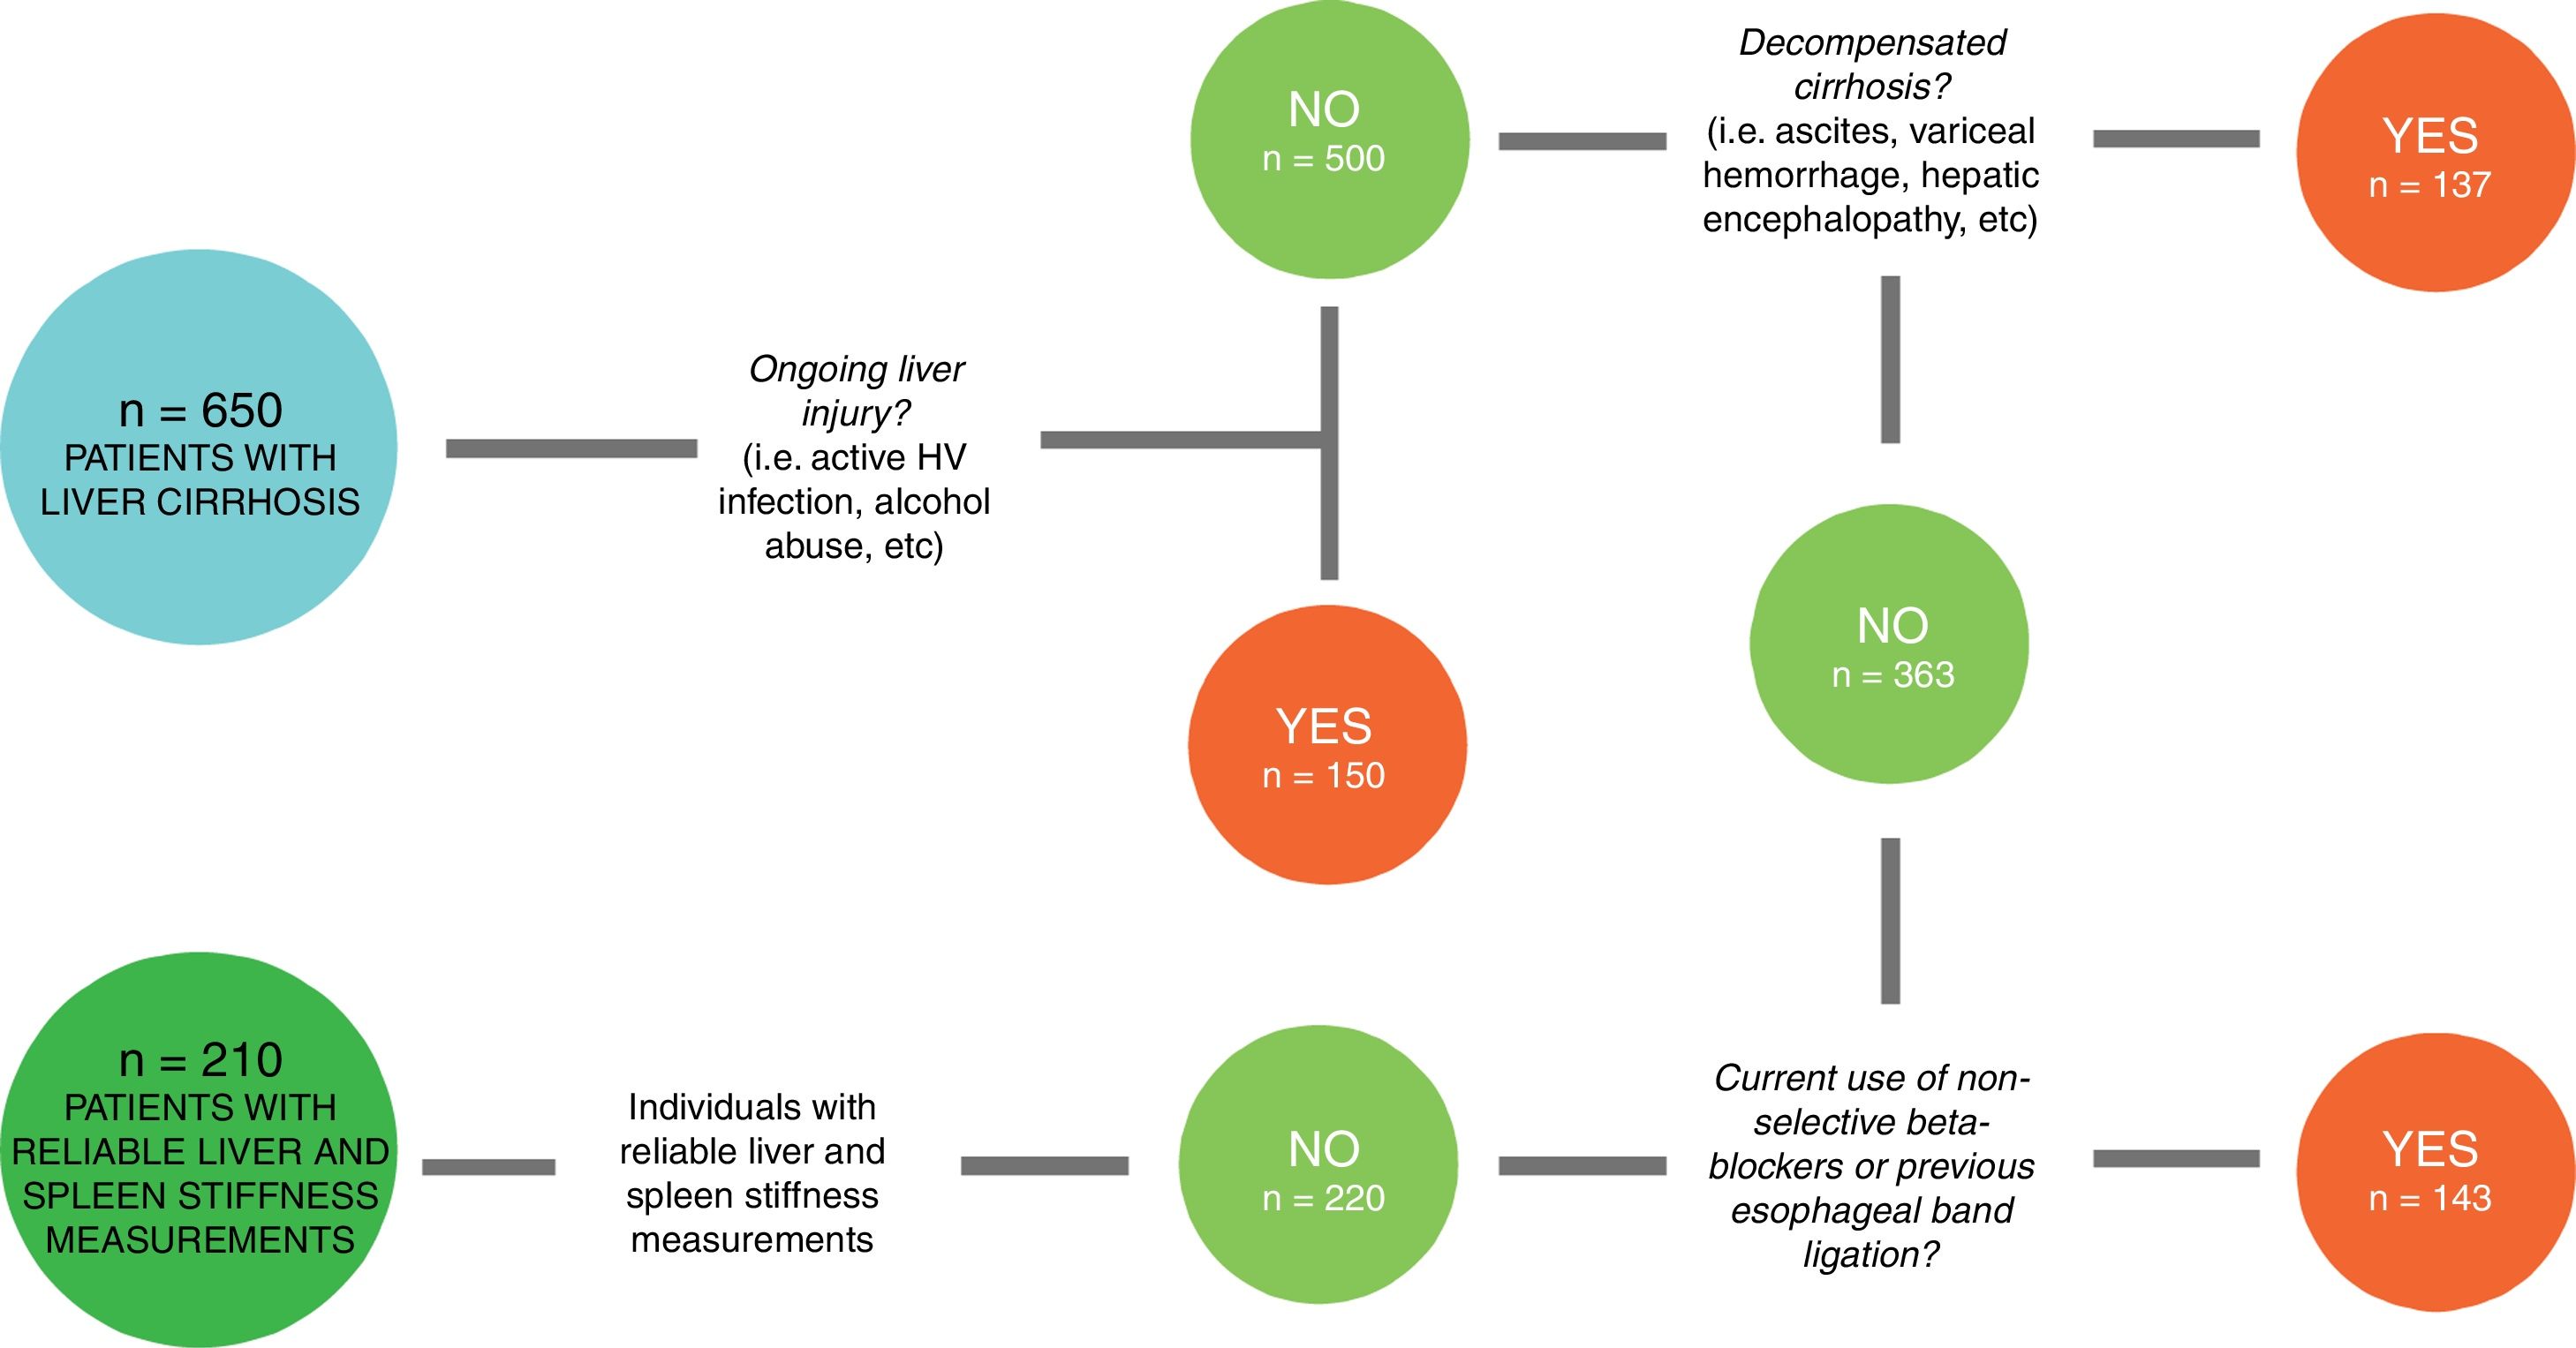
2Patients and methods2.1Study designIn this cross-sectional study, we enrolled consecutive patients with a diagnosis of liver cirrhosis referred to the Department of Health, Medical, and Surgical Sciences of the University of Trieste (Italy) and evaluated at the Liver Clinic between January 2016 and December 2018. From an original cohort of 650 individuals with liver cirrhosis, only 220 (Fig. 1) patients with compensated advanced chronic liver disease (cACLD) met the enrollment criteria. Both liver and spleen elastography measures were reliable in 210 patients, 84 of whom (40%) had EVs. We had previously measured SS in a control group of 100 healthy individuals, where we also assessed SS inter-operator agreement [21,22].
 without previous history of decompensating events. Then, we chose patients without therapeutic confounding factors (such as current use of non-selective beta-blockers and previous esophageal band ligation), that could alter spleen stiffness values. From this group of 220 patients, 210 had reliable liver and spleen stiffness measurements.")
From the original cohort of 650 patients diagnosed with liver cirrhosis, 150 had ongoing liver injury. From the remaining 500, we selected the ones (363) without previous history of decompensating events. Then, we chose patients without therapeutic confounding factors (such as current use of non-selective beta-blockers and previous esophageal band ligation), that could alter spleen stiffness values. From this group of 220 patients, 210 had reliable liver and spleen stiffness measurements.
We selected adult patients with liver cirrhosis, whose diagnosis was confirmed by imaging, elastography and/or histological evaluation and blood tests. As per the standard diagnostic procedure, the patients underwent an EGD with an evaluation of the presence/absence of esophageal and/or gastric varices and congestive gastropathy. Patients also underwent an elastographic examination of the liver and spleen with a maximum interval of 6 months from the endoscopy. Only patients with liver stiffness>11.34kPa [25], a value compatible with severe fibrosis (F4 according to METAVIR), were included.
2.3Exclusion criteriaPatients with no informed consent were categorically excluded. We also excluded pregnant women, patients with current alcohol abuse, patients with ongoing HCV infection (or SVR<12 months), patients with presence of decompensating events (such as hepatic encephalopathy, variceal hemorrhage, ascites, and spontaneous bacterial peritonitis), previous endoscopic EVs banding ligation, ongoing intake of non-selective beta-blockers (NSBB), history of portal vein thrombosis, placement of transjugular intrahepatic portosystemic shunt (TIPS), non-cirrhotic causes of PH, and current/recent diagnosis of hepatocellular carcinoma [26].
2.4Ultrasonographic and elastographic examinationA complete evaluation of the liver and splenic-portal axis was performed using a Philips Affiniti 70 ultrasonography system with a 1–5MHz convex probe. The sampling of the portal flow was performed at the hepatic hilum level with a probe positioned in the intercostal window, and with the acquisition of at least three values. The portal caliber was evaluated at the level between the portal vein and the hepatic artery with the probe positioned at the epigastric-sub-focal level. The portal vein diameter was expressed in cm, while the portal vein flow velocity was expressed in cm/s. The spleen was evaluated in the supine position patient via the intercostal window and trying to acquire the broadest possible scan that included the splenic hilum. Both the bipolar spleen diameter (expressed in cm) and the splenic area (expressed in cm2) were measured at the organ hilum.
2.5Elastographic examinationIn order to avoid confounding factors in stiffness measurement, the patients had to arrive while fasting for at least 3h and with no caffeine intake during the previous hour [27,28].
Liver and spleen elastography were performed with the same instrument used for ultrasonography, operating the ElastPQ evaluation protocol. The machine converted the measure from m/s to kPa, with the formula: E=ρcs2 – where E is the Young Modulus (kPa), ρ is the density of the tissue (kg/m3), and cs is the shear wave speed (m/s). All measures were acquired by an experienced operator with four years of experience in ultrasound and elastography.
Patients were positioned in supine decubitus with the right arm (liver) or left arm (spleen) in maximal abduction in order to increase the intercostal acoustic window. The region of interest (ROI) was placed between the VII and VIII segments at least 1.5cm from the hepatic capsule (LS) and at the splenic hilum or lower pole at least 1cm from the splenic capsule (SS). The ROI was accurately located in an area without large liver vessels, bile ducts, and rib shadows. During the acquisition, the patient was requested to hold his/her breath for 5s. All measures obtained after a deep inspiration; maximal expirations and Valsalva maneuver were discarded [29,30]. In 10% of cases, breath-hold was practiced with the patient prior to initiating elastography.
Ten different valid elastographic measurements were obtained in all subjects both in the liver and in the spleen, and the median value was used. The measure obtained was acquired only if its standard deviation was <30%. According to Boursier et al. stiffness measurements were considered poorly reliable when they showed an interquartile (IQR)/median (M) ratio≥0.35; reliable when they showed 0.15≤IQR/M<0.35 and very reliable if IQR/M<0.15 [31]. We defined “technical failure” the impossibility to obtain any value or an IQR/M≥0.35 and selected values with an IQR/M<0.30.
2.6EsophagogastroduodenoscopyAll patients underwent a complete endoscopic examination conducted up to the second duodenal portion. The esophagus was evaluated in search of esophageal varices, which, if present, were classified with the Beppu classification (1981) [32]. In detail, the localization (L), the shape, and size (F), the color (C), the presence or absence of red color signs (RS), and the presence or absence of esophagitis (E) were evaluated. The gastric chamber, also evaluated in retroversion with adequate visualization of the fundus and cardiac region, was inspected for signs of congestive gastropathy and/or gastric varices.
2.7Clinical evaluation of the patient and laboratory testsEach patient underwent blood tests and a complete physical examination at the time of the visit. We evaluated: weight, height, body mass index (BMI), etiology of cirrhosis, clinical signs of liver disease decompensation (presence/absence of ascites, and hepatic encephalopathy). Subsequently, the following blood laboratory values were collected: AST, ALT, GGT, creatinine, total bilirubin, albumin, INR, and platelet count. The following scores were then calculated: Model for End-stage Liver Disease (MELD), Child–Pugh (CP), AST to Platelet Ratio Index (APRI), PSR, LSPS.
2.8Statistical analysisMost continuous variables were not Gaussian-distributed, and all are reported as median (50th percentile) and interquartile range (IQR, 25th and 75th percentiles). Discrete variables are reported as the number and proportion of subjects with the characteristic of interest.
Between-group comparisons of discrete variables were performed using Pearson's Chi-square test and those of continuous variables using median regression [33]. The association between varices (discrete; 0=no, 1=yes) and the four continuous predictors of interest (liver stiffness, spleen stiffness, spleen diameter and platelets) was evaluated using univariable logistic regression [34].
We used univariable fractional polynomials to test whether the logits of the predictors were linear and transformed both liver stiffness and spleen stiffness using an inverse square root transformation to make their logits linear [35]. To evaluate the collinearity of SS, LS, spleen size, and platelet count, correlations were assessed using the Spearman rank-order correlation coefficient [36].
We compared models using Akaike information criterion (AIC) and the Bayesian information criterion (BIC) and calculated Nagelkerke pseudo-R2 and the area under the receiver-operating characteristic curve (AUROC). The diagnostic accuracy was calculated using sensitivity, specificity, positive predictive value (PPV), negative predictive value (NPV), accuracy, positive likelihood ratio (+LR), and negative likelihood ratio (−LR). Optimal cut-off values were chosen to safely rule-out patients with EVs and HRVs for screening purposes. Accordingly, we selected SS and LS cut-off threshold with maximal sensitivity and NPV and a minimal −LR.
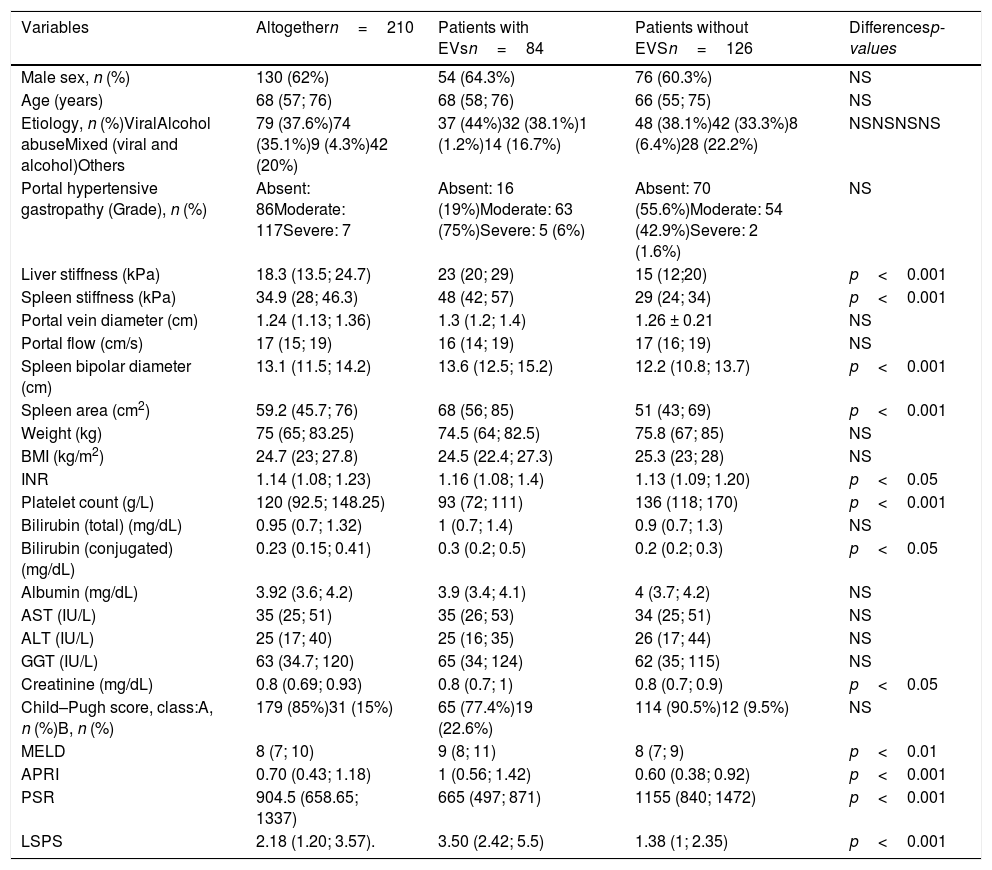
3ResultsOne hundred and thirty (62%) out of 210 patients were male. The predominant etiologies of the liver disease were related to viral infection (n=79, 36%) and alcohol abuse (n=74, 35%). One hundred and seventy-nine patients were CP-A (85%), 31 were CP-B (15%), and the median (IQR) MELD value was 8 (7–10). The median (IQR) LS median was 18.3kPa (13.50–24.70), the median (IQR) SS was 34.9kPa (28–46.3). The median (IQR) APRI score was 0.70 (0.43–1.18), the median (IQR) PSR score was 904.5 (658.65–1337), and LSPS score was 2.18 (1.20–3.57). The patients included in the study were divided into two sub-groups: with (n=84, 40%) or without (n=126, 60%) EVs. Between patients with EVs, 72 (85.7%) had low-risk varices, and 12 (14.3%) had high-risk varices. The median (IQR) time-interval between EGD and LS/SS measurement was 2.5 months (1;3). Statistically significant between-group differences were detected in INR, conjugated bilirubin and creatinine (p<0.05); MELD (p<0.01); LS, SS, spleen bipolar diameter, spleen area, platelet count, APRI, PSR, and LSPS (p<0.001) (Table 1).
Clinical, biochemical and elastographic characteristics of the enrolled population (n=210). Continuous variables are reported by median and interquartile ranges (IQR). Patients are stratified by presence (n=84) and absence (n=126) of Esophageal Varices.
| Variables | Altogethern=210 | Patients with EVsn=84 | Patients without EVSn=126 | Differencesp-values |
|---|---|---|---|---|
| Male sex, n (%) | 130 (62%) | 54 (64.3%) | 76 (60.3%) | NS |
| Age (years) | 68 (57; 76) | 68 (58; 76) | 66 (55; 75) | NS |
| Etiology, n (%)ViralAlcohol abuseMixed (viral and alcohol)Others | 79 (37.6%)74 (35.1%)9 (4.3%)42 (20%) | 37 (44%)32 (38.1%)1 (1.2%)14 (16.7%) | 48 (38.1%)42 (33.3%)8 (6.4%)28 (22.2%) | NSNSNSNS |
| Portal hypertensive gastropathy (Grade), n (%) | Absent: 86Moderate: 117Severe: 7 | Absent: 16 (19%)Moderate: 63 (75%)Severe: 5 (6%) | Absent: 70 (55.6%)Moderate: 54 (42.9%)Severe: 2 (1.6%) | NS |
| Liver stiffness (kPa) | 18.3 (13.5; 24.7) | 23 (20; 29) | 15 (12;20) | p<0.001 |
| Spleen stiffness (kPa) | 34.9 (28; 46.3) | 48 (42; 57) | 29 (24; 34) | p<0.001 |
| Portal vein diameter (cm) | 1.24 (1.13; 1.36) | 1.3 (1.2; 1.4) | 1.26 ± 0.21 | NS |
| Portal flow (cm/s) | 17 (15; 19) | 16 (14; 19) | 17 (16; 19) | NS |
| Spleen bipolar diameter (cm) | 13.1 (11.5; 14.2) | 13.6 (12.5; 15.2) | 12.2 (10.8; 13.7) | p<0.001 |
| Spleen area (cm2) | 59.2 (45.7; 76) | 68 (56; 85) | 51 (43; 69) | p<0.001 |
| Weight (kg) | 75 (65; 83.25) | 74.5 (64; 82.5) | 75.8 (67; 85) | NS |
| BMI (kg/m2) | 24.7 (23; 27.8) | 24.5 (22.4; 27.3) | 25.3 (23; 28) | NS |
| INR | 1.14 (1.08; 1.23) | 1.16 (1.08; 1.4) | 1.13 (1.09; 1.20) | p<0.05 |
| Platelet count (g/L) | 120 (92.5; 148.25) | 93 (72; 111) | 136 (118; 170) | p<0.001 |
| Bilirubin (total) (mg/dL) | 0.95 (0.7; 1.32) | 1 (0.7; 1.4) | 0.9 (0.7; 1.3) | NS |
| Bilirubin (conjugated) (mg/dL) | 0.23 (0.15; 0.41) | 0.3 (0.2; 0.5) | 0.2 (0.2; 0.3) | p<0.05 |
| Albumin (mg/dL) | 3.92 (3.6; 4.2) | 3.9 (3.4; 4.1) | 4 (3.7; 4.2) | NS |
| AST (IU/L) | 35 (25; 51) | 35 (26; 53) | 34 (25; 51) | NS |
| ALT (IU/L) | 25 (17; 40) | 25 (16; 35) | 26 (17; 44) | NS |
| GGT (IU/L) | 63 (34.7; 120) | 65 (34; 124) | 62 (35; 115) | NS |
| Creatinine (mg/dL) | 0.8 (0.69; 0.93) | 0.8 (0.7; 1) | 0.8 (0.7; 0.9) | p<0.05 |
| Child–Pugh score, class:A, n (%)B, n (%) | 179 (85%)31 (15%) | 65 (77.4%)19 (22.6%) | 114 (90.5%)12 (9.5%) | NS |
| MELD | 8 (7; 10) | 9 (8; 11) | 8 (7; 9) | p<0.01 |
| APRI | 0.70 (0.43; 1.18) | 1 (0.56; 1.42) | 0.60 (0.38; 0.92) | p<0.001 |
| PSR | 904.5 (658.65; 1337) | 665 (497; 871) | 1155 (840; 1472) | p<0.001 |
| LSPS | 2.18 (1.20; 3.57). | 3.50 (2.42; 5.5) | 1.38 (1; 2.35) | p<0.001 |
Statistically significant differences are expressed by two-tailed p-values. NS: not significant.
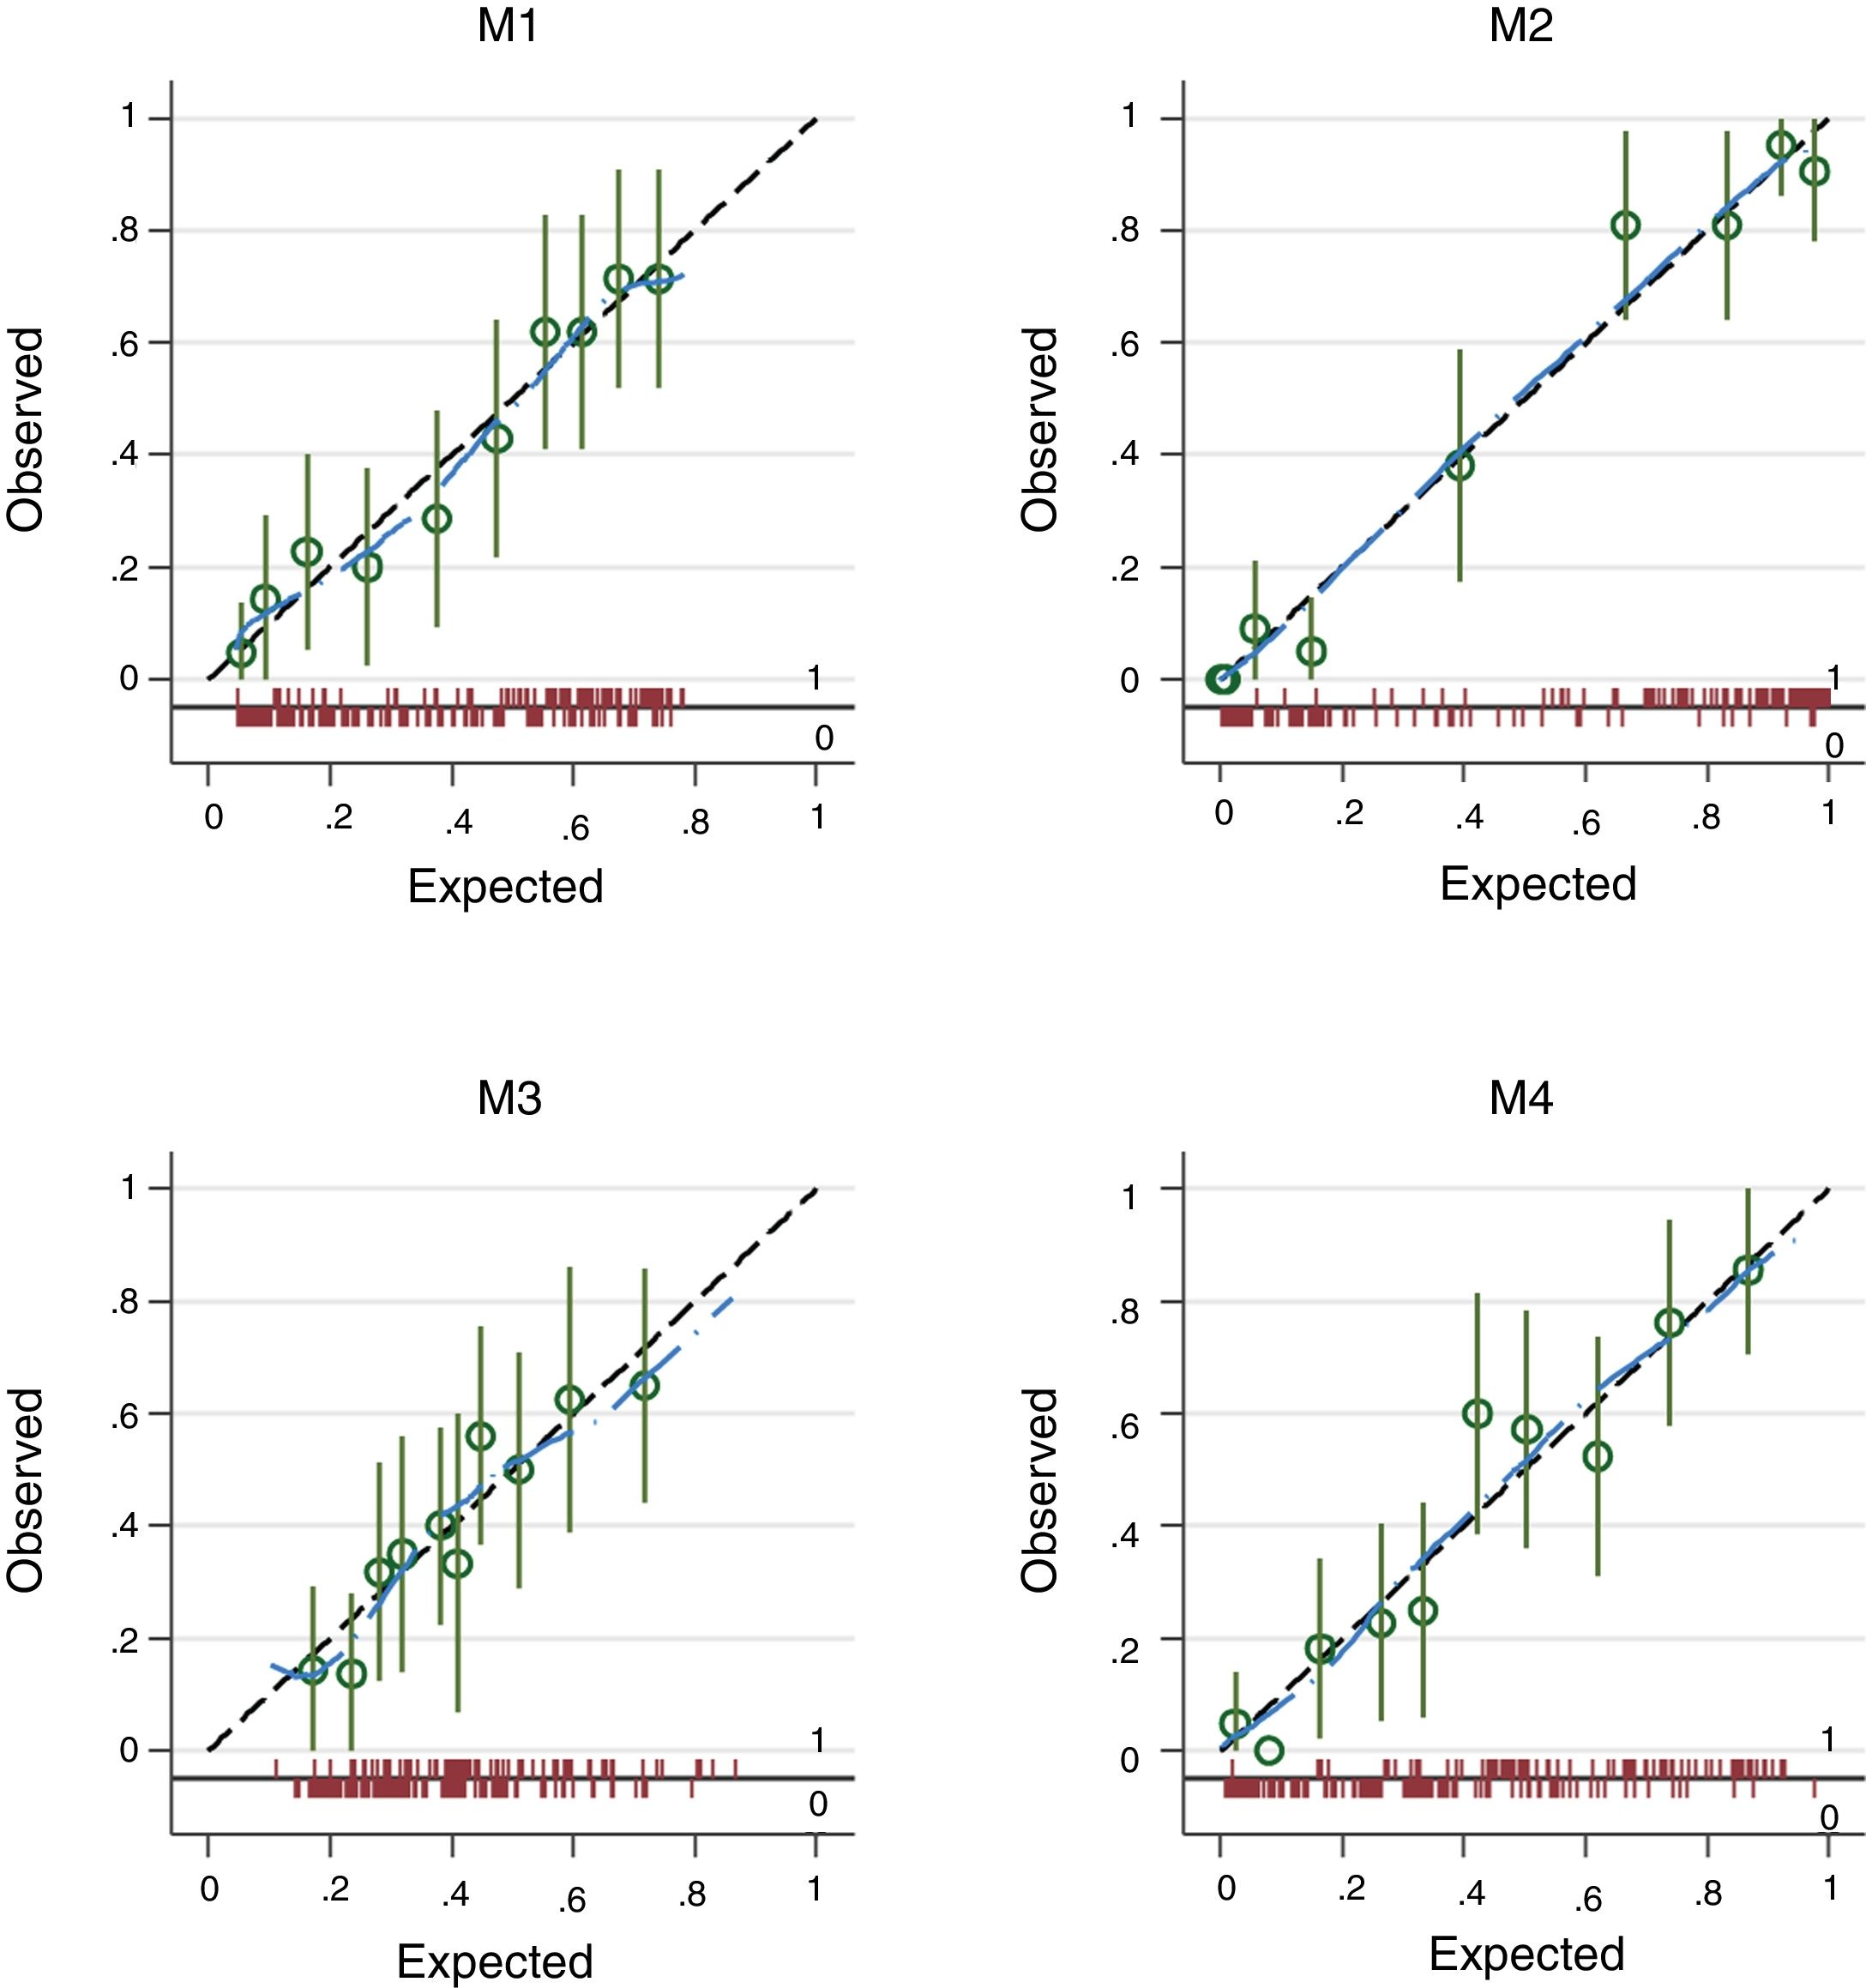
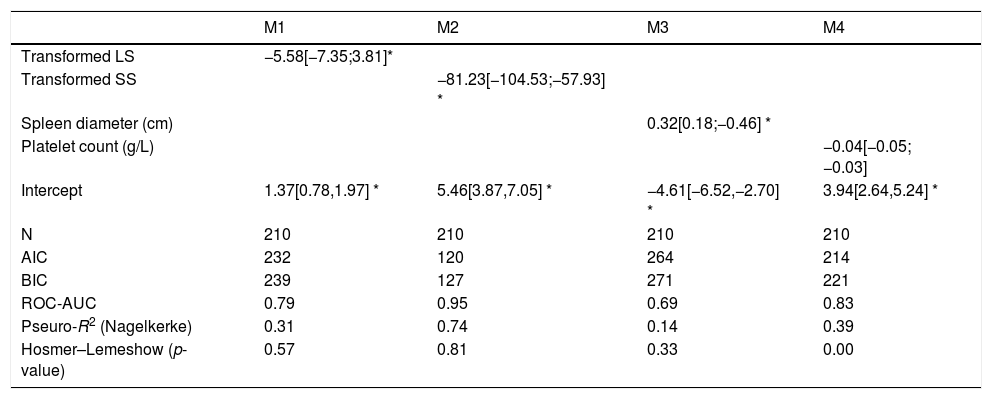
The four logistic regression models (M1 to M4) used to evaluate the association between varices (0=no; 1=yes) and transformed liver stiffness (M1), transformed spleen stiffness (M2), spleen diameter (M3) and platelets (M4) are given in Table 2. M2, based on transformed spleen stiffness, was the best model according to all discriminative and calibration metrics (lowest AIC, lowest BIC, highest AUROC, and higher Pseudo-R2).
To obtain transformed liver stiffness calculate: x=liver stiffness (KPa)/10 and then transformed liver stiffness as x−2. To obtain transformed spleen stiffness calculate: x=spleen stiffness (KPa)/10 and then transformed spleen stiffness as x−2. M#=model number #; N=number of subjects; AIC=Akaike information criterion; BIC=Bayesian information criterion; ROC-AUC=area under the ROC-curve; Nagelkerke R2=pseudo-R2. Values are regression coefficients from logistic regression and 95% confidence intervals [in brackets]. Values are logistic regression coefficients and 95%CI.
| M1 | M2 | M3 | M4 | |
|---|---|---|---|---|
| Transformed LS | −5.58[−7.35;3.81]* | |||
| Transformed SS | −81.23[−104.53;−57.93] * | |||
| Spleen diameter (cm) | 0.32[0.18;−0.46] * | |||
| Platelet count (g/L) | −0.04[−0.05;−0.03] | |||
| Intercept | 1.37[0.78,1.97] * | 5.46[3.87,7.05] * | −4.61[−6.52,−2.70] * | 3.94[2.64,5.24] * |
| N | 210 | 210 | 210 | 210 |
| AIC | 232 | 120 | 264 | 214 |
| BIC | 239 | 127 | 271 | 221 |
| ROC-AUC | 0.79 | 0.95 | 0.69 | 0.83 |
| Pseuro-R2 (Nagelkerke) | 0.31 | 0.74 | 0.14 | 0.39 |
| Hosmer–Lemeshow (p-value) | 0.57 | 0.81 | 0.33 | 0.00 |
The plots in Fig. 2 give the observed vs. the expected probability of varices as estimated from models M1 to M4. Calibration is plotted across ten percentiles (deciles of risk). The spike plot at the bottom of the graph plots the distribution of events (1=presence of varices) and non-events (0=absence of varices) and a lowess smoother is superimposed on the graph to allow a rough assessment of the calibration at the individual level.
3.2Spleen stiffness and non-events (0=absence of varices).")
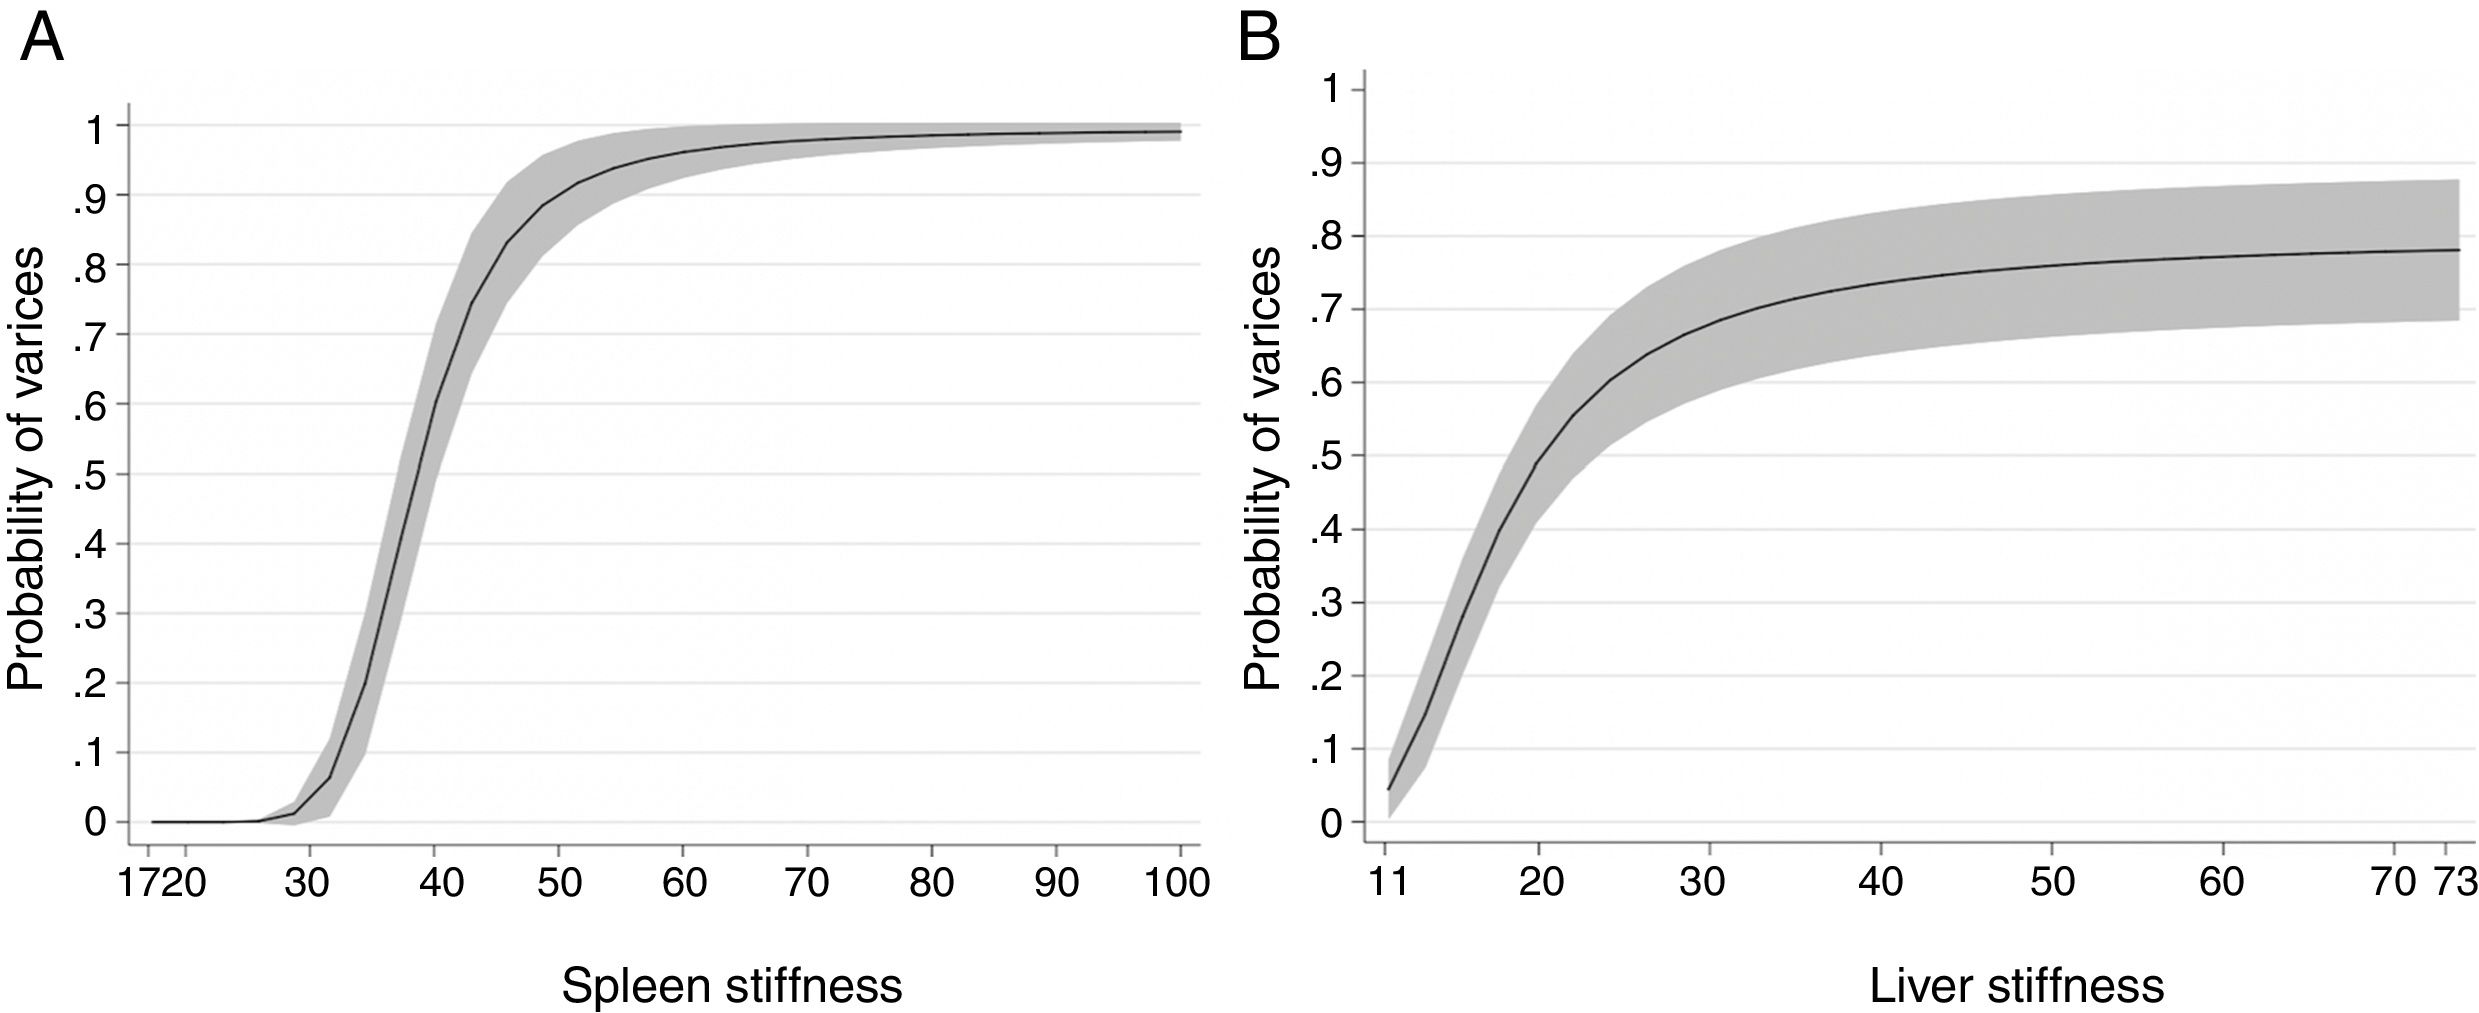
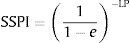
The cut-off value that allowed us to rule out the presence of EVs of any grade was 31kPa. This value showed a sensitivity of 100%, specificity of 60%, NPV of 100%, PPV of 62%, accuracy of 76%, +LR of 2.47. On the contrary, the cut-off value that allowed us to rule in the presence of EVs of any grade was 69kPa. This cut-off showed sensitivity of 14%, specificity of 100%, NPV of 64%, PPV of 100%, accuracy of 65%, +LR of −LR of 0.86. Regarding high-risk varices (HRVs), the cut-off of 46kPa showed sensitivity of 100%, specificity of 84%, NPV of 100%, PPV 27%, +LR of 6.19 and accuracy of 85%. Fig. 3 represents the probability of varices according to SS (A) as calculated from model 2 (M2), the grey area defines the upper and lower 95% C.I. of the probability defined by the black line. The probability formula has been derived in three steps from values reported in Table 2:
- 1.
Calculation of Transformed Spleen Stiffness (TSS):
- 2.
Calculation of the Linear Predictor (LP):
- 3.
Calculation of the Spleen Stiffness Probability Index (SSPI) of varices from LP:


 and spleen stiffness (as calculated from model 2). Note that the units of the x-axis are retransformed to the original scale, i.e. kPa).")
According to Fig. 3, the probability of EVs is <7% with SS values <30kPa (this value is the first inflection point of the curve). The slope of the curve rapidly increases between 30 and 50kPa. In particular, at 40kPa the probability of EVs has seen a six-fold (around 60%) gain, and at 50kPa the probability is nine times greater (around 90%). After 50kPa the probability steadily increases and reaches a plateau at 70kPa, where the probability is >97%.
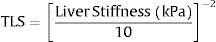
3.3Liver stiffnessLS showed an AUROC of 0.79 (95% C.I. 0.72–0.85, p<0.001) to discriminate the presence of EVs of any grade. SS and LS AUROCs were compared, and they were found to be statistically different (DeLong p<0.001). The cut-off of 20kPa showed a sensitivity of 73%, specificity of 78%, NPV of 81%, PPV of 69%, accuracy of 76%, +LR of 3.27, and −LR of 0.35. Using 20kPa as a cut-off, we would have missed 5 (out of 12) HRVs. Fig. 3 represents the probability of varices according to LS (B) as calculated from model 1 (M1), the grey area defines the upper and lower 95% C.I. of the probability defined by the black line. The probability formula has been derived in three steps from values reported in Table 2:
- 1.
Calculation of Transformed Spleen Stiffness (TLS):
- 2.
Calculation of the Linear Predictor (LP):
- 3.
Calculation of the Liver Stiffness Probability Index of varices from LP:

According to Fig. 3, a patient with a LS equal to 20kPa has a probability of having EVs equal to 50%. Moreover, the probability of having EVs is between 0 and 10% with values of LS=11–12kPa. The slope of the curve rapidly increases between 12 and 26kPa (where the probability is equal to 60%). Then the curve reaches a plateau at 50kPa, and the probability stabilizes between 75 and 80%.
3.4PSR and LSPSPSR showed an AUROC of 0.83 (95% C.I. 0.77–0.88, p<0.001) to discriminate the presence of EVs of any grade. The cut-off of 909 showed a sensitivity of 80%, specificity of 70%, NPV of 83%, PPV of 64%, accuracy of 74%, +LR of 2.46, and −LR of 0.29. Using this cut-off value, we would not have missed any HRVs. LSPS showed an AUROC of 0.91 (95% C.I. 0.88–0.95, p<0.001) to discriminate the presence of EVs of any grade. The cut-off of 1.72 showed a sensitivity of a sensitivity of 93%, specificity of 62%, NPV of 93%, PPV of 62%, accuracy of 74%, +LR of 2.44, and −LR of 0.12. Using this cut-off value, we would have missed 1 (out of 12) HRVs. SS and PSR/LSPS AUROCs were compared, and they were found to be statistically different (DeLong p<0.001).
3.5Application of Baveno VI criteriaUsing Baveno VI criteria, we would have missed 5 (out of 12) patients with HRVs. Those patients had LS<20kPa, but all showed SS>46kPa. Forty-five patients (21.4%) matched the criteria to rule-out HRVs, and none of them presented EVs during the EGD. At the same time, we would have uselessly enrolled for EGD 76 patients (36.1%) who matched the criteria mentioned above to rule-in HRVs. Twenty-three had no endoscopic sign of esophageal varices, whereas 53 had low-risk varices.
3.6Correlation between SS, LS and platelet countA correlation between platelet count and stiffness measurements was found. This correlation was stronger with SS (r=0.67) than LS (r=0.4), p<0.001. In patients with SS<31kPa (i.e., all without EVs) the median (IQR) value for platelet count was 145 (IQR 120.5–173.5) g/L, whereas in patients with SS>69kPa (i.e., all with EVs) the median (IQR) value for platelet was 75 (IQR 60.5–86.7) g/L. In patients with SS>46kPa, the median (IQR) value for platelet count was 86 (IQR 66–111) g/L. In patients with EVs and LS > 20kPa, the median (IQR) value for platelet was 87 (IQR 65–111) g/L, whereas patients without EVs and LS<20kPa the median (IQR) was significantly higher (p<0.001) and equal to 170 (IQR 120–176) g/L.
3.7Correlation between SS, LS and Splenic DimensionsSS showed a higher correlation with both splenic diameter and splenic area (r=0.52 and r=0.55 respectively) if compared to LS (r=0.30 and r=0.25 respectively). In patients with SS<31kPa (i.e. all without EVs) the median (IQR) value for spleen bipolar diameter was 12 (IQR 10–13) cm, whereas the median (IQR) spleen area measured at hilum was 51 (IQR 43–65) cm2. In patients with SS>69kPa (i.e. all with EVs) the median (IQR) value for spleen bipolar diameter was 15 (IQR 14–16) cm, whereas the median (IQR) spleen area measured at hilum was 92 (IQR 79–94) cm2.
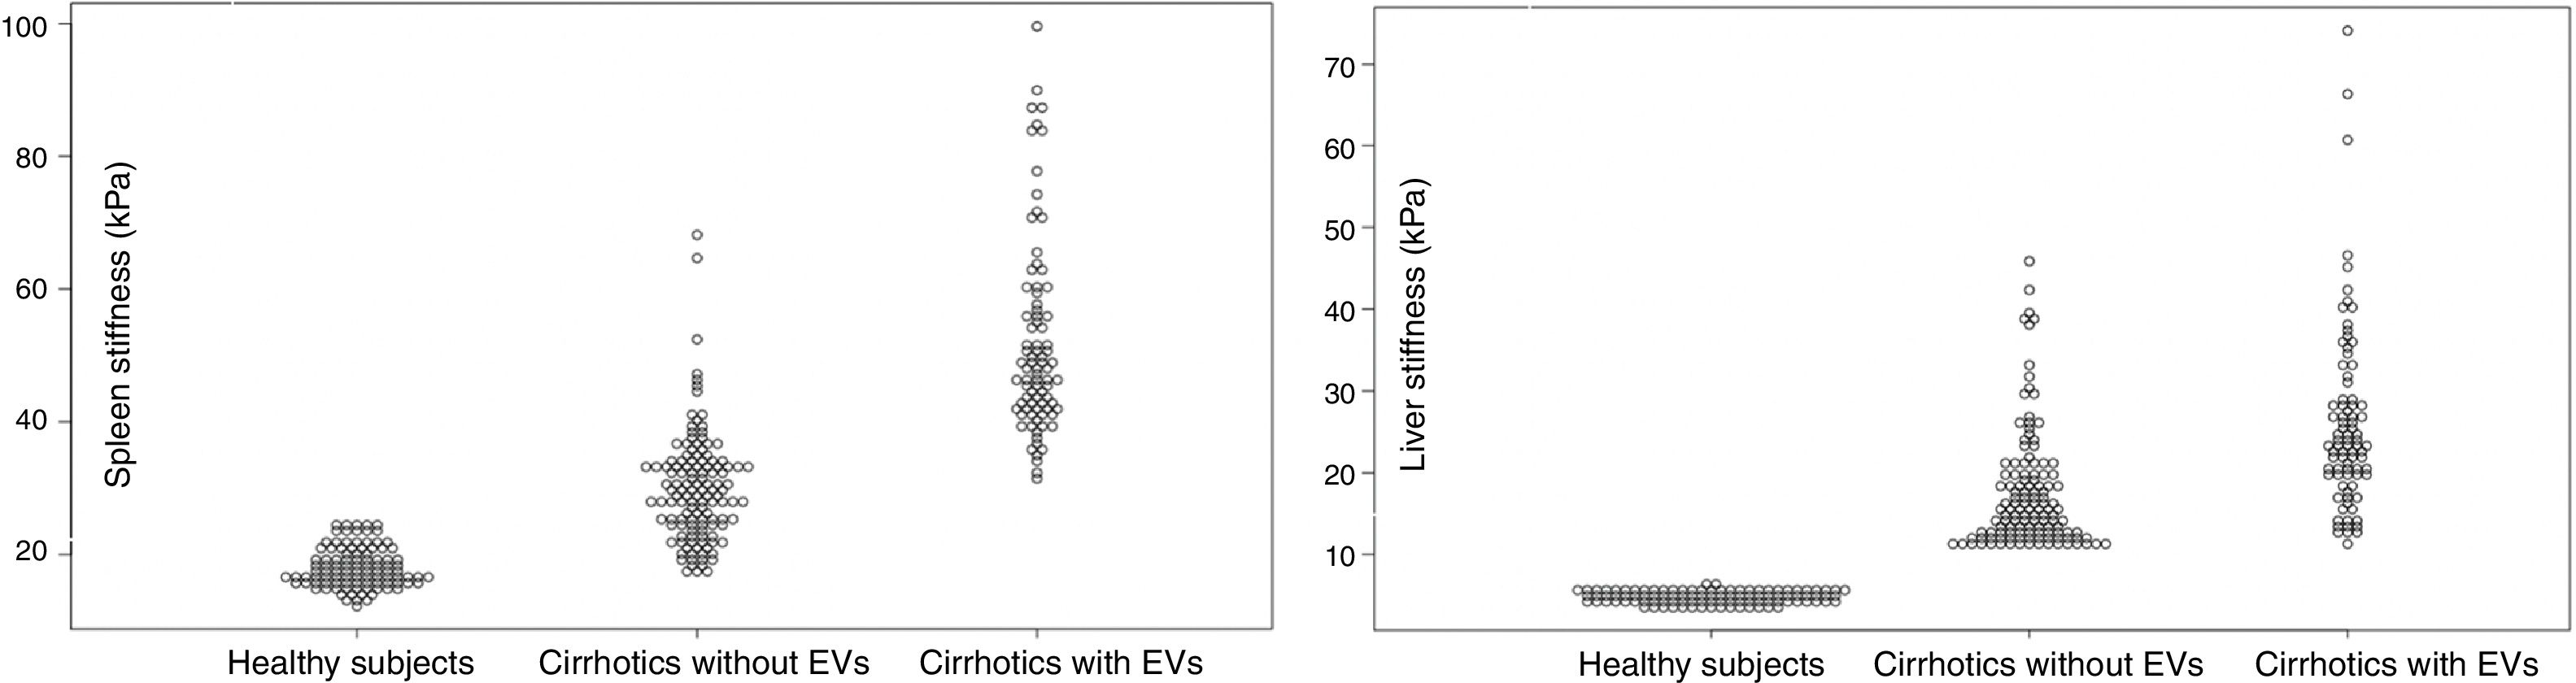
3.8LS and SS in healthy individuals compared to Cirrhotic PatientsOne hundred controls consisted of 51 females (51%) and 49 males (49%). Their median (IQR) age was 52 (IQR 28–56). The median (IQR) LS and SS values were 4.86 (IQR 4.17;5.59) kPa and 17.50 (IQR 15.63;20.52) respectively. LS and SS distribution between healthy subjects and patients with liver cirrhosis are reported in Fig. 4.
 and Liver Stiffness (right) distribution in Healthy Subjects, Cirrhotics without EVs and Cirrhotics with EVs. Values are reported in kPa (y-axis). Spleen Stiffness values have been found to overlap between healthy subjects and cirrhotic patients who have not developed EVs yet. No overlap was found between liver stiffness values in the three sub-groups.")
Spleen Stiffness (left) and Liver Stiffness (right) distribution in Healthy Subjects, Cirrhotics without EVs and Cirrhotics with EVs. Values are reported in kPa (y-axis). Spleen Stiffness values have been found to overlap between healthy subjects and cirrhotic patients who have not developed EVs yet. No overlap was found between liver stiffness values in the three sub-groups.
Liver cirrhosis is a disease characterized by a prolonged phase of compensation, that could suddenly evolve drastically, shortening the patient's survival. Hence, appropriate risk stratification in subjects with compensated disease becomes essential, and it should focus on the identification and correct staging of portal hypertension. Given that the gold-standard techniques for the staging of PH and the screening for EVs are invasive and expensive, researchers are trying to develop accurate non-invasive diagnostic techniques.
Elastography has attracted a great deal of interest. Transient elastography (TE) is an established excellent tool for assessing liver fibrosis and a good surrogate for HVPG measurement [37]. Despite being a promising tool, TE has severe limitations relative to SWE such as (i) the inability to set the ROI in real-time and in an optimal portion of the liver parenchyma, (ii) besides, SWE does not require software modifications to identify stiffness value>75kPa, and (iii) can be used even in patients with ascites [38].
Despite machine set-ups in both hardware and software, the rationale behind the superiority of SS to LS is related to portal hypertension pathophysiology. LS increase occurs in parallel to the rise of the fixed determinant of portal pressure, i.e., intrahepatic resistances. Therefore, dynamic variations caused by hyperdynamic splanchnic circulation and portal-axis blood flow cannot be thoroughly discriminated by liver elastography [39]. In contrast, SS rises principally by splenic congestion, that eventually leads to parenchymal fibrosis by architectural changes and blood retention in splenic arteries and veins [40]. Despite this theoretical approach, several studies have tried to correlate direct HVPG measurement with both LS and SS. Their results showed how SS stronger correlates with portal pressure, especially with HVPG ≥10mmHg and ≥12mmHg. For example, Hirooka et al. reported that HVPG had a higher grade of correlation with SS (r=0.85) than LS (r=0.51) [41]. Besides, our study found out that SS has a stronger correlation with both platelet count and splenic dimensions if compared to LS. This (i) further implies the very likely association between SS and the pathophysiology of portal hypertension and (ii) explains why combined score such as PSR and its combination with LS (LSPS) perform better than LS alone. These hypothesis and our results are consistent with what emerges from recent meta-analyses [42–44], i.e., LS by itself has a discriminatory capability of EVs that is less performant than PSR (a score where only platelet and spleen diameter are present) and LSPS (a score where the PSR is strengthened by LS). In our group of patients, the AUROC for LS, PSR, and LSPS where 0.79, 0.83, and 0.91 respectively.
A further interesting finding is the comparison of stiffness values between cirrhotics and healthy volunteers. We found that there is an overlap of SS values between healthy individuals and cirrhotic subjects without EVs. Similar findings have been published by Takuma et al. [45]. It is very likely that the spleen of a cirrhotic patient without EVs has not yet suffered from the pathophysiological mechanism that promoted EVs genesis in the first place. The potentiality of this finding should be further studied given the fact that SS has been found to predict hepatic decompensation [46], and therefore it may help to differentiate between the initial build-up of portal pressure from CSPH.
LS has proven to be a useful, but not an excellent discriminator of EVs, besides, the superiority of the SS model can be ascribed not only at its discriminative ability but towards its calibration (highest AUROC and Pseudo-R2/lowest AIC and BIC). Before any further discussion, it is important to clarify that (i) Baveno VI are meant to predict HRVs; and (ii) that they were established and safely applicable on TE (ElastPQ protocol information on the aforementioned criteria is scarce). In addition, the rate of variability between systems that use equivalent elastographic techniques is in the order of 12% [47]. This means that results derived from different studies are not fully applicable in other settings and even if the concordance between TE and ElastPQ can be increased by adherence to quality criteria [48], they should be adapted to other elastography techniques. Applying Baveno VI criteria, we would have missed 40% of HRVs and performed EGD in vain to 36% of our patients. At the same time, Baveno VI criteria would have spared EGD safely in 21% of patients. This substantially low number of spared endoscopies could have been boosted by directly applying SS cut-off of 31kPa, which would have let us spare EGD in 36% of patients. Other studies which used pSWE have proposed several cut-offs to rule-out EVs at 3.16–3.18m/s [45,49], whereas studies who used TE reported higher values between 40.8 and 55kPa to rule-out any varices [17,50–52]. On the side of HRVs, our results differ from what reported by Bota et al. [53], Takuma et al. [45] and Kim et al. [49], who reported cut-off of 2.55m/s, 3.30m/s and 3.40m/s respectively; but are very similar to what reported by Vermehren et al. (4.13m/s) [54]. Besides, it is interesting to highlight, how our results on HRVs are very similar to TE cut-off: Colecchia et al. [55] and Zykus et al. [56] proposed a cut-off of 46kPa and 47.6kPa to rule-in HRVs – comparable to the value of 46kPa detected by our analyses.
Despite cut-off analyses, it was possible to create a probability model that could help decide to spare endoscopic screening in low-risk patients (for any grade of EVs). Having a given probability instead of a single number to rule-in or rule-out a specific event is indeed more helpful and could support the clinician in the decision of performing an invasive test if the probability is high. Cut-off values, even if they are chosen to be the most sensitive or specific, are always subjects to false-positives and false negatives; and, sometimes, even with low LS and SS, the clinical presentation may require more invasive tests, making cut-offs pointless. Nevertheless, it is well known that (i) EVs develop at a yearly rate of 8% in cirrhotic patients without EVs during the initial endoscopic screening, and (ii) that patients with small varices may develop HRVs at a yearly rate of 8% [57,58]. SS probability model may help to detect that percentage of patients who will develop varices or progress from small to large varices, by merely checking variation in stiffness values over time.
Our study has the significant strength of including a cross-section of patients with compensated disease in whom the etiological factor has been eliminated, which are those undergoing repeated endoscopic surveillance. Furthermore, we propose a simple and direct probability model that aims at individualizing care in cirrhotic patients, thus potentially leading to better risk stratification and significant cost reduction in everyday clinical practice.
The critical limitations of our study were the lack of an external validation cohort, the impossibility of direct HVPG measurement, and the substantial low number of patients with HRVs. In particular, the latter was related to patients being administered NSBB before being admitted to our center. The lack of HRVs makes our Baveno VI analysis less valuable, but the practical application of these criteria was not the main aim of this study. In addition, non-invasive criteria to ruling-out patients with HRVs should be revised in the light of the recent paper published by Villanueva et al. [59], which pointed out that even low-risk EVs (as a marker of CSPH), has to be considered markers of severe prognosis in cirrhotic patients, and that NSBB administration should start promptly regardless of HRVs presence. These findings challenge the previous assumption that only HRVs should be considered a risk factor, and gives further strength to our model of risk stratification for EVs of any grade. The SSPI, mainly based on low-risk EVs, could help the clinician to decide whether or not initiate NSBB administration in patients with a high probability of EVs (i.e., CSPH) in order to delay hepatic decompensation onset.
In conclusion, the results of this study further emphasize the potential clinical relevance of SS measurement by pSWE elastography in the clinical workup of cirrhotic patients. The SS (alone or combined with other indicators) could play a crucial role as a screening test allowing the selection of patients with a low risk of developing varices, to whom additional invasive testing should be avoided.AbbreviationsPH portal hypertension clinically significant portal hypertension esophageal varices direct antiviral agents hepatic vein pressure gradient esophagogastroduodenoscopy high-risk esophageal varices non-invasive techniques kilo-Pascal liver stiffness spleen stiffness platelet count to spleen diameter ratio liver stiffness-spleen size to platelet ratio risk score compensated advanced chronic liver disease non-selective beta-blockers transjugular intrahepatic portosystemic shunt interquantile median Akaike information criterion Bayesian information criterion area under the receiver-operating characteristic curve positive predictive value negative predictive value positive likelihood ratio negative likelihood ratio Transformed Spleen Stiffness Transformed Liver Stiffness linear predictor Spleen Stiffness Probability Index Liver Stiffness Probability Index
The authors have no conflicts of interest to declare.


