


Background and rationale for the study. Hyperglycemia after graft reperfusion is a consistent finding in liver transplantation (LT) that remains poorly studied. We aim to describe its appearance in LT recipients of different types of grafts and its relation to the graft function.
Material & methods. 436 LT recipients of donors after brain death (DBD), donors after cardiac death (DCD), and familial amyloidotic polyneuropathy (FAP) donors were reviewed. Serum glucose was measured at baseline, during the anhepatic phase, after graft reperfusion, and at the end of surgery. Early graft dysfunction (EAD) was assessed by Olthoff criteria. Caspase-3, IFN-γ, IL1β, and IL6 gene expression were measured in liver biopsy.
Results. The highest increase in glucose levels after reperfusion was observed in FAP LT recipients and the lowest in DCD LT recipients. Glucose level during the anhepatic phase was the only modifiable predictive variable of hyperglycemia after reperfusion. No relation was found between hyperglycemia after reperfusion and EAD. However, recipients with the highest glucose levels after reperfusion tended to achieve the best glucose control at the end of surgery and those who were unable to control the glucose value after reperfusion showed EAD more frequently. The highest levels of caspase-3 were found in recipients with the lowest glucose values after reperfusion. In conclusion, glucose levels increased after graft reperfusion to a different extent according to the donor type. Contrary to general belief, transient hyperglycemia after reperfusion does not appear to impact negatively on the liver graft function and could even be suggested as a marker of graft quality.
Although many studies have demonstrated a significant improvement in morbidity and mortality in critically ill patients with glucose control,1–3 few studies have assessed the role of hyperglycemia in the liver transplant (LT) setting.4–6
Hyperglycemia is a consistent finding after graft reperfusion during liver transplantation and several factors are thought to be involved in its appearance: high-dose corticosteroids, blood product transfusion, vasoactive drug requirement, surgical stress, glucose release from the graft, and insulin resistance of the recipient. However, the influence of donor type on glucose levels after graft reperfusion has not been investigated. Experimental studies have suggested that hyperglycemia exacerbates ischemiareperfusion injury due to the enhancement of the inflammatory response.7–9
The effect of transient hyperglycemia after reperfusion on graft function remains undetermined and it is not known whether the glucose released from the reperfused liver and the ability to recover normal values with intensive insulin treatment have any prognostic significance with respect to functional recovery of the organ.
The goals of this study were:
- •
To describe the hyperglycemic pattern of liver transplantation in three different donor types and its predictive factors and
- •
To investigate the relation between transient hyperglycemia after reperfusion and the liver graft function.
We prospectively evaluated 436 consecutive LTs performed at the Hospital Clinic of Barcelona between January 2005 and December 2011. Living donors, split grafts, acute liver failure, re-transplants, and combined transplants were excluded from the study. Patient and biological data were recorded in a computerized database. Serum glucose was measured at four predefined time points during the procedure:
- •
T1: baseline.
- •
T2: anhepatic phase.
- •
T3: twenty minutes after graft reperfusion; and
- •
T4: end of surgery.
Five glucose values after reperfusion, all from DBD, were missed. Arterial catheters for blood sampling were used in all recipients. Except for the split grafts and the race (Caucasian was the only donor race in this population), donor characteristics included in the donor risk index10 were also recorded. The piggy back technique was performed in all LTs and temporary portocaval shunt was performed when needed. Immunosuppression was administered according to the protocols established at our center. The study was approved by the ethics and research Committee of the Hospital Clinic de Barcelona.
Anesthesia managementGeneral anesthesia was performed with intravenous midazolam, etomidate, and fentanyl and maintained with desflurane. Hemodynamic monitoring included precordial leads II and V, a pulmonary catheter (continuous cardiac index and mixed venous saturation), and continuous femoral arterial pressure. Transesophageal echocardiography was used when needed. Serum glucose was managed according to a standardized protocol in order to keep glucose level below 150 mg/dL and insulin perfusion was started when this value was exceeded during the anhepatic phase (Appendix).
The target blood glucose level in the acute care setting supported by many relevant scientific societies is around 120 mg/dL.11 Glucose in the LT reaches the highest values after graft reperfusion; we decided to define hyperglycemia after reperfusion as a glucose plasma level > 180 mg/dL, given that recent studies in this setting consider glucose control levels above this value as poor.5 Good glucose control was defined as a glucose level at the end of surgery lower than the glucose level after reperfusion (T4 < T3) and bad glucose control as the opposite.
Follow-upHematology and biochemical tests during the first week were recorded to evaluate the initial graft function that was assessed according to Olthoff criteria.12
Liver tissue samplesTo investigate the relation between the hyperglycemia after reperfusion and the gene expression of the inflammatory markers, tissue samples from 40 DBD recipients (20 with glucose levels < 180 mg/dL after reperfusion and 20 with glucose levels > 180 mg/dL after reperfusion, matched for the main baseline and intraoperative characteristics) were taken just before cross-clamp in the donor and 2 h after graft reperfusion in the recipient. The following expression genes were investigated: caspase-3, IFN-γ, IL-1β, and IL-6. Hepatic biopsies were snap-frozen in liquid nitrogen for RNA extraction. Real-time quantitative Taqman reverse transcriptase polymerase chain reaction (RT-PCR) analysis of caspase-3, IFN-γ, IL-1β, and IL-6 gene expression was performed. Total RNA was extracted from frozen tissue using TRIzol (Invitrogen, Breda, the Netherlands) and treated with DNase I Amplification Grade.
qPCR experimentsThe expression pattern of a group of 4 genes and 2 housekeeping genes (18S, HPRT1) was measured by qPCR employing the ABI 7900 Sequence Detection System and LDA microfluidic PCR cards (PE Applied Biosystems) on tissue samples obtained from liver biopsy. To quantify the levels of mRNA, we normalized the expression of the target genes to the average expression of housekeeping genes HPRT1 and 18S and presented the results as delta CT. Results from multiple experiments were pooled and analyzed using a Student i-test or a two-way ANOVA with post-hoc Tukey HSD (Tukey honestly significant differences). All plots and statistical tables were done using R statistical software (v.2.9).
Statistical methodsContinuous variables were expressed as median and interquartile range. The chi-square test or the Fisher exact test was used for qualitative or dichotomized variables and the Mann-Whitney test for continuous variables. A two-tailed p value of less than 0.05 was taken as representing significance. Spearman correlation was used. Logistic regression analysis was used to find the predictive model for hyperglycemia and for glucose control after reperfusion. All analyses were performed with SPSS software, Version 17 (SPSS Inc., Chicago, IL).
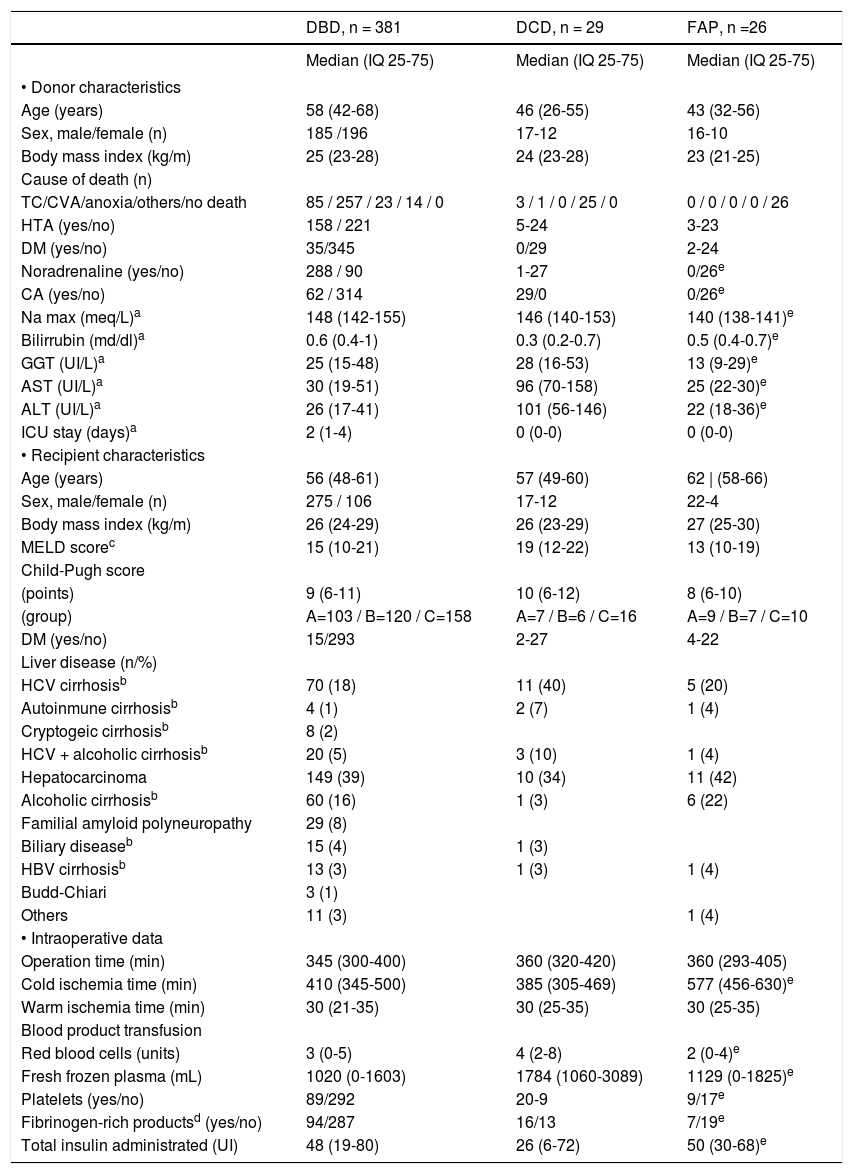
ResultsDemographic data and intraoperative glucose course according to donor typeData from 436 LTs were recorded. The liver grafts came from three donor types: 381 donors after brain death (DBD), 29 donors after cardiac death (DCD), and 26 donors with familial amyloidotic polyneuropathy (FAP). The main features at the time of surgery and the characteristics according to donor type are summarized in table 1.
Demographic and intraoperative data of donors and recipients.
| DBD, n = 381 | DCD, n = 29 | FAP, n =26 | |
|---|---|---|---|
| Median (IQ 25-75) | Median (IQ 25-75) | Median (IQ 25-75) | |
| • Donor characteristics | |||
| Age (years) | 58 (42-68) | 46 (26-55) | 43 (32-56) |
| Sex, male/female (n) | 185 /196 | 17-12 | 16-10 |
| Body mass index (kg/m) | 25 (23-28) | 24 (23-28) | 23 (21-25) |
| Cause of death (n) | |||
| TC/CVA/anoxia/others/no death | 85 / 257 / 23 / 14 / 0 | 3 / 1 / 0 / 25 / 0 | 0 / 0 / 0 / 0 / 26 |
| HTA (yes/no) | 158 / 221 | 5-24 | 3-23 |
| DM (yes/no) | 35/345 | 0/29 | 2-24 |
| Noradrenaline (yes/no) | 288 / 90 | 1-27 | 0/26e |
| CA (yes/no) | 62 / 314 | 29/0 | 0/26e |
| Na max (meq/L)a | 148 (142-155) | 146 (140-153) | 140 (138-141)e |
| Bilirrubin (md/dl)a | 0.6 (0.4-1) | 0.3 (0.2-0.7) | 0.5 (0.4-0.7)e |
| GGT (UI/L)a | 25 (15-48) | 28 (16-53) | 13 (9-29)e |
| AST (UI/L)a | 30 (19-51) | 96 (70-158) | 25 (22-30)e |
| ALT (UI/L)a | 26 (17-41) | 101 (56-146) | 22 (18-36)e |
| ICU stay (days)a | 2 (1-4) | 0 (0-0) | 0 (0-0) |
| • Recipient characteristics | |||
| Age (years) | 56 (48-61) | 57 (49-60) | 62 | (58-66) |
| Sex, male/female (n) | 275 / 106 | 17-12 | 22-4 |
| Body mass index (kg/m) | 26 (24-29) | 26 (23-29) | 27 (25-30) |
| MELD scorec | 15 (10-21) | 19 (12-22) | 13 (10-19) |
| Child-Pugh score | |||
| (points) | 9 (6-11) | 10 (6-12) | 8 (6-10) |
| (group) | A=103 / B=120 / C=158 | A=7 / B=6 / C=16 | A=9 / B=7 / C=10 |
| DM (yes/no) | 15/293 | 2-27 | 4-22 |
| Liver disease (n/%) | |||
| HCV cirrhosisb | 70 (18) | 11 (40) | 5 (20) |
| Autoinmune cirrhosisb | 4 (1) | 2 (7) | 1 (4) |
| Cryptogeic cirrhosisb | 8 (2) | ||
| HCV + alcoholic cirrhosisb | 20 (5) | 3 (10) | 1 (4) |
| Hepatocarcinoma | 149 (39) | 10 (34) | 11 (42) |
| Alcoholic cirrhosisb | 60 (16) | 1 (3) | 6 (22) |
| Familial amyloid polyneuropathy | 29 (8) | ||
| Biliary diseaseb | 15 (4) | 1 (3) | |
| HBV cirrhosisb | 13 (3) | 1 (3) | 1 (4) |
| Budd-Chiari | 3 (1) | ||
| Others | 11 (3) | 1 (4) | |
| • Intraoperative data | |||
| Operation time (min) | 345 (300-400) | 360 (320-420) | 360 (293-405) |
| Cold ischemia time (min) | 410 (345-500) | 385 (305-469) | 577 (456-630)e |
| Warm ischemia time (min) | 30 (21-35) | 30 (25-35) | 30 (25-35) |
| Blood product transfusion | |||
| Red blood cells (units) | 3 (0-5) | 4 (2-8) | 2 (0-4)e |
| Fresh frozen plasma (mL) | 1020 (0-1603) | 1784 (1060-3089) | 1129 (0-1825)e |
| Platelets (yes/no) | 89/292 | 20-9 | 9/17e |
| Fibrinogen-rich productsd (yes/no) | 94/287 | 16/13 | 7/19e |
| Total insulin administrated (UI) | 48 (19-80) | 26 (6-72) | 50 (30-68)e |
DBD: donor after brain death. DCD: donor after cardiac death. FAP: familiar amyloidotic polyneuropathy. TC: cranioencephalic trauma. CVA: cardiovascular accident. DM: diabetes mellitus. CA: circulatory arrest. ICU: intensive care unit. HCV: hepatitis C virus. HCC: hepatocellular carcinoma. HBV: hepatitis B virus.
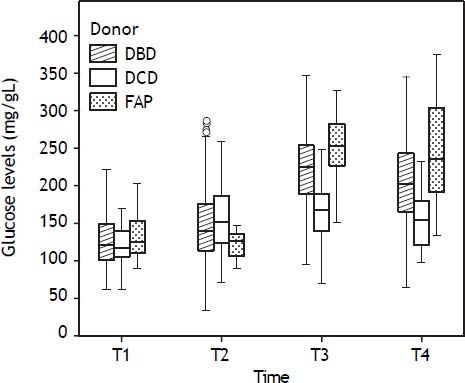
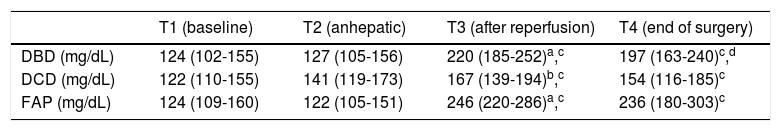
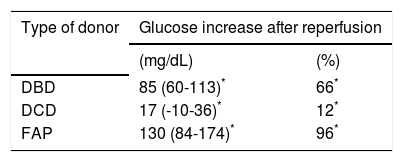
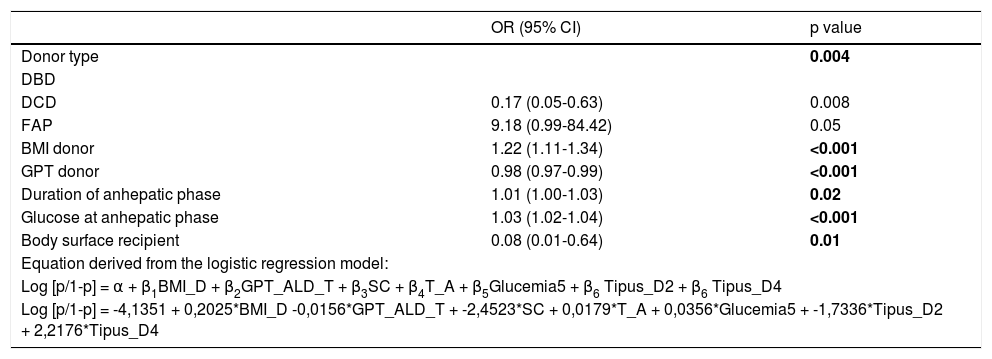
Evolution of the glucose level during the liver transplantation according to the donor type are displayed in figure 1. Glucose levels increased significantly after reperfusion in all donor groups. The highest glucose levels and highest percentage of increase in glucose levels after reperfusion were seen in the FAP recipients, whereas the lowest glucose values and the lowest percentage of increase in glucose values were seen in the DCD recipients (Tables 2 and 3). In a logistic regression model, type of donor, body mass index and GPT of the donor, body surface recipient, long anhepatic time, and glucose levels in the anhepatic phase emerged as independent predictors of glucose levels > 180 mg/dL after reperfusion (Tables 4-6, Figure 2).

Glucose values along the liver transplant for each donor type.
| T1 (baseline) | T2 (anhepatic) | T3 (after reperfusion) | T4 (end of surgery) | |
|---|---|---|---|---|
| DBD (mg/dL) | 124 (102-155) | 127 (105-156) | 220 (185-252)a,c | 197 (163-240)c,d |
| DCD (mg/dL) | 122 (110-155) | 141 (119-173) | 167 (139-194)b,c | 154 (116-185)c |
| FAP (mg/dL) | 124 (109-160) | 122 (105-151) | 246 (220-286)a,c | 236 (180-303)c |
Median (interquartile range 25-75). DBD: donor after brain death. DCD: donor after cardiac death. FAP: familial amyloidotic polyneuropathy.
Glucose increase after reperfusion (T3 vs. T2) for each donor type.
| Type of donor | Glucose increase after reperfusion | |
|---|---|---|
| (mg/dL) | (%) | |
| DBD | 85 (60-113)* | 66* |
| DCD | 17 (-10-36)* | 12* |
| FAP | 130 (84-174)* | 96* |
Median (interquartile range 25-75). DBD: donor after brain death. DCD: donor after cardiac death. FAP: familial amyloidotic polyneuropathy.
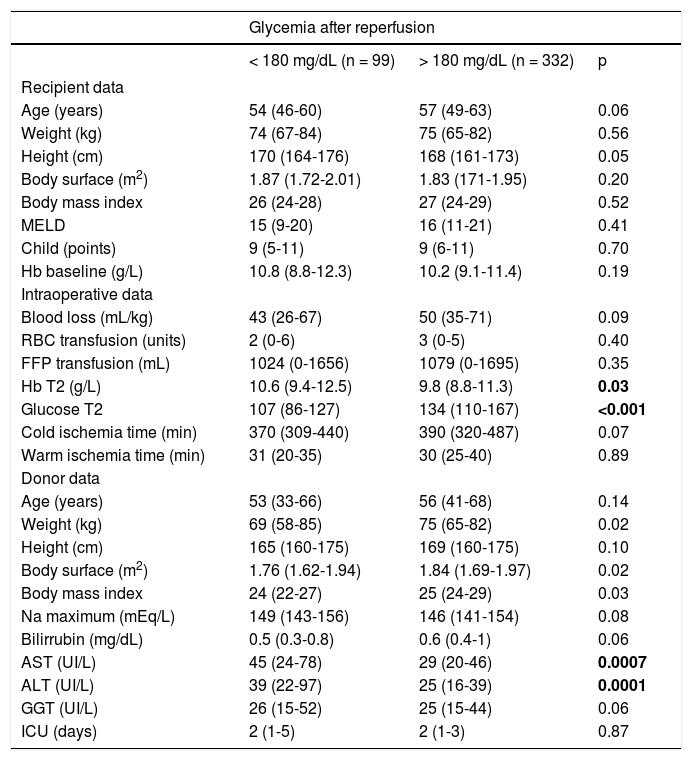
Bivariate analysis for hyperglycemia after reperfusion.
| Glycemia after reperfusion | |||
|---|---|---|---|
| < 180 mg/dL (n = 99) | > 180 mg/dL (n = 332) | p | |
| Recipient data | |||
| Age (years) | 54 (46-60) | 57 (49-63) | 0.06 |
| Weight (kg) | 74 (67-84) | 75 (65-82) | 0.56 |
| Height (cm) | 170 (164-176) | 168 (161-173) | 0.05 |
| Body surface (m2) | 1.87 (1.72-2.01) | 1.83 (171-1.95) | 0.20 |
| Body mass index | 26 (24-28) | 27 (24-29) | 0.52 |
| MELD | 15 (9-20) | 16 (11-21) | 0.41 |
| Child (points) | 9 (5-11) | 9 (6-11) | 0.70 |
| Hb baseline (g/L) | 10.8 (8.8-12.3) | 10.2 (9.1-11.4) | 0.19 |
| Intraoperative data | |||
| Blood loss (mL/kg) | 43 (26-67) | 50 (35-71) | 0.09 |
| RBC transfusion (units) | 2 (0-6) | 3 (0-5) | 0.40 |
| FFP transfusion (mL) | 1024 (0-1656) | 1079 (0-1695) | 0.35 |
| Hb T2 (g/L) | 10.6 (9.4-12.5) | 9.8 (8.8-11.3) | 0.03 |
| Glucose T2 | 107 (86-127) | 134 (110-167) | <0.001 |
| Cold ischemia time (min) | 370 (309-440) | 390 (320-487) | 0.07 |
| Warm ischemia time (min) | 31 (20-35) | 30 (25-40) | 0.89 |
| Donor data | |||
| Age (years) | 53 (33-66) | 56 (41-68) | 0.14 |
| Weight (kg) | 69 (58-85) | 75 (65-82) | 0.02 |
| Height (cm) | 165 (160-175) | 169 (160-175) | 0.10 |
| Body surface (m2) | 1.76 (1.62-1.94) | 1.84 (1.69-1.97) | 0.02 |
| Body mass index | 24 (22-27) | 25 (24-29) | 0.03 |
| Na maximum (mEq/L) | 149 (143-156) | 146 (141-154) | 0.08 |
| Bilirrubin (mg/dL) | 0.5 (0.3-0.8) | 0.6 (0.4-1) | 0.06 |
| AST (UI/L) | 45 (24-78) | 29 (20-46) | 0.0007 |
| ALT (UI/L) | 39 (22-97) | 25 (16-39) | 0.0001 |
| GGT (UI/L) | 26 (15-52) | 25 (15-44) | 0.06 |
| ICU (days) | 2 (1-5) | 2 (1-3) | 0.87 |
FFP: fresh frozen plasma. Hb: hemoglobin. RBC: red blood cells. T2: anhepatic phase. ICU: intensive care unit. Median (interquartile range 25-75).
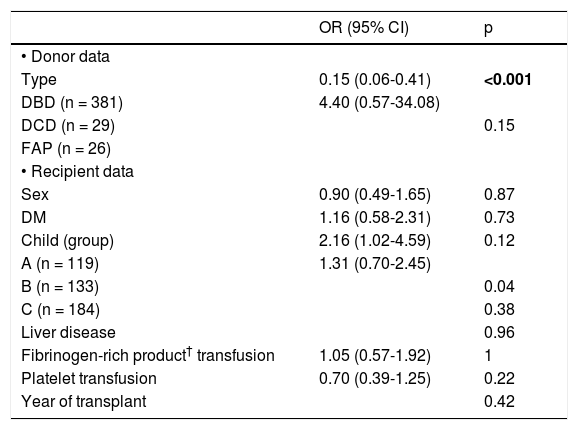
Bivariate analysis for hyperglycemia after reperfusion.
| OR (95% CI) | p | |
|---|---|---|
| • Donor data | ||
| Type | 0.15 (0.06-0.41) | <0.001 |
| DBD (n = 381) | 4.40 (0.57-34.08) | |
| DCD (n = 29) | 0.15 | |
| FAP (n = 26) | ||
| • Recipient data | ||
| Sex | 0.90 (0.49-1.65) | 0.87 |
| DM | 1.16 (0.58-2.31) | 0.73 |
| Child (group) | 2.16 (1.02-4.59) | 0.12 |
| A (n = 119) | 1.31 (0.70-2.45) | |
| B (n = 133) | 0.04 | |
| C (n = 184) | 0.38 | |
| Liver disease | 0.96 | |
| Fibrinogen-rich product† transfusion | 1.05 (0.57-1.92) | 1 |
| Platelet transfusion | 0.70 (0.39-1.25) | 0.22 |
| Year of transplant | 0.42 |
DM: diabetes mellitus. OR: odds ratio.
Multivariate analysis for hyperglycemia after reperfusion.
| OR (95% CI) | p value | |
|---|---|---|
| Donor type | 0.004 | |
| DBD | ||
| DCD | 0.17 (0.05-0.63) | 0.008 |
| FAP | 9.18 (0.99-84.42) | 0.05 |
| BMI donor | 1.22 (1.11-1.34) | <0.001 |
| GPT donor | 0.98 (0.97-0.99) | <0.001 |
| Duration of anhepatic phase | 1.01 (1.00-1.03) | 0.02 |
| Glucose at anhepatic phase | 1.03 (1.02-1.04) | <0.001 |
| Body surface recipient | 0.08 (0.01-0.64) | 0.01 |
| Equation derived from the logistic regression model: | ||
| Log [p/1-p] = α + β1BMI_D + β2GPT_ALD_T + β3SC + β4T_A + β5Glucemia5 + β6 Tipus_D2 + β6 Tipus_D4 | ||
| Log [p/1-p] = -4,1351 + 0,2025*BMI_D -0,0156*GPT_ALD_T + -2,4523*SC + 0,0179*T_A + 0,0356*Glucemia5 + -1,7336*Tipus_D2 + 2,2176*Tipus_D4 | ||
DBD: donor after brain death. DCD: donor after cardiac death. FAP: familial amyloidotic polyneuropathy. OR: odds ratio.

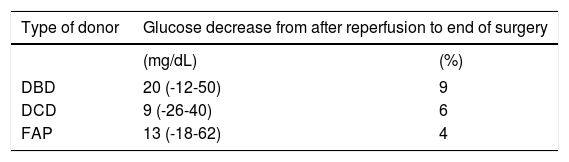
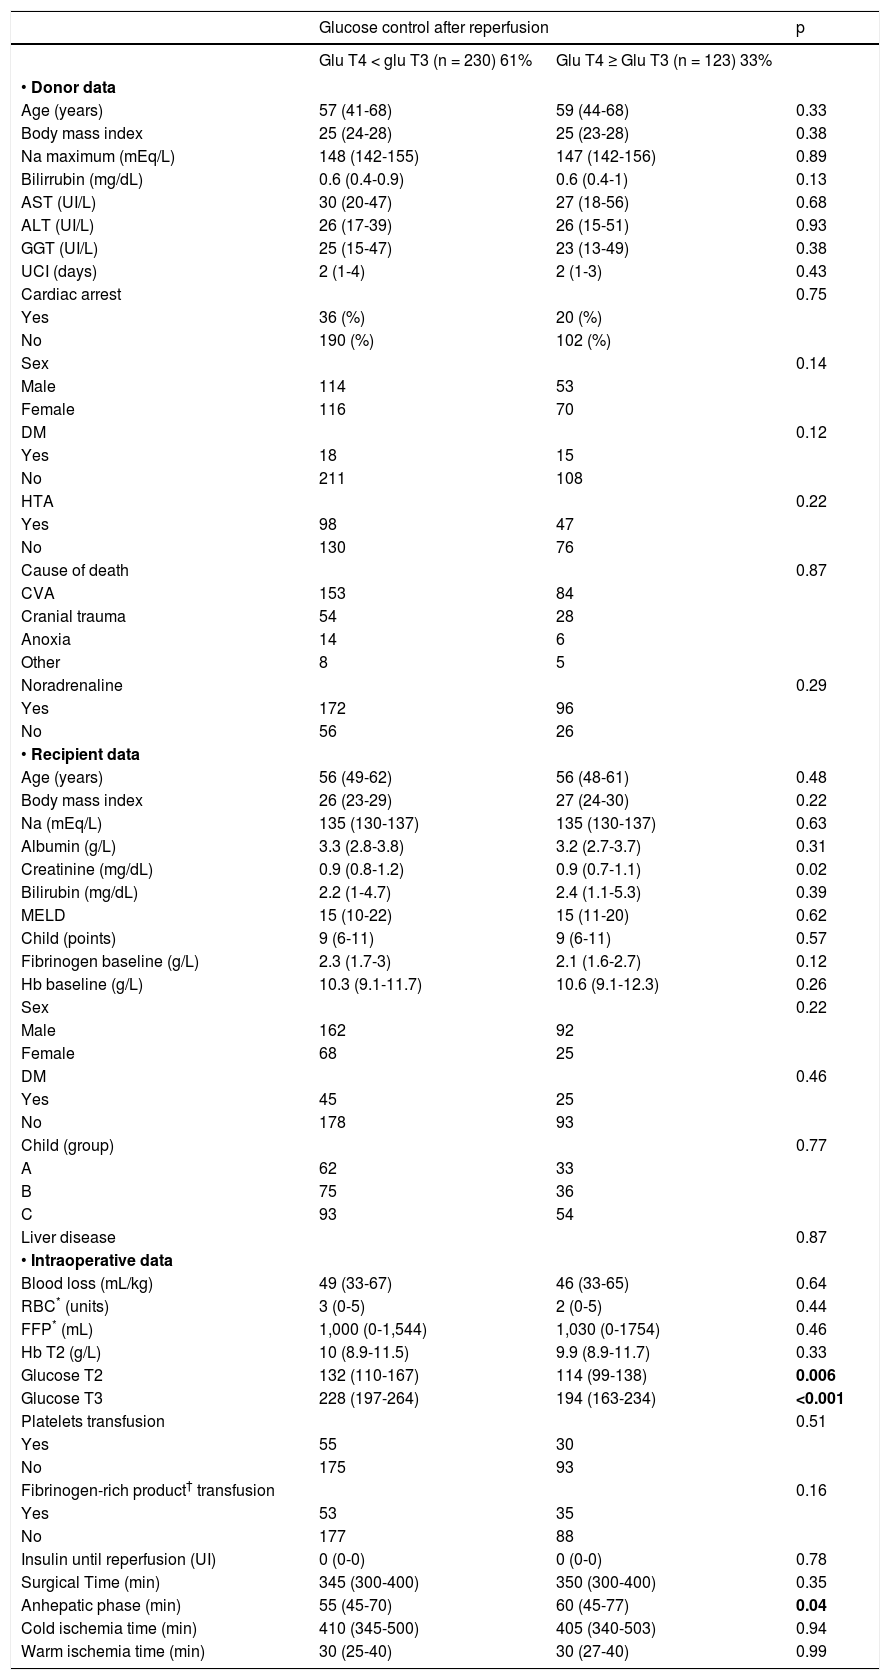
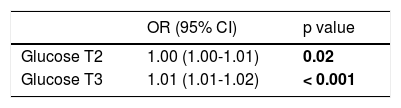
Glucose levels declined from reperfusion until the end of surgery in all donor groups (Table 7) but the decrease was significant only in the DBD recipients: from 220 (185-252) to 197 (163-240) mg/dL (p < 0.001) (Table 2). In a logistic regression analysis, glucose levels during the anhepatic phase and after reperfusion emerged as independent predictors of glucose decrease. Recipients with the highest glucose levels during the anhepatic phase and after reperfusion achieved the best control of glucose at the end of surgery (Tables 8 and 9).
Glucose decrease from after reperfusion until end of surgery for each donor type.
| Type of donor | Glucose decrease from after reperfusion to end of surgery | |
|---|---|---|
| (mg/dL) | (%) | |
| DBD | 20 (-12-50) | 9 |
| DCD | 9 (-26-40) | 6 |
| FAP | 13 (-18-62) | 4 |
Median (interquartile range 25-75). DBD: donor after brain death. DCD: donor after cardiac death. FAP: familial amyloidotic polyneuropathy.
Bivariate analysis for glucose control after reperfusion.
| Glucose control after reperfusion | p | ||
|---|---|---|---|
| Glu T4 < glu T3 (n = 230) 61% | Glu T4 ≥ Glu T3 (n = 123) 33% | ||
| • Donor data | |||
| Age (years) | 57 (41-68) | 59 (44-68) | 0.33 |
| Body mass index | 25 (24-28) | 25 (23-28) | 0.38 |
| Na maximum (mEq/L) | 148 (142-155) | 147 (142-156) | 0.89 |
| Bilirrubin (mg/dL) | 0.6 (0.4-0.9) | 0.6 (0.4-1) | 0.13 |
| AST (UI/L) | 30 (20-47) | 27 (18-56) | 0.68 |
| ALT (UI/L) | 26 (17-39) | 26 (15-51) | 0.93 |
| GGT (UI/L) | 25 (15-47) | 23 (13-49) | 0.38 |
| UCI (days) | 2 (1-4) | 2 (1-3) | 0.43 |
| Cardiac arrest | 0.75 | ||
| Yes | 36 (%) | 20 (%) | |
| No | 190 (%) | 102 (%) | |
| Sex | 0.14 | ||
| Male | 114 | 53 | |
| Female | 116 | 70 | |
| DM | 0.12 | ||
| Yes | 18 | 15 | |
| No | 211 | 108 | |
| HTA | 0.22 | ||
| Yes | 98 | 47 | |
| No | 130 | 76 | |
| Cause of death | 0.87 | ||
| CVA | 153 | 84 | |
| Cranial trauma | 54 | 28 | |
| Anoxia | 14 | 6 | |
| Other | 8 | 5 | |
| Noradrenaline | 0.29 | ||
| Yes | 172 | 96 | |
| No | 56 | 26 | |
| • Recipient data | |||
| Age (years) | 56 (49-62) | 56 (48-61) | 0.48 |
| Body mass index | 26 (23-29) | 27 (24-30) | 0.22 |
| Na (mEq/L) | 135 (130-137) | 135 (130-137) | 0.63 |
| Albumin (g/L) | 3.3 (2.8-3.8) | 3.2 (2.7-3.7) | 0.31 |
| Creatinine (mg/dL) | 0.9 (0.8-1.2) | 0.9 (0.7-1.1) | 0.02 |
| Bilirubin (mg/dL) | 2.2 (1-4.7) | 2.4 (1.1-5.3) | 0.39 |
| MELD | 15 (10-22) | 15 (11-20) | 0.62 |
| Child (points) | 9 (6-11) | 9 (6-11) | 0.57 |
| Fibrinogen baseline (g/L) | 2.3 (1.7-3) | 2.1 (1.6-2.7) | 0.12 |
| Hb baseline (g/L) | 10.3 (9.1-11.7) | 10.6 (9.1-12.3) | 0.26 |
| Sex | 0.22 | ||
| Male | 162 | 92 | |
| Female | 68 | 25 | |
| DM | 0.46 | ||
| Yes | 45 | 25 | |
| No | 178 | 93 | |
| Child (group) | 0.77 | ||
| A | 62 | 33 | |
| B | 75 | 36 | |
| C | 93 | 54 | |
| Liver disease | 0.87 | ||
| • Intraoperative data | |||
| Blood loss (mL/kg) | 49 (33-67) | 46 (33-65) | 0.64 |
| RBC* (units) | 3 (0-5) | 2 (0-5) | 0.44 |
| FFP* (mL) | 1,000 (0-1,544) | 1,030 (0-1754) | 0.46 |
| Hb T2 (g/L) | 10 (8.9-11.5) | 9.9 (8.9-11.7) | 0.33 |
| Glucose T2 | 132 (110-167) | 114 (99-138) | 0.006 |
| Glucose T3 | 228 (197-264) | 194 (163-234) | <0.001 |
| Platelets transfusion | 0.51 | ||
| Yes | 55 | 30 | |
| No | 175 | 93 | |
| Fibrinogen-rich product† transfusion | 0.16 | ||
| Yes | 53 | 35 | |
| No | 177 | 88 | |
| Insulin until reperfusion (UI) | 0 (0-0) | 0 (0-0) | 0.78 |
| Surgical Time (min) | 345 (300-400) | 350 (300-400) | 0.35 |
| Anhepatic phase (min) | 55 (45-70) | 60 (45-77) | 0.04 |
| Cold ischemia time (min) | 410 (345-500) | 405 (340-503) | 0.94 |
| Warm ischemia time (min) | 30 (25-40) | 30 (27-40) | 0.99 |
Median (interquartile range 25-75).
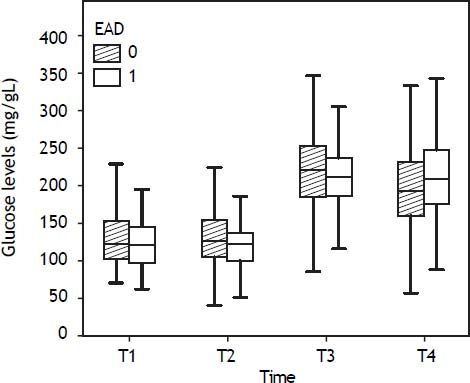
The overall incidence of early dysfunction (EAD) was 26% (114 of all LT showed EAD and 322 did not). By donor type, the incidence of EAD was 24% for DBD 58% for DCD, and 23% for FAP. Glucose changes during the liver transplant according to EAD are shown in figure 3.

Glucose levels increased after reperfusion similarly in recipients who showed postoperative early graft dysfunction and in those who did not in all groups:
- •
85(58-110) mg/dL (66%) vs. 85 (61-115) mg/dL (67%) in DBD,
- •
9 (-11, 24) mg/dL (6%) vs. 26(-3, 63) mg/dL (20%) in DCD, and
- •
126 (63-191) mg/dL (102%) vs. 133 (90-173) mg/dL (96%) in FAP, all p < 0.05.
Maximum glucose levels achieved after reperfusion were similar between recipients with and without EAD in all groups. However, DBD and DCD recipients with EAD showed slightly lower glucose values after reperfusion than those without EAD: 211 (185-238) vs. 222(185-265) mg/dL for DBD and 153 (136-182) vs. 179 (154-195) for DCD, respectively, but these differences were not significant (p > 0.05).
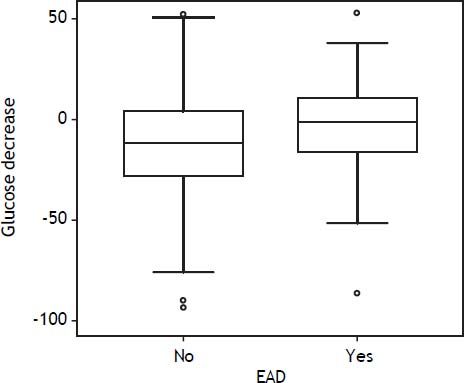
DBD recipients with bad glucose control (glucose at end of surgery > glucose after reperfusion) showed EAD more frequently than those with good glucose control: 31% vs. 19%, respectively (p = 0.01). From after reperfusion until the end of the procedure, glucose levels did not decrease in recipients with EAD, whereas it decreased by 11% in those without EAD (Figure 4). There were no differences in glucose control in DCD and FAP recipients with or without EAD.

Additionally, glucose control showed, although moderately, an inverse correlation with hyperglycemia after reperfusion: the highest glucose values after reperfusion were associated with the highest reduction in glucose levels at the end of surgery (rho Spearman -0.36, p < 0.001).
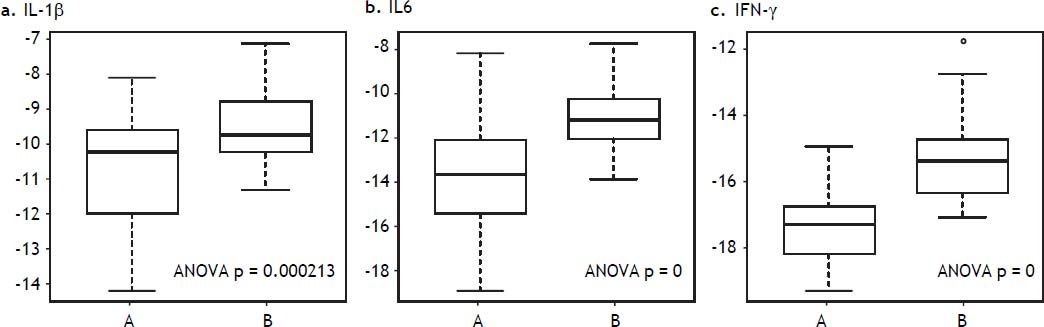
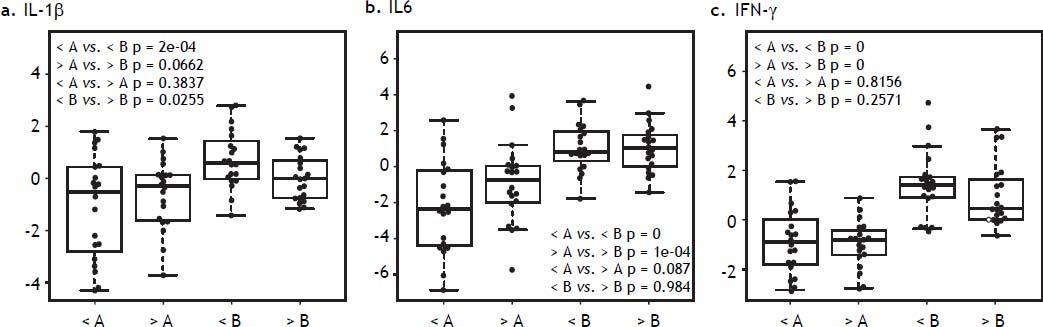
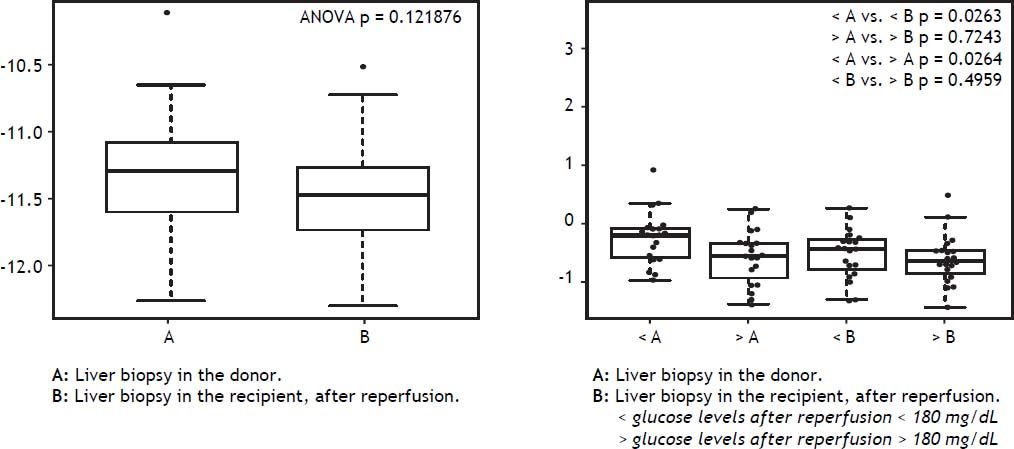
Hyperglycemia and inflammatory markers in liver tissue in DBD recipientsLiver tissue samples were first analyzed together before and after reperfusion, independently of glucose levels. All inflammatory markers (IFN-γ, IL1β, and IL6) increased significantly after reperfusion (Figure 5). When samples were analyzed according to after reperfusion glucose level (< or > 180 mg/ dL), those grafts with glucose level > 180 mg/dL showed no significant increase in IL-1β. A trend towards a higher increase in IFN-γ and IL-6 was observed in the grafts with the lowest glucose values after reperfusion (Figure 6). No changes were observed in caspase-3 gene expression after reperfusion when samples were taken together but recipients with the lowest glucose values after reperfusion displayed the highest levels of caspase-3 in the donor tissue sample (Figure 7).


IL-1β, IL-6, and IFN-γ gene expression in liver biopsy before and after reperfusion vs. glucose after reperfusion. A. Liver biopsy in the donor. B. Liver biopsy in the recipient, after reperfusion. < glucose levels after reperfusion < 180 mg/dL. > glucose levels after reperfusion > 180 mg/dL.

Glucose levels increased after graft reperfusion to a different extent according to the donor type; the highest increase was observed in FAP recipients and the lowest increase in DCD recipients. In a logistic regression analysis, glucose levels during the anhepatic phase and after the reperfusion phase emerged as the only modifiable independent predictors of glucose level after reperfusion and at the end of surgery, respectively. There was no relation between the increase in either glucose level after reperfusion or the maximum glucose levels achieved after reperfusion and the early graft function; however the inability to control the glucose level after reperfusion was associated with early graft dysfunction.
The increase in glucose levels after reperfusion was broadly different between DCD (12%) and FAP (96%) grafts, which displayed large differences in organ procurement and graft quality. Animal studies have evidenced that the increase in plasma glucose levels comes from the glycogen storage of the liver tissue, stained by the PAS method.13–15 DCD grafts, which show the lowest glucose levels after reperfusion, suffer from warm ischemia before the organ recovers;16 it is well known that glycogen depletion is higher under warm than under cold ischemia (0.15 vs. 5.5%), so intense depletion of glycogen during warm ischemia could explain the lowest glucose levels after reperfusion in DCD recipients. By contrast, FAP recipients, who show the highest glucose levels after reperfusion, do not suffer warm ischemia;17 less glycogen degradation is required to survive during the ischemic period, so more glycogen remains available as glucose to be released after reperfusion.18 Studies in humans have suggested that a well-glycogenated liver is protected from ischemic injury and that glycogen repletion before harvesting improves the outcome of liver transplantation.18,19 Hepatic glycogen content was not measured in this study; several factors influence liver function but, taking into account the rate of graft dysfunction of DCD (58%) and FAP (23%) recipients, it seems reasonable to suggest a link between glucose levels after reperfusion and postoperative liver function. Reasserting this concept, glucose levels after reperfusion tended to be lower in DBD recipients with EAD than in DBD recipients without EAD, but the difference was not significant.
High glucose levels after reperfusion did not have a negative impact on early liver function as no association between hyperglycemia after reperfusion and worse graft outcome was found. Several studies have documented detrimental effects of hyperglycemia exacerbating the ischemic injury.20,21 Deleterious effects of hyperglycemia in the context of ischemia-reperfusion injury are highly feasible but timing of hyperglycemia in relation to the ischemic injury seems to be crucial for the increased injury observed. Also, experimental data suggest that transient hyperglycemia may be less harmful than chronic hyperglycemia.22,23 It is noteworthy that hyperglycemia was transient in the present study, because the glucose levels in the ICU in our institution are kept strictly at the recommended values; therefore, the effect of sustained hyperglycemia, which clearly predisposes to an exaggerated inflammatory response, was not assessed.
Glucose control, a known biological marker of good liver function in the transplant setting,4 was better in recipients with higher glucose levels after reperfusion. This finding is in accordance with previous studies.24 Persistent hyperglycemia after reperfusion is related to reduced glucose intake as a result of warm ischemic damage and may be an early marker of impaired graft function. Moreover, better glucose control in DBD recipients was moderately associated with higher glucose levels after reperfusion, supporting the aforementioned relation between glucose levels after reperfusion and postoperative liver function.
Glucose level is a matter of concern during liver transplantation for several reasons: it is difficult to control, many clinical studies have demonstrated the efficacy of strict glucose control improving the outcome of postoperative or emergency patients1,2 and, additionally, intraoperative hyperglycemia during liver transplantation is associated with an increased risk of postoperative infection and mortality.5 On the other hand, the benefit of strict glycemic control during surgery may have resulted in a greater frequency of hypoglycaemia. Moreover, intensive intraoperative insulin therapy did not reduce death or morbidity when added to strict postoperative glucose control during cardiac surgery, which raises reasonable doubts about its benefits (ref Gandhi).
We therefore built a predictive model of hyperglycemia after reperfusion and a predictive model of glucose control from after reperfusion until the end of surgery. Our predictive models involve donor and recipient variables, of which the only modifiable ones are the glucose levels during the anhepatic and postreperfusion phases. Our results are in accordance with the concept that reducing the variability of blood glucose concentration plays an important role in glucose management25 and suggest that accurate intraoperative glucose control is advisable. Closed loop systems have recently proved to be the best option for intraoperative glucose control in this setting.26
As expected, inflammatory markers increased after graft reperfusion but, interestingly, the increase tended to be higher in the grafts that achieved the lowest glucose values at this time, a finding which rules out an exacerbating effect of transient hyperglycemia on inflammatory injury. The highest levels of caspase-3 found in the first biopsy of grafts with the lowest glucose values after reperfusion could reflect a worse condition in these grafts. It is well known that post ischemic-reperfusion apoptotic damage plays a pivotal role in post ischemia-reperfusion injury organ failure;27 consequently, caspase-3 is a good marker of cell and organ conditions. Our results support cell viability as a link between graft function and glucose levels after reperfusion.
This is a retrospective study with several limitations. The main one is the multifactorial origin of the graft dysfunction: causality cannot be provided and only associability is evidenced. However, contrary to general belief, transient hyperglycemia after reperfusion does not seem to impact negatively on the liver graft function and could even be suggested as a marker of graft quality.
Abbreviations- •
DBD: donor after brain death.
- •
DCD: donor after cardiac death.
- •
EAD: early dysfunction.
- •
FAP: familial amyloidotic polyneuropathy.
- •
IFN-γ: interferon gamma.
- •
IL-1β: interleukin 1 beta.
- •
IL-6: interleukin 6.
- •
LT: liver transplant.
- •
T1: baseline.
- •
T2: anhepatic phase.
- •
T3: twenty minutes after graft reperfusion.
- •
T4: end of surgery.
Fondo de investigación sanitaria. Instituto Carlos III. Ministerio de Ciencia e Innovación (Government of Spain). Grant number reference: PI10/ 00759.
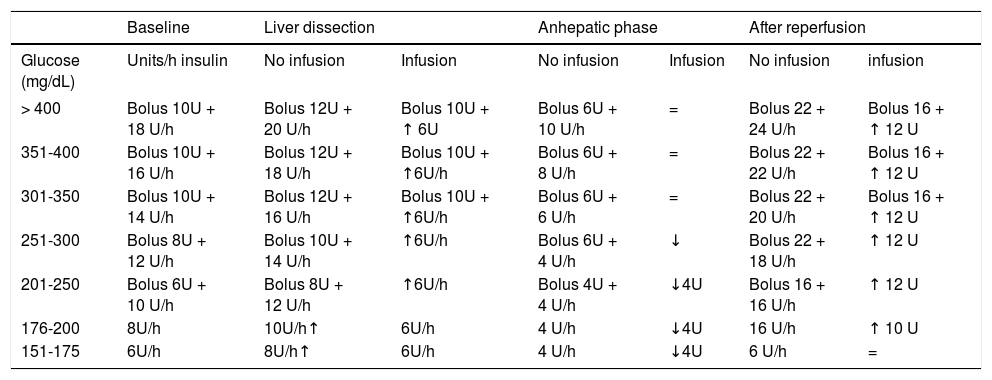
Appendix. Intraoperative liver transplant insulin protocol. Hospital Clinic Barcelona.- 1.
Target glucose < 1 50 mg/dL. Start treatment when glucose > 150 except during the anhepatic phase.
- 2.
Glucose determination every hour if insulin infusion.
- 3.
Diabetic patients will receive 4 more units (bolus and infusion).
- 4.
If glucose < 1 50 mg/dL, stop infusion and measurement of glucose levels.
| Baseline | Liver dissection | Anhepatic phase | After reperfusion | ||||
|---|---|---|---|---|---|---|---|
| Glucose (mg/dL) | Units/h insulin | No infusion | Infusion | No infusion | Infusion | No infusion | infusion |
| > 400 | Bolus 10U + 18 U/h | Bolus 12U + 20 U/h | Bolus 10U + ↑ 6U | Bolus 6U + 10 U/h | = | Bolus 22 + 24 U/h | Bolus 16 + ↑ 12 U |
| 351-400 | Bolus 10U + 16 U/h | Bolus 12U + 18 U/h | Bolus 10U + ↑6U/h | Bolus 6U + 8 U/h | = | Bolus 22 + 22 U/h | Bolus 16 + ↑ 12 U |
| 301-350 | Bolus 10U + 14 U/h | Bolus 12U + 16 U/h | Bolus 10U + ↑6U/h | Bolus 6U + 6 U/h | = | Bolus 22 + 20 U/h | Bolus 16 + ↑ 12 U |
| 251-300 | Bolus 8U + 12 U/h | Bolus 10U + 14 U/h | ↑6U/h | Bolus 6U + 4 U/h | ↓ | Bolus 22 + 18 U/h | ↑ 12 U |
| 201-250 | Bolus 6U + 10 U/h | Bolus 8U + 12 U/h | ↑6U/h | Bolus 4U + 4 U/h | ↓4U | Bolus 16 + 16 U/h | ↑ 12 U |
| 176-200 | 8U/h | 10U/h↑ | 6U/h | 4 U/h | ↓4U | 16 U/h | ↑ 10 U |
| 151-175 | 6U/h | 8U/h↑ | 6U/h | 4 U/h | ↓4U | 6 U/h | = |


