


Despite the huge clinical burden of MASLD, validated tools for early risk stratification are lacking, and heterogeneous disease expression and a highly variable rate of progression to clinical outcomes result in prognostic uncertainty. We aimed to investigate longitudinal electronic health record-based outcome prediction in MASLD using a state-of-the-art machine learning model.
Patients and Methodsn=940 patients with histologically-defined MASLD were used to develop a deep-learning model for all-cause mortality prediction. Patient timelines, spanning 12 years, were fully-annotated with demographic/clinical characteristics, ICD-9 and -10 codes, blood test results, prescribing data, and secondary care activity. A Transformer neural network (TNN) was trained to output concomitant probabilities of 12-, 24-, and 36-month all-cause mortality. In-sample performance was assessed using 5-fold cross-validation. Out-of-sample performance was assessed in an independent set of n=528 MASLD patients.
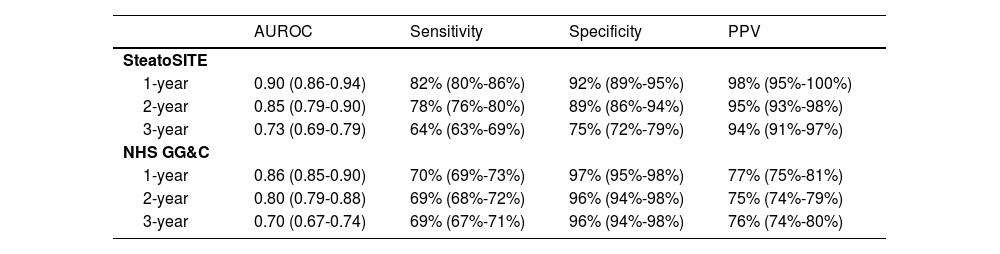
ResultsIn-sample model performance achieved AUROC curve 0.74-0.90 (95% CI: 0.72-0.94), sensitivity 64%-82%, specificity 75%-92% and Positive Predictive Value (PPV) 94%-98%. Out-of-sample model validation had AUROC 0.70-0.86 (95% CI: 0.67-0.90), sensitivity 69%-70%, specificity 96%-97% and PPV 75%-77%. Key predictive factors, identified using coefficients of determination, were age, presence of type 2 diabetes, and history of hospital admissions with length of stay >14 days.
ConclusionsA TNN, applied to routinely-collected longitudinal electronic health records, achieved good performance in prediction of 12-, 24-, and 36-month all-cause mortality in patients with MASLD. Extrapolation of our technique to population-level data will enable scalable and accurate risk stratification to identify people most likely to benefit from anticipatory health care and personalized interventions.
Metabolic dysfunction-associated steatotic liver disease (MASLD), previously termed nonalcoholic fatty liver disease (NAFLD) [1,2], is defined as the presence of hepatic steatosis in conjunction with at least one cardiometabolic risk factor (obesity, hypertension, type 2 diabetes, dyslipidemia) but no discernible secondary causes, including substantial alcohol intake, medications known to cause steatosis, or inherited metabolic conditions [3,4]. Around 25% of people with hepatic steatosis progress to metabolic dysfunction-associated steatohepatitis (MASH), which is characterized by hepatocellular ballooning and lobular necroinflammation, and an increased risk of fibrosis, cirrhosis, hepatic decompensation, hepatocellular carcinoma (HCC), and all-cause mortality [3]. The global burden of MASLD is increasing at an alarming rate [5], with a worldwide prevalence of up to 32.4% [6]. The health economic impacts of MASLD are considerable, including annual direct medical costs of $103 billion ($1,613 per patient) in the United States (US) and €35 billion (€1,163 per patient) in the Europe-4 countries (Germany, France, Italy, and the United Kingdom) [7].
Although the past four decades have witnessed major advances in the biological understanding of MASLD and the mechanisms driving the pathogenesis of cirrhosis and HCC, there has been little translation to improved clinical outcomes [8]. This can be explained, in part, by the lack of approved therapy [9] and the heterogeneous natural history of the MASLD, which includes extra-hepatic manifestations such as cardiovascular disease (CVD) and chronic kidney disease (CKD) that can further increase disease burden and contribute to the risk of all-cause mortality [10]. Indeed, in many series, the leading cause of death in individuals with MASLD is CVD, followed by extra-hepatic cancers, and then liver-related mortality [11], highlighting the importance of a holistic approach to the management of this patient population. Moreover, there is an urgent need to embed effective strategies within primary care, as well as hepatology services, to enable early risk stratification and evidence-based treatment initiation to curtail MASLD-associated morbidity and mortality.
The increased availability of electronic health records (EHRs) opens new opportunities to develop predictive case-finding algorithms that facilitate effective MASLD surveillance [12]. EHR adoption has reached near-universal levels in the US and the European Union in both acute care hospitals and primary care [13]. Moreover, studies have shown the potential utility of applying artificial intelligence (AI) and machine learning (ML) algorithms to EHR data to improve the early detection, diagnosis, and management of many conditions, particularly cardiometabolic diseases [14,15]. However, despite the proliferation of machine-readable datasets, the development and scaling of predictive models have been limited. The complexities of real-world clinical data, replete with thousands of potential predictor variables and missing values, are seen as the key barriers to implementation [16-18]. Deep neural networks (DNNs) have emerged as robust tools with applications to sequence prediction within mixed modality data sets [17-20]. The key advantages of DNN methods are their ability to handle large volumes of relatively noisy data, including errors in labels, as well as large numbers of input variables [18].
Because liver-related outcomes in MASLD are strongly associated with the severity of liver fibrosis [21,22], existing risk stratification is anchored to the histological stage or non-invasive assessment of fibrosis using surrogate markers [23-25], but such approaches may not reflect the complexity and multimorbidity of MASLD. Furthermore, despite the increasing application of AI and ML tools to MASLD disease management, predictive analysis has largely focused on diagnosis and screening [26,27], as well as disease quantification [28,29]. Therefore, there is a critical need for a reliable and accessible risk stratification approach for broad clinical outcomes of interest, such as all-cause mortality, to enable early/proactive community interventions such as lifestyle adjustments and future care planning.
In this work, we test the hypothesis that a simple Transformer neural network, trained on routinely collected in-patient and out-patient data from people with MASLD, can be used effectively to predict individuals at an increased risk of all-cause mortality.
2Patients and Methods2.1Study populationsThe SteatoSITE retrospective dataset was drawn from a population representing 12 of the 14 territorial Health Boards in Scotland and consists of n=940 histologically defined patients (55.4% men and 44.6% women; median body mass index 31.3; 32% with type 2 diabetes) covering the complete MASLD severity spectrum. Detailed characteristics of the SteatoSITE cohort have been published [30]. For the validation study, a nested case-control design was used on an independent non-biopsy MASLD patient population (n=528 patients) from NHS Greater Glasgow and Clyde (GG&C) collected between 2002 and 2021.
For SteatoSITE, cases with a liver tissue sample acquired between January 2000 and October 2019 and a histological diagnosis of NAFLD (MASLD) were included. The other inclusion/exclusion criteria were: men or women; >18 years of age at the time of tissue sampling; all ethnic groups, socio-economic backgrounds, and health status; dead or alive at the time of inclusion into data commons; no documented history of chronic liver disease of any non-MASLD etiology, including alcohol-related liver disease, chronic viral hepatitis, hemochromatosis, Wilson disease, autoimmune hepatitis, primary biliary cholangitis, primary sclerosing cholangitis; and patients with excessive alcohol use documented within the clinical data supplied on the specimen request form (>21 units/week for men, >14 units/week for women); or histological features suggesting a secondary non-MASLD diagnosis.
The SteatoSITE dataset was used for model training and in-sample validation using five-fold cross-validation. During each cross-validation run, the dataset was partitioned into training, validation, and testing subsets such that the distribution of age, gender, and outcomes were stratified across each partition. To avoid data leakage across data partitions, we ensured that there were no overlapping patient identifiers.
The NHS GG&C dataset comprised of patient EHRs obtained between 2000 and 2019 and followed similar inclusion and exclusion criteria to SteatoSITE, although the clinical diagnosis was based on the International Classification of Diseases – Tenth Revision (ICD-10) codes (K76.0 [NAFLD, all] and K75.8 NASH). The NHS GG&C dataset was used for out-of-sample model validation.
Notably, ICD diagnostic coding for inpatient and outpatient episodes and procedures (OPCS Classification of Interventions and Procedures (OPCS-4)) for both study populations followed recent expert consensus guidelines for using administrative coding in EHR-based research of MASLD [31].
We categorized the cause of death based on the methods used by Simon et al. [32]. The following ICD-10 and OPCS-4 codes were used for the cause-specific categories: HCC ('C22′, 'C220′, 'C229′, 'C2299′); cirrhosis (Y830, T864, K74, K72, K767, I8* (includes other decompensation causes and post-transplant complications)); non-HCC cancer (any C code apart from those for HCC); cardiovascular disease (any I code apart from I8* (varices)); other (none of the above). Additionally, we filtered sequentially down the hierarchy of cause of death information and used the first non-other code that appeared.
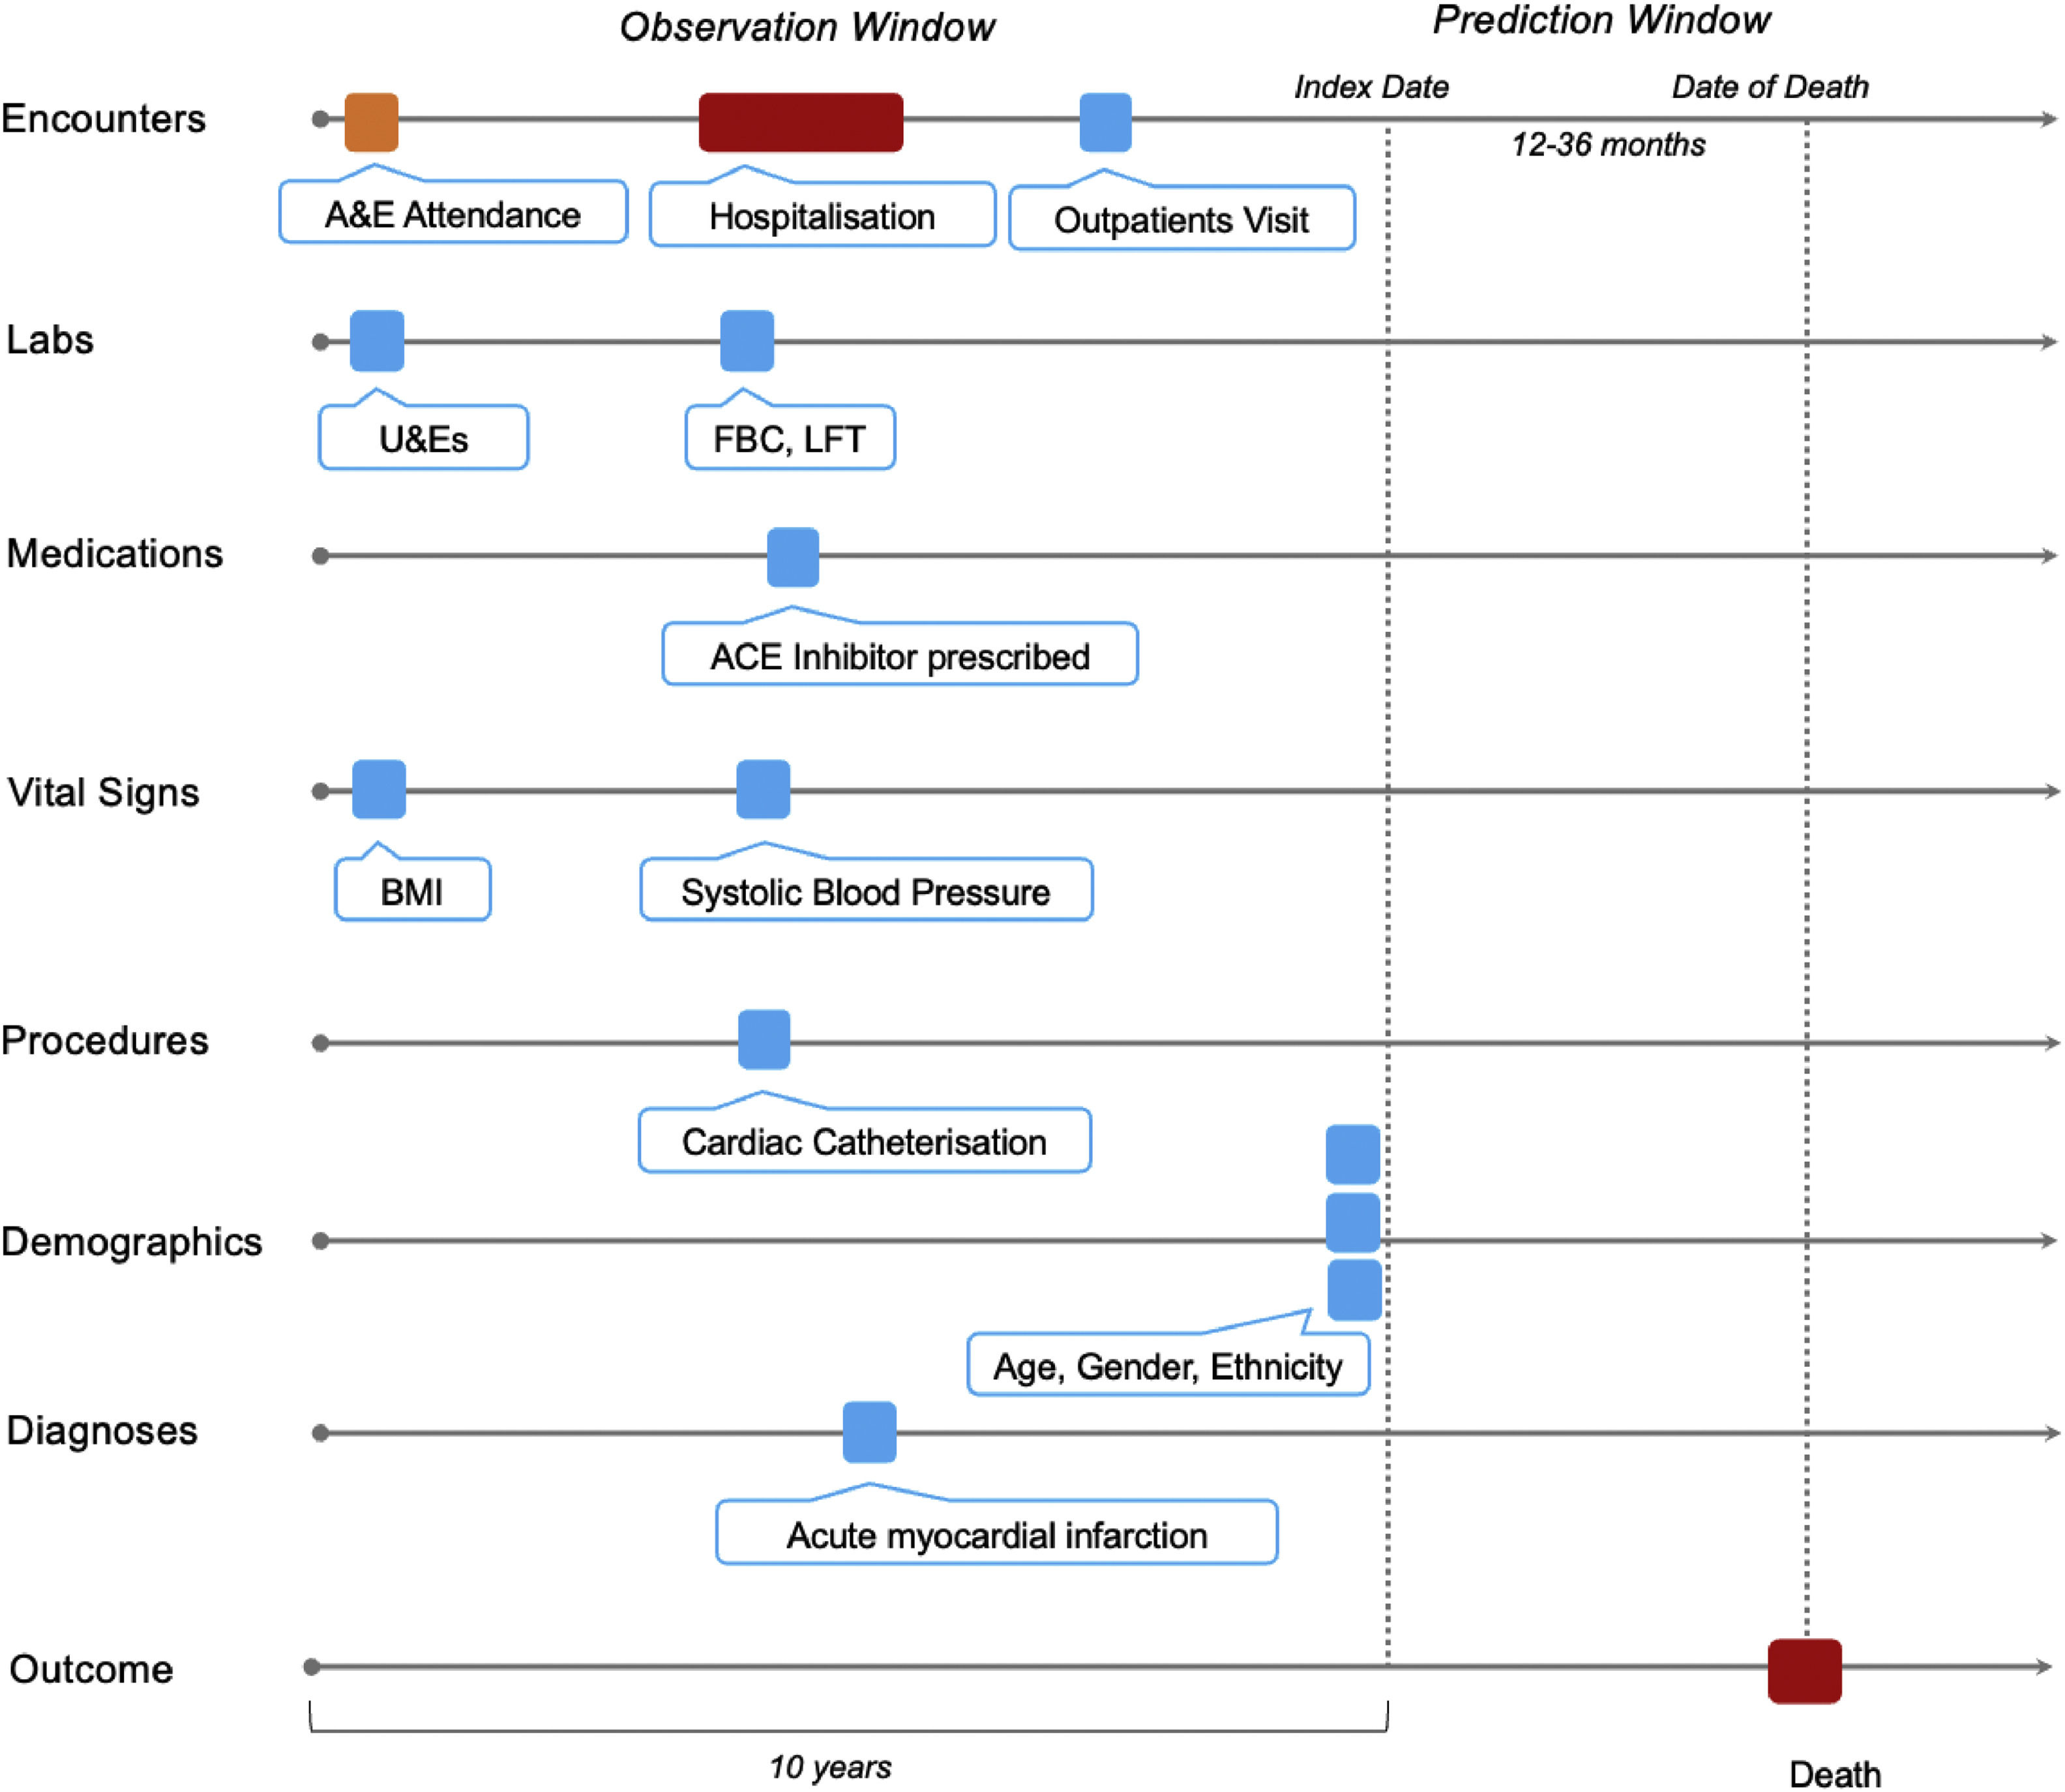
2.2Data representation and ground truthingEach patient's longitudinal EHR vector was split into an Observation and Prediction Window (Fig. 1). The Index Date for case patients was calculated as the date 12, 24, or 36 months before the patient's date of death. The Index Date for controls was calculated as the date 12, 24, or 36 months before the last EHR entry. The Observation Window comprised all EHR vectors during a ten-year period in the run-up to the Index Date. Only data in the Observation Window was used to represent the patient during model training, validation, and testing.
, whilst a binary outcome of all-cause mortality was used as a ground truth. A&E, emergency department; U&Es, urea and electrolytes; FBC, full blood count, LFT, liver function tests; ACE inhibitor, angiotensin-converting enzyme inhibitor; BMI, body mass index.")
Schematic representation of an EHR vector. The patient's timeline is represented by horizontal arrows and each data point is depicted by colour-coded tokens. Predictive models were trained on the data in the Observation Window (10 years), whilst a binary outcome of all-cause mortality was used as a ground truth. A&E, emergency department; U&Es, urea and electrolytes; FBC, full blood count, LFT, liver function tests; ACE inhibitor, angiotensin-converting enzyme inhibitor; BMI, body mass index.
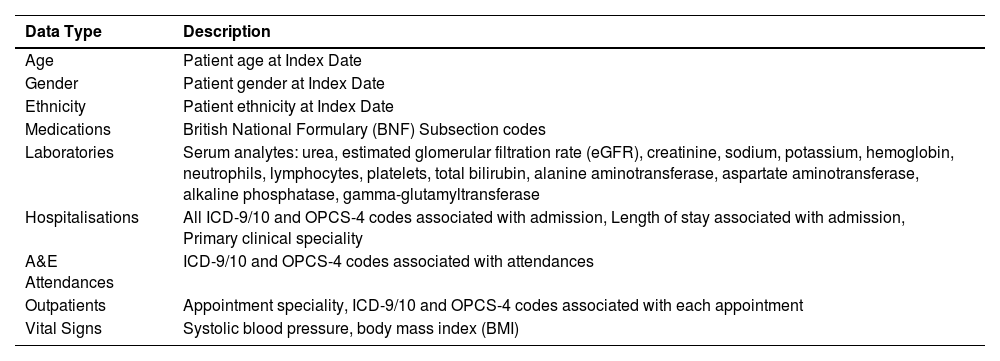
Patient features used in predictive modelling are shown in Table 1. For each patient, two feature vector representations were generated. The first representation consisted of static features – age, gender, and ethnicity. The second representation reflected dynamic features associated with inpatient and outpatient activity over a five-year period of the Observation Window. This temporal input vector was discretized into twelve exponentially increasing time bins, such that the most recent time points were assigned to the shortest time bin. If a feature (e.g., ICD-10 codes) within an Observation Window contained multiple values, the most frequent value was retained. In cases where a numerical feature (e.g., BMI) contained multiple entries within one observation window, an average was calculated. Missing values were filled by forward propagation.
Features of the patient EHR used as inputs into the predictive model.
Numerical data was scaled to a range between 0 and 1, whilst categorical data was represented as 32-dimensional vectors of a large pre-trained language model trained on n=2,067,531 full text PubMed articles totalling n=224,427,218 sentences [33,34].
2.3Model trainingGiven significant variation in length and density of patient records (e.g., vital sign measurements in an intensive care unit vs. outpatient clinic), we formulated a simple Transformer architecture with multi-head attention [35], to take advantage of such data.
Input layers of the Transformer network were adjusted to concurrently use time-invariant and time-dependent features. Multiple inputs were concatenated along a horizontal axis and passed to four transformer encoder blocks with multi-head attention. Four attention heads were used with head size fixed at 256. The classification head of the network consisted of a global average pooling layer, followed by a dense layer with rectified linear unit [36] activation and a dropout layer. A softmax activation function was applied to the final dense layer.
The number of neurons in the penultimate dense layer and the dropout rate were tuneable hyperparameters optimized during training using the Hyperband algorithm [37], with the best set of parameters corresponding to the lowest sparse categorical cross-entropy loss on the validation set. The number of neurons was selected from the range of [32, 512], and the dropout rate took values from the range [0, 0.2].
Training was performed with batch size of 512 using an Adam optimizer with a learning rate of 1 × 10⁻⁴ while minimizing the categorical cross-entropy loss.
The network was trained to output probabilities of mortality following 12-, 24-, and 36-month prediction windows. Training was terminated early if validation loss did not improve after ten consecutive epochs.
2.4Statistical analysisModel performance was assessed using the area under the receiver operating characteristic (AUROC) curve, overall accuracy, sensitivity, specificity, and positive predictive value (PPV). For AUROC measures, 95% confidence intervals (CIs) were calculated empirically using 2,000 bootstrap samples. CIs for sensitivity, specificity, and positive predictive value are exact Clopper-Pearson CIs. Patient demographics were compared across the training/validation, internal testing, and clinical evaluation sets using ANOVA for continuous variables and Chi-square for categorical variables. p-values < 0.05 were considered as statistically significant.
Dimensionality reduction was performed using the Ivis algorithm [38]. Briefly, prior to analysis, categorical variables were one-hot encoded, whilst numerical variables were scaled to values between 0 and 1. The dataset was reduced to two components using the ‘maaten’ twin neural network architecture and default Ivis hyperparameter values. To identify the salient features captured by the Transformer model, we calculated the coefficient of determination (R2) between low-dimensional representations of the model global average pooling layer and training set features. Where categorical features were used, their numerical representation was extracted from the model's feature embedding layer.
Model probabilities were evaluated using the reliability diagram [39] and the calibration_curve function in the scikit-learn library [40]. Predicted probabilities were binned into ten discrete intervals, and the mean predicted probability and the true frequency of the positive class were plotted for each interval.
All statistical tests were carried out using the SciPy module (version 1.7.3) for Python (version 3.9.14).
2.5Ethical statementUnified transparent approval for unconsented data inclusion in the multimodal pan-Scotland SteatoSITE database [30] was provided by the West of Scotland Research Ethics Committee 4 (Reference: 20/WS/0002; 18th February 2020), Public Benefit and Privacy Panel for Health and Social Care (PBPP; Reference: 1819-0091; 4th June 2021), Institutional Research & Development departments and Caldicott Guardians. Delegated research and ethics approvals for the validation cohort study were granted by the Local and Advisory Committee at NHS Greater Glasgow and Clyde (NHS GG&C). The cohort and de-identified linked data were prepared by the West of Scotland Safe Haven at NHS GG&C. In Scotland, patient consent is not required where routinely collected patient data are used for research purposes through an approved Safe Haven. For that reason, informed consent was not required and was not sought. All research was conducted following both the Declarations of Helsinki (2013) and Istanbul (2018), and Good Clinical Practice principles. This study was conducted and reported in accordance with the TRIPOD (Transparent Reporting of a multivariable prediction model for Individual Prediction or Diagnosis) guidelines.
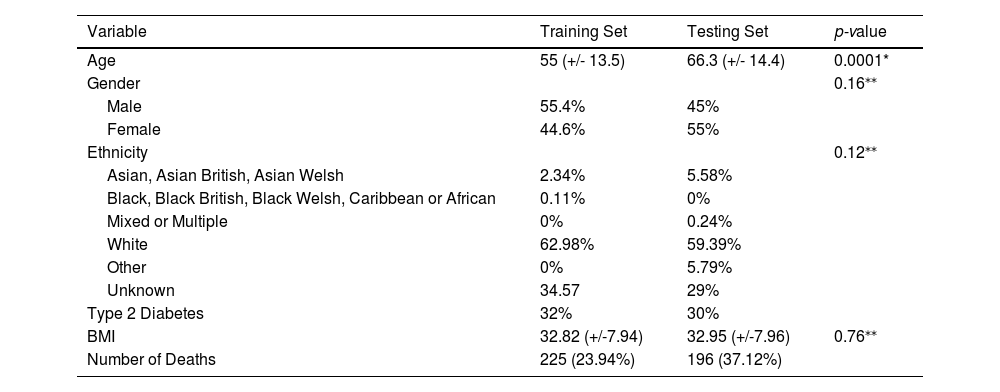
3Results3.1Training and testing dataset characteristicsDemographic and phenotypic characteristics of the training and testing cohorts are shown in Table 2. Patient age in the training set was significantly younger than the testing set (two-tailed unpaired t-test, p=0.0001), whilst there were no significant differences in BMI (two-tailed unpaired t-test, p=0.76) or the frequencies of gender or ethnicity distributions (chi-square, p=0.12-0.16).
Demographic characteristics of the training and testing sets.
| Variable | Training Set | Testing Set | p-value |
|---|---|---|---|
| Age | 55 (+/- 13.5) | 66.3 (+/- 14.4) | 0.0001* |
| Gender | 0.16⁎⁎ | ||
| Male | 55.4% | 45% | |
| Female | 44.6% | 55% | |
| Ethnicity | 0.12⁎⁎ | ||
| Asian, Asian British, Asian Welsh | 2.34% | 5.58% | |
| Black, Black British, Black Welsh, Caribbean or African | 0.11% | 0% | |
| Mixed or Multiple | 0% | 0.24% | |
| White | 62.98% | 59.39% | |
| Other | 0% | 5.79% | |
| Unknown | 34.57 | 29% | |
| Type 2 Diabetes | 32% | 30% | |
| BMI | 32.82 (+/-7.94) | 32.95 (+/-7.96) | 0.76⁎⁎ |
| Number of Deaths | 225 (23.94%) | 196 (37.12%) |
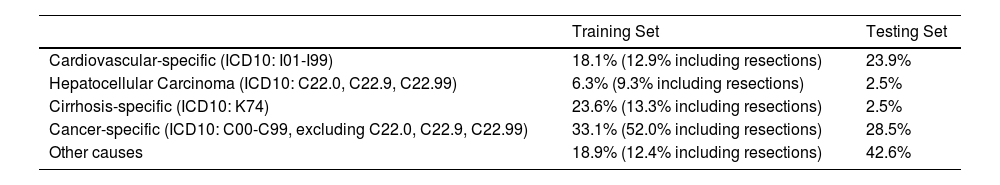
The most common cause of death in both the training and testing sets was extra-hepatic cancer (Table 3). In the training set (SteatoSITE), liver-related mortality (cirrhosis and HCC) was the second most common cause of death, followed by cardiovascular deaths, similar to the findings of a large nationwide cohort study of over 10,000 patients with biopsy-confirmed NAFLD [32]. In contrast, in the testing set (GG&C non-biopsy cohort) cardiovascular deaths were higher. This likely reflects the different composition of the respective populations. One was a secondary care cohort based on clinically indicated tissue sampling (biopsy, resection, or explant), so there is inherent spectrum bias towards cases with more severe liver disease, whereas the other represents a more generalizable MASLD cohort, reflected in the observed cause of death frequencies that are more consistent with data from other community-diagnosed population studies [41,42]. Notably, a substantial number of deaths did not fall into any of these categories and were classified as ‘other’.
Frequencies of the primary causes of death in the training and testing sets.
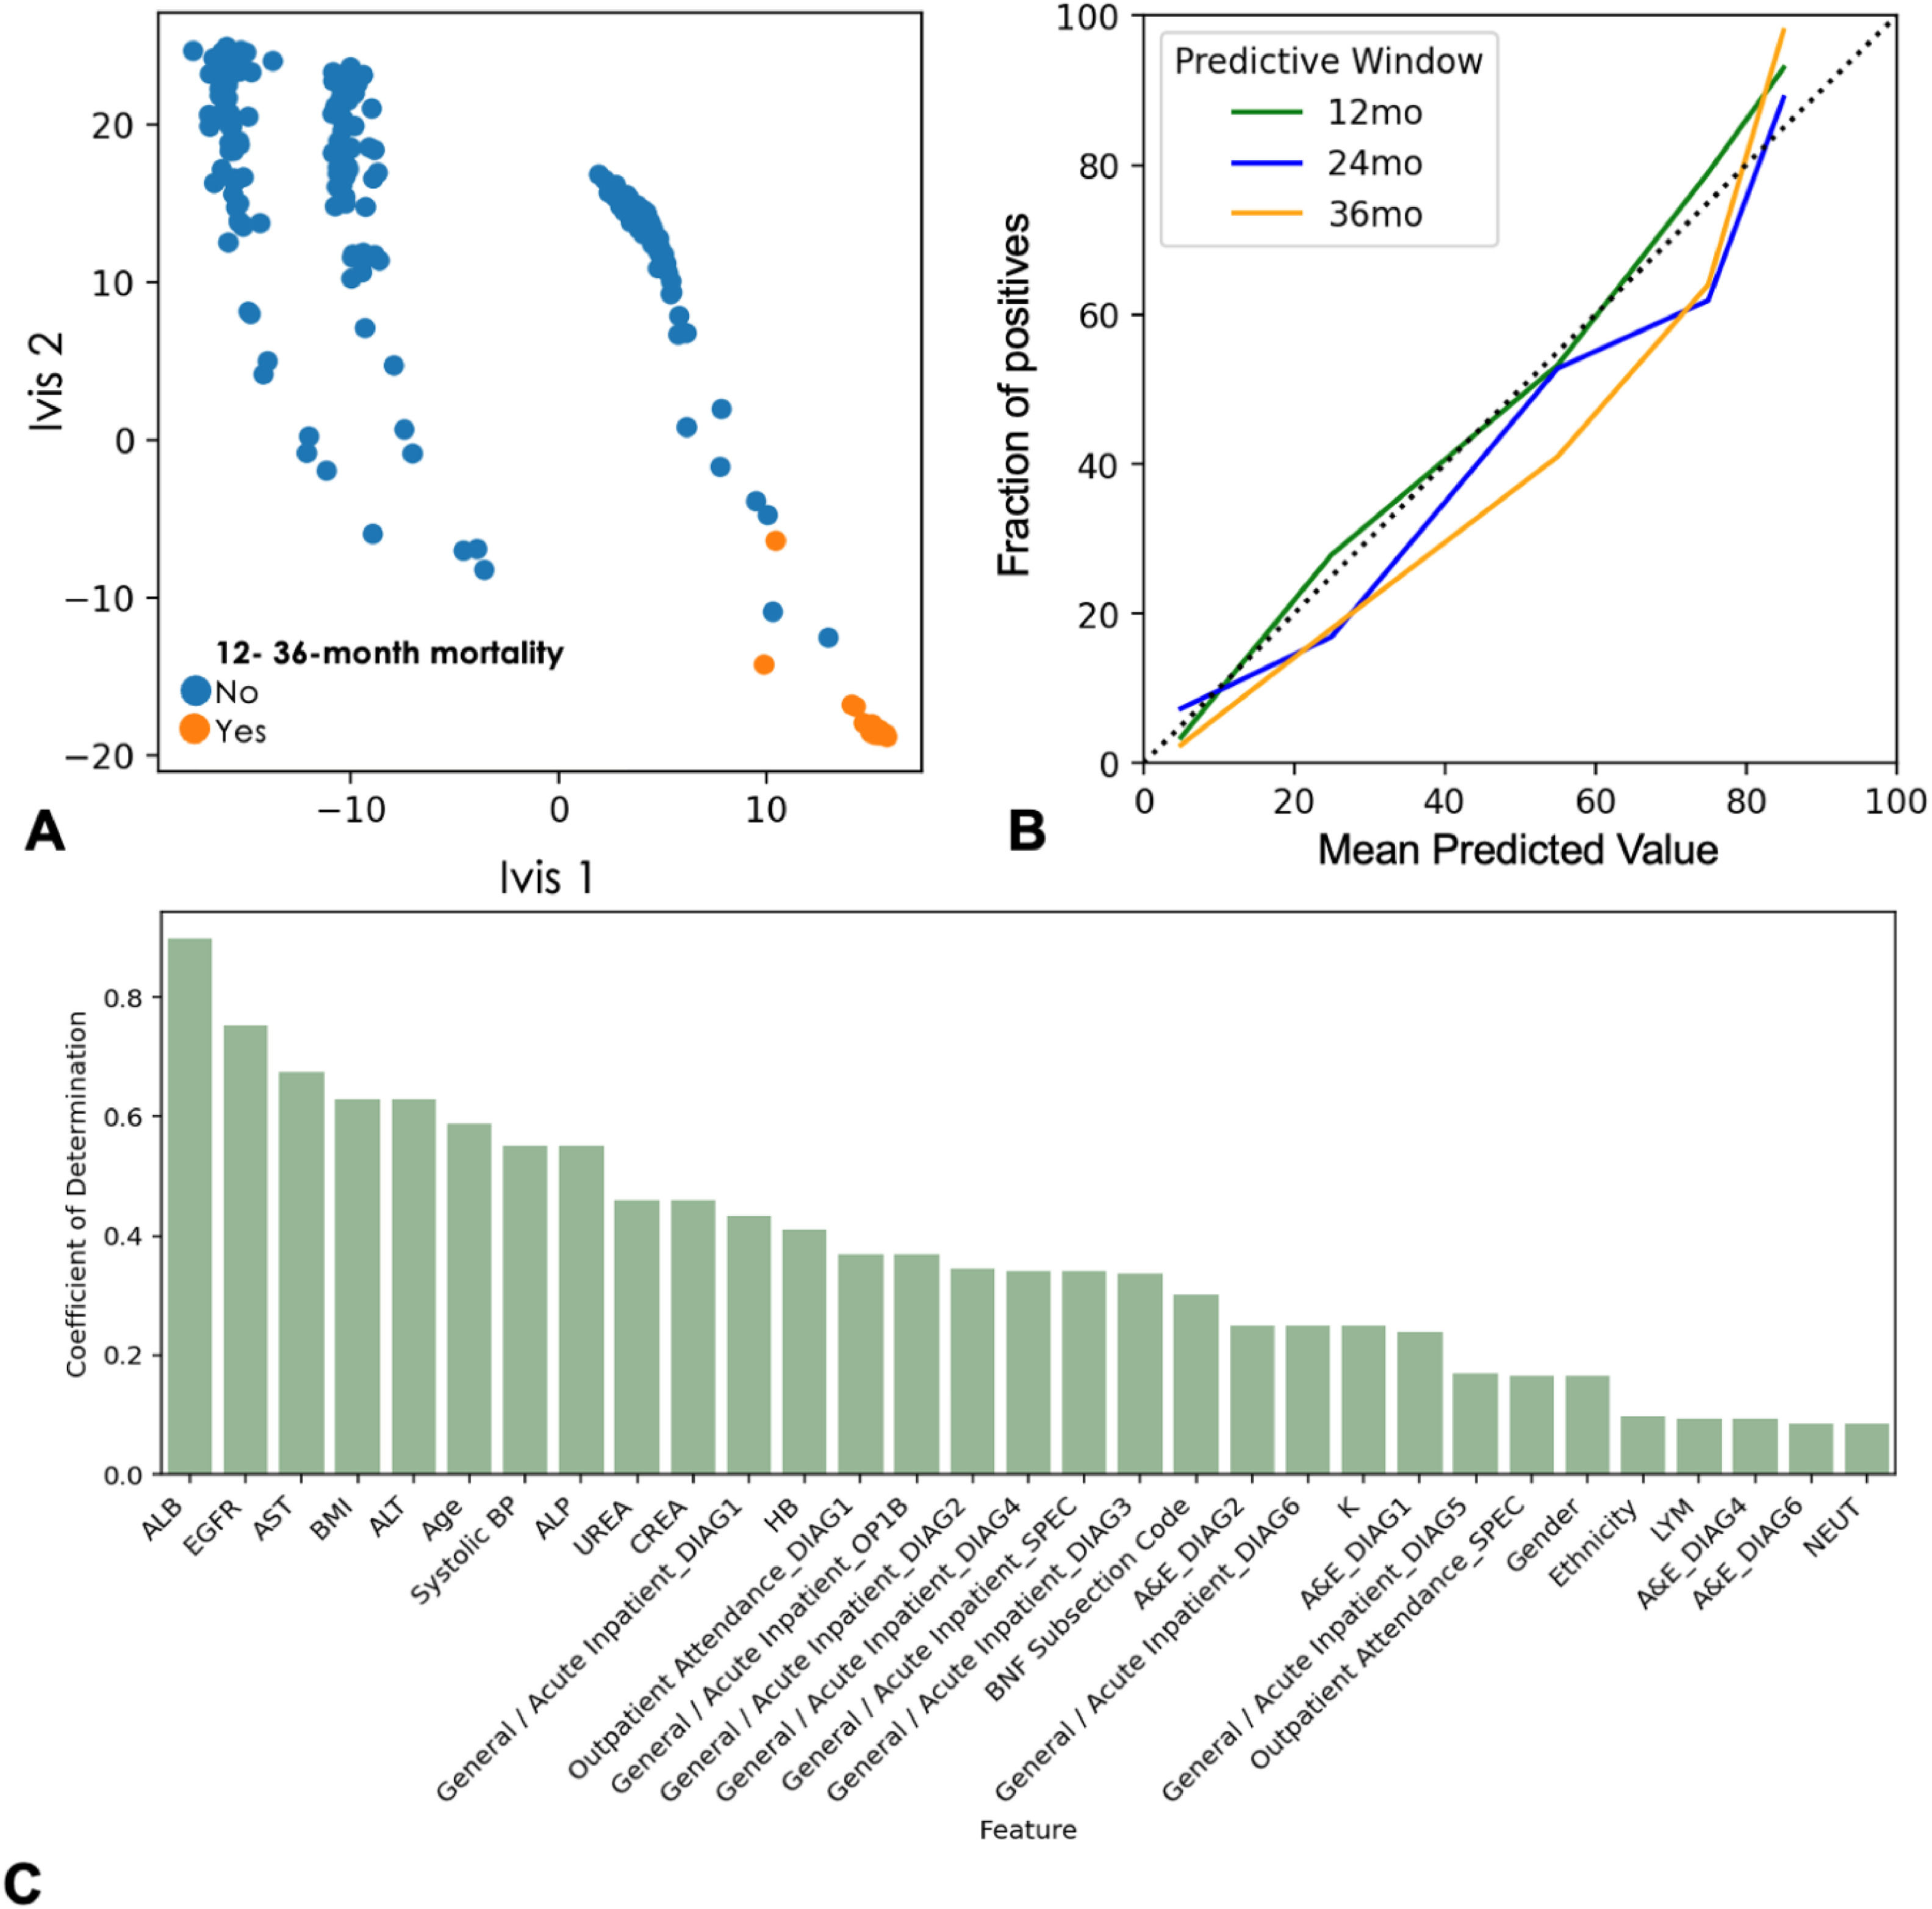
The Transformer neural network was trained and validated using five-fold cross-validation in the SteatoSITE dataset. Dimensionality reduction of the global average pooling layer confirmed the model's propensity to learn the target class (Fig. 2A). The model achieved an AUROC of 0.90 (95% CI: 0.86-0.94), 0.85 (95% CI: 0.79-0.90), and 0.73 (95% CI: 0.69-0.79) for the prediction of 12-, 24, and 36-month mortality, respectively.
 Scatterplot shows two-dimensional twin neural network (Ivis) embedding of the global average pooling layer values in the trained transformer neural network. Each point represents a single patient in the testing set. Blue and orange colours represent the presence and absence of all-cause mortality in a 12-36 month predictive window respectively. (B) Calibration plots demonstrating the relationship between average SteatoSITE cohort mortality probabilities and proportion of true positives within each probability bin. Green, blue, and orange lines reflect model outputs for 12-, 24-, 36-month predictive windows. C) Bar plot showing model input features and their respective coefficient of determination (R2) values. Values reflect variance within the global average pooling layer explained by each feature. ALB, albumin: EGFR, estimated glomerular filtration rate; AST, aspartate aminotransferase; BMI, body mass index; ALT, alanine aminotransferase; BP, blood pressure; ALP, alkaline phosphatase; CREA, creatinine; HB, hemoglobin; DIAG1, code for main diagnosis; DIAG2-4, codes for other diagnosis; OP1B, code for approach site/laterality of main procedure; SPEC, code for speciality; A&E, Accident and Emergency; BNF, British National Formulary; K, potassium; LYM, lymphocytes; NEUT, neutrophils.")
Transformer neural network performance in prediction of all-cause mortality in the SteatoSITE dataset. (A) Scatterplot shows two-dimensional twin neural network (Ivis) embedding of the global average pooling layer values in the trained transformer neural network. Each point represents a single patient in the testing set. Blue and orange colours represent the presence and absence of all-cause mortality in a 12-36 month predictive window respectively. (B) Calibration plots demonstrating the relationship between average SteatoSITE cohort mortality probabilities and proportion of true positives within each probability bin. Green, blue, and orange lines reflect model outputs for 12-, 24-, 36-month predictive windows. C) Bar plot showing model input features and their respective coefficient of determination (R2) values. Values reflect variance within the global average pooling layer explained by each feature. ALB, albumin: EGFR, estimated glomerular filtration rate; AST, aspartate aminotransferase; BMI, body mass index; ALT, alanine aminotransferase; BP, blood pressure; ALP, alkaline phosphatase; CREA, creatinine; HB, hemoglobin; DIAG1, code for main diagnosis; DIAG2-4, codes for other diagnosis; OP1B, code for approach site/laterality of main procedure; SPEC, code for speciality; A&E, Accident and Emergency; BNF, British National Formulary; K, potassium; LYM, lymphocytes; NEUT, neutrophils.
Binarizing predicted cases and controls using an operating point of probability of mortality ≥ 50%, resulted in sensitivity of 64%-82% (95% CI: 69%-94%) specificity of 75%-92% (95% CI 72%-95%), and PPV of 94-98% (95% CI: 91%-100%). Model probabilities were well calibrated, with a Pearson's R2-values of 0.94-0.99 (two-sided p-value = 9.9 × 10⁻⁴ – 8.3 × 10⁻², Fig. 2B).
Model performance generalized well to the out-of-sample dataset, with AUROCs of 0.86 (95% CI: 0.85-0.90), 0.80 (95% CI: 0.79-0.88), and 0.70 (95% CI: 0.67-0.74) for prediction of mortality after 12, 24, and 36 months respectively. Binarizing predicted cases and controls using an operating point of probability of mortality ≥ 50%, resulted in sensitivity of 69-70% (95% CI: 67%-75%), specificity of 96-97% (95% CI 94%-98 %), and PPV of 75%-77% (95% CI: 74%-81%) (Table 4).
Model performance metrics across internal training and external testing sets. Model operating point was set to ≥50% (probability of all-cause mortality). 95% CIs are shown in parentheses. AUROC = Area under Receiver Operating Characteristic Curve.
Coefficients of Determination (see Methods) were calculated for every input feature. Features that correlated the most with the global average pooling layer of the model were serum albumin (R2=0.89), estimated glomerular filtration rate (R2=0.75), and aspartate aminotransferase (AST) levels (R2=0.67), as well as BMI (R2=0.63), age at index date (R2=0.58), and systolic blood pressure (R2=0.55) (Fig. 2C).
Model misclassifications in the out-of-sample testing set were interpretable. For example, at 36-month probability of mortality ≥ 50%, the model identified n=49 false positive cases. Of these, n=11 patients (22.4%) and n=13 (26.5%) had recent diagnoses (within twelve months) of ‘acute myocardial infarction’ (I21.9) and ‘atherosclerotic heart disease of native coronary artery’ (I25.1). Furthermore, n=22 (44.9%), n=9 (18.3%), and n=16 (32.6%) patients had at least a three-year history of lipid regulators, beta adrenoreceptor blockers, and antiplatelet drug usage. Finally, n=25 patients (51%) had in-patient stays under Cardiology services as their primary specialty.
Conversely, at probability of 36-month mortality ≥ 50%, the model identified n=38 false negative cases. Of these, the most common diagnoses upon discharge over a ten-year Observation Window were, were ‘urinary tract infection, site unspecified’ (n=27 patients [71.1%], N39.0) and ‘unspecified acute lower respiratory infection’ (n=22 patients [57.9%], J22.X). The most common primary specialty amongst the false negative cases was General Medicine (n=35 patients, 92.1%) and General Surgery (n=24 patients, 63.1%). Finally, the most frequently prescribed medication classes were non-opioid analgesics (n=35 patients, 92.1%) and antidiabetic drugs (n=19 patients, 50.0%).
4DiscussionMASLD is a global public health problem with multisystem and multidisciplinary implications [43]. However, techniques for accurately predicting the risk of adverse clinical outcomes in patients with MASLD, such as liver biopsy [44] or dynamic changes in imaging measurements [45,46], rely on patient engagement and healthcare resource utilization. Here, we demonstrate that a simple Transformer neural network model, trained on routinely collected secondary care data, produced well-calibrated probabilities and achieved good discriminatory power in an out-of-sample dataset within a long (up to 3-year) predictive window, with AUROC of 0.70–0.86 (95% CI: 0.67-0.90) for all-cause mortality.
The training and out-of-sample testing sets were comparable in terms of gender and ethnicity distributions, as well as BMI ranges. Patients in the training set were significantly younger than the testing set (55 vs. 66.3 years, Table 2). However, this discrepancy did not adversely influence model performance. Notably, the cardiovascular-specific cause of death was significantly more prevalent in the testing set, compared to the training cohort (23.9% vs. 12.9%), which may contribute to the increased overall prevalence of deaths in the out-of-sample set (23.94% vs. 37.12%).
The mortality classifier used in this study is a Transformer neural network (TNN) [35]. Traditionally, the Transformer architecture was extensively applied to natural language processing, achieving state-of-the-art performance in text annotation [33], named entity recognition [47], and representation learning [48]. More recently, the utility of the Transformer architecture was explored in longitudinal EHRs, demonstrating a striking capacity to parse heterogeneous data sequences and predict multiple clinical trajectories [49,50], considerably outperforming conventional ML techniques. The propensity of this technique to handle large volumes of relatively noisy data, including errors in labels, as well as large numbers of input variables [18], makes it an attractive tool for interrogation of real-world EHRs.
Machine learning models have traditionally targeted the detection of MASLD in the general population using routinely collected medical records. For example, a simple coarse trees model that utilized fasting C-peptide levels and waist circumference identified MASLD with 74.9% accuracy in n=3235 individuals [26]. Similarly, large-scale analyses (n=1,016-73,190 patients) of EHRs in secondary care settings predicted MASLD with AUROC 0.83-0.92 [51,52].
The assumption behind current diagnostic algorithms in MASLD is that liver disease is the principal threat for these patients, whilst the weight of evidence indicates it is not [53]. Leveraging large, diverse, multidimensional datasets in MASLD and applying sophisticated methods such as AI/ML tools or multi-state modelling [54] will elucidate novel subphenotypes with disease trajectories reflecting variable susceptibility to liver-related and/or non-liver-related outcomes. Additionally, the availability of ‘upstream’ risk stratification tools that consider the whole patient history could assist in developing a new paradigm for community-based prognostication in MASLD that captures key demographic influences (such as age, gender, ethnicity, and deprivation index) and embraces comorbidity and polypharmacy. This strategy aligns with a growing shift in government policy in many countries towards a more preventative and anticipatory approach to the management of long-term conditions such as MASLD; the value of which is maximized when it is targeted at patients who are most likely to benefit.
In this work we achieve a good balance between prediction window length (one to three years) and model performance (out-of-sample AUROC 0.70-0.86). Indeed, shorter prediction windows provide limited therapeutic benefit, with underlying disease mechanisms becoming less modifiable, whilst longer prediction windows may result in many false positives, rendering proactive therapeutic or lifestyle intervention less practicable [55,56].
We utilized a data-driven strategy to delineate the salient features captured by our model by computing the coefficient of determination (R2) between low-dimensional representations of the model global average pooling layer and input features. Although several algorithms exist to explain black box models [57,58], they are limited to lower-dimensional tabular data. Our approach, validated in medical imaging [59], attempts to explain features captured within the unstructured temporal information. Variability in albumin levels and eGFR over the ten-year observation window accounted for 90% and 75% of the variance in the model's global average pooling embedding layer, respectively. Recently, a multicenter study (n=229 patients from 22 hospitals) demonstrated that an annual decline in serum albumin concentration in patients with MASLD is associated with adverse events, including gastroesophageal varices leading to rupture or requiring preventive intervention, hepatic failure leading to hepatic encephalopathy, HCC, other organ malignancy, and cardiovascular events [60]. Similarly, in n=18,073 UK Biobank participants identified to have CKD, MASLD was associated with an increased risk of cardiovascular events, all-cause mortality, and end-stage kidney disease [61]. These studies corroborate the utility of the coefficient of determination to identify important learnt features in complex black box models.
Our Transformer model presents several advantages. First, it was trained on a diverse population using routinely collected EHRs on a national scale, covering the full MASLD severity spectrum. This offers a robust inclusion criterion for a population-level risk stratification algorithm. Second, model probabilities were well calibrated and generalized well to an out-of-sample population. Finally, an accurate inference at three-year prediction window resolution offers an opportunity for a timely, low-cost preventative intervention in the general population.
Our study also had limitations. First, we chose all-cause mortality as our initial clinical outcome of interest, as this is a hard endpoint that is free from bias. Future work will extend our approach to liver-specific outcomes. Second, the training set was relatively small (n=940 patients) and may not represent the full breadth of clinical activity in MASLD patients, although all stages of the disease were equally represented. Furthermore, larger evaluation cohorts would provide insight into model performance and potential biases across different strata of the population (e.g., ethnicity, age groups, and deprivation indices) [62]. This presents an urgent requirement to validate model generalizability in other systems outside Scotland. This should be feasible due to the routine availability of model features and is currently our primary focus of research. Next, the retrospective nature of this study resulted in a level of class balance that may not represent real-world prevalence. Therefore, any future validation should involve a prospectively selected cohort of patients. Finally, despite our work on coefficient of determination, the black-box nature and the dimensionality of training data make interpretation of our model unintuitive. This can pose a challenge to clinical implementation.
5ConclusionsIn conclusion, we show that a simple Transformer model utilizing routinely collected EHRs may offer a robust tool for community-based risk stratification of MASLD patients at an increased risk of all-cause mortality. Integration of such models into health and social care systems could assist primary care physicians in the targeting of anticipatory interventions at the individual patient level, refine secondary care referral pathways, and assist more broadly in service planning. Future work will require a prospective validation study, which would allow for evaluation of the algorithm when exposed to real-world class distributions, assessing its effect on workflow safety and operational efficiency.
FundingThis work was funded by a grant from Innovate UK EUREKA (Reference: 105976) and by Bering Limited. For the purpose of open access, the author has applied a creative commons attribution (CC BY) licence to any author-accepted manuscript version arising.
Author contributionsID, JAF, TJK: conception and design, acquisition of data; ID, BS, JAF, TJK, IAR: analysis and interpretation of data; ID, JAF: drafting the article; TJK, IAR: revising the article critically for important intellectual content; all authors: approval of the final manuscript version. *ID and JAF are co-corresponding authors.
We are grateful to Charlie Mayor (NHS Greater Glasgow & Clyde Safe Haven) for electronic health data extraction and provision and to Lynn McMahon and Marian McNeil (Precision Medicine Scotland-Innovation Centre) for project management, data compliance, data security, and workspace provision.


