


Alcohol-associated hepatitis (AAH) morbidity and mortality are increasing worldwide and are an essential healthcare burden [1,2]. Chronic alcohol abuse affects the intestinal epithelial barrier and gut permeability [3,4]. These events allow gut bacteria and their compounds, such as LPS and antigens, to reach the liver [5]. The 'leaky gut' hypothesis proposes that intestinal bacteria, endotoxin, and other bacterial products move into the liver via the portal circulation, causing immune cell infiltration, hepatic inflammation, and fibrosis, contributing to AAH [6,7]. Increasing gram-negative bacteria and reducing short-chain fatty acids (SCFAs)-producing bacteria characterizes dysbiosis [8]. Research indicates that rats consuming 20 % alcohol on alternate days for 13 weeks had lower α- and β-diversity, decreased Lactobacilli, and increased Bacteroidetes [9]. Alcohol-treated mice had impaired liver function, lipid accumulation, gut dysbiosis, and lesser Firmicutes and higher Bacterioidetes and Verrucomicrobia after 3-weeks [10]. Another study found alterations in Ruminococcus, Coprococcus, and Streptococcus abundance in rats given 10 % v/v ethanol for 12-months [11].
In previous studies, increasing the alcohol dose by combining intragastric feeding of alcohol (or a liquid diet) with a high dose via oral gavage and simulating the alcohol binge increased liver disease in rodents [12], but fibrosis was not pronounced [13]. Also, increasing the alcohol dose led to increased mortality [12]. Thus, a model was required where fibrosis is pronounced, and the animals can tolerate a higher dose of alcohol for a longer duration, akin to a human alcoholic. Previously reported, long-term alcohol and thioacetamide (TAA) combination in C3H/He mice resulted in hepatic fibrosis by the 15th week [13]. Ethanol or TAA alone has been shown to induce mild fibrosis in albino mice [14]. TAA could thus be used with Ethanol to establish an early fibrosis.
Alcohol alters hepatic and systemic protein expression [15–19]. A study found 87 upregulated and 133 downregulated DEPs in the liver tissues of mice fed 4 % alcohol for 29 days compared to pair-fed mice [15], but the similarity to human disease was not explained. In a rodent model of alcoholic steatosis, several proteins involved in fatty acid and amino acid metabolism were upregulated in 3- and 6-week ethanol-fed rats relative to isocaloric controls. This suggests a higher energy demand upon chronic exposure to ethanol [20]. The above studies were performed on animal models with lower doses of alcohol (4 %) and shorter durations (4 to 6 weeks).
Therefore, we hypothesized that using TAA with Ethanol causes rapid hepatic fibrosis, and the disease thus established could mimic the disease phenotype of ALD patients. Here, we established a well-defined Lieber-DeCarli mouse model of AAH, which mimics the gut microbial variations during disease development and progression, presents early significant fibrosis, and hepatic proteome variations similar to human alcoholic hepatitis patients (which are typically treated with sedatives or opioids [21]) and have similar proteome variations.
2Materials and methods2.1Animal modelAnimal protocols were approved by the Institutional Animal Ethics Committee, and experiments were performed in accordance with CPCSEA (Committee for the Purpose of Control and Supervision of Experiments on Animals) guidelines. The animal experiments were performed under controlled conditions in the vivarium of ILBS, New Delhi. Fifty-eight male C57BL/6N mice (strain code-632, Charles River, USA) of 6-8 weeks, weighing 20-25 gms. Animals were housed in a specific pathogen-free environment with ambient temperature maintained at 21-25°C and humidity at 50 %-70 %. The animals were acclimatized to their new environment for 2-weeks before experimentation. The study design is presented in Fig. 1 A.
, and EtOH+TAA (ethanol+TAA) diet for 12 weeks. 16s rRNA sequencing for gut microbiota analysis was performed at 4,8 and 12 weeks. B: Serum liver damage markers ALT (alanine transaminase), AST (aspartate aminotransferase), and Bilirubin levels in mice at 4, 8, and 12 weeks after EtOH exposure increased over time. C: Liver injury, as assessed by hematoxylin and eosin (H&E) staining after EtOH exposure, showed increased steatosis at week 12. The Masson")
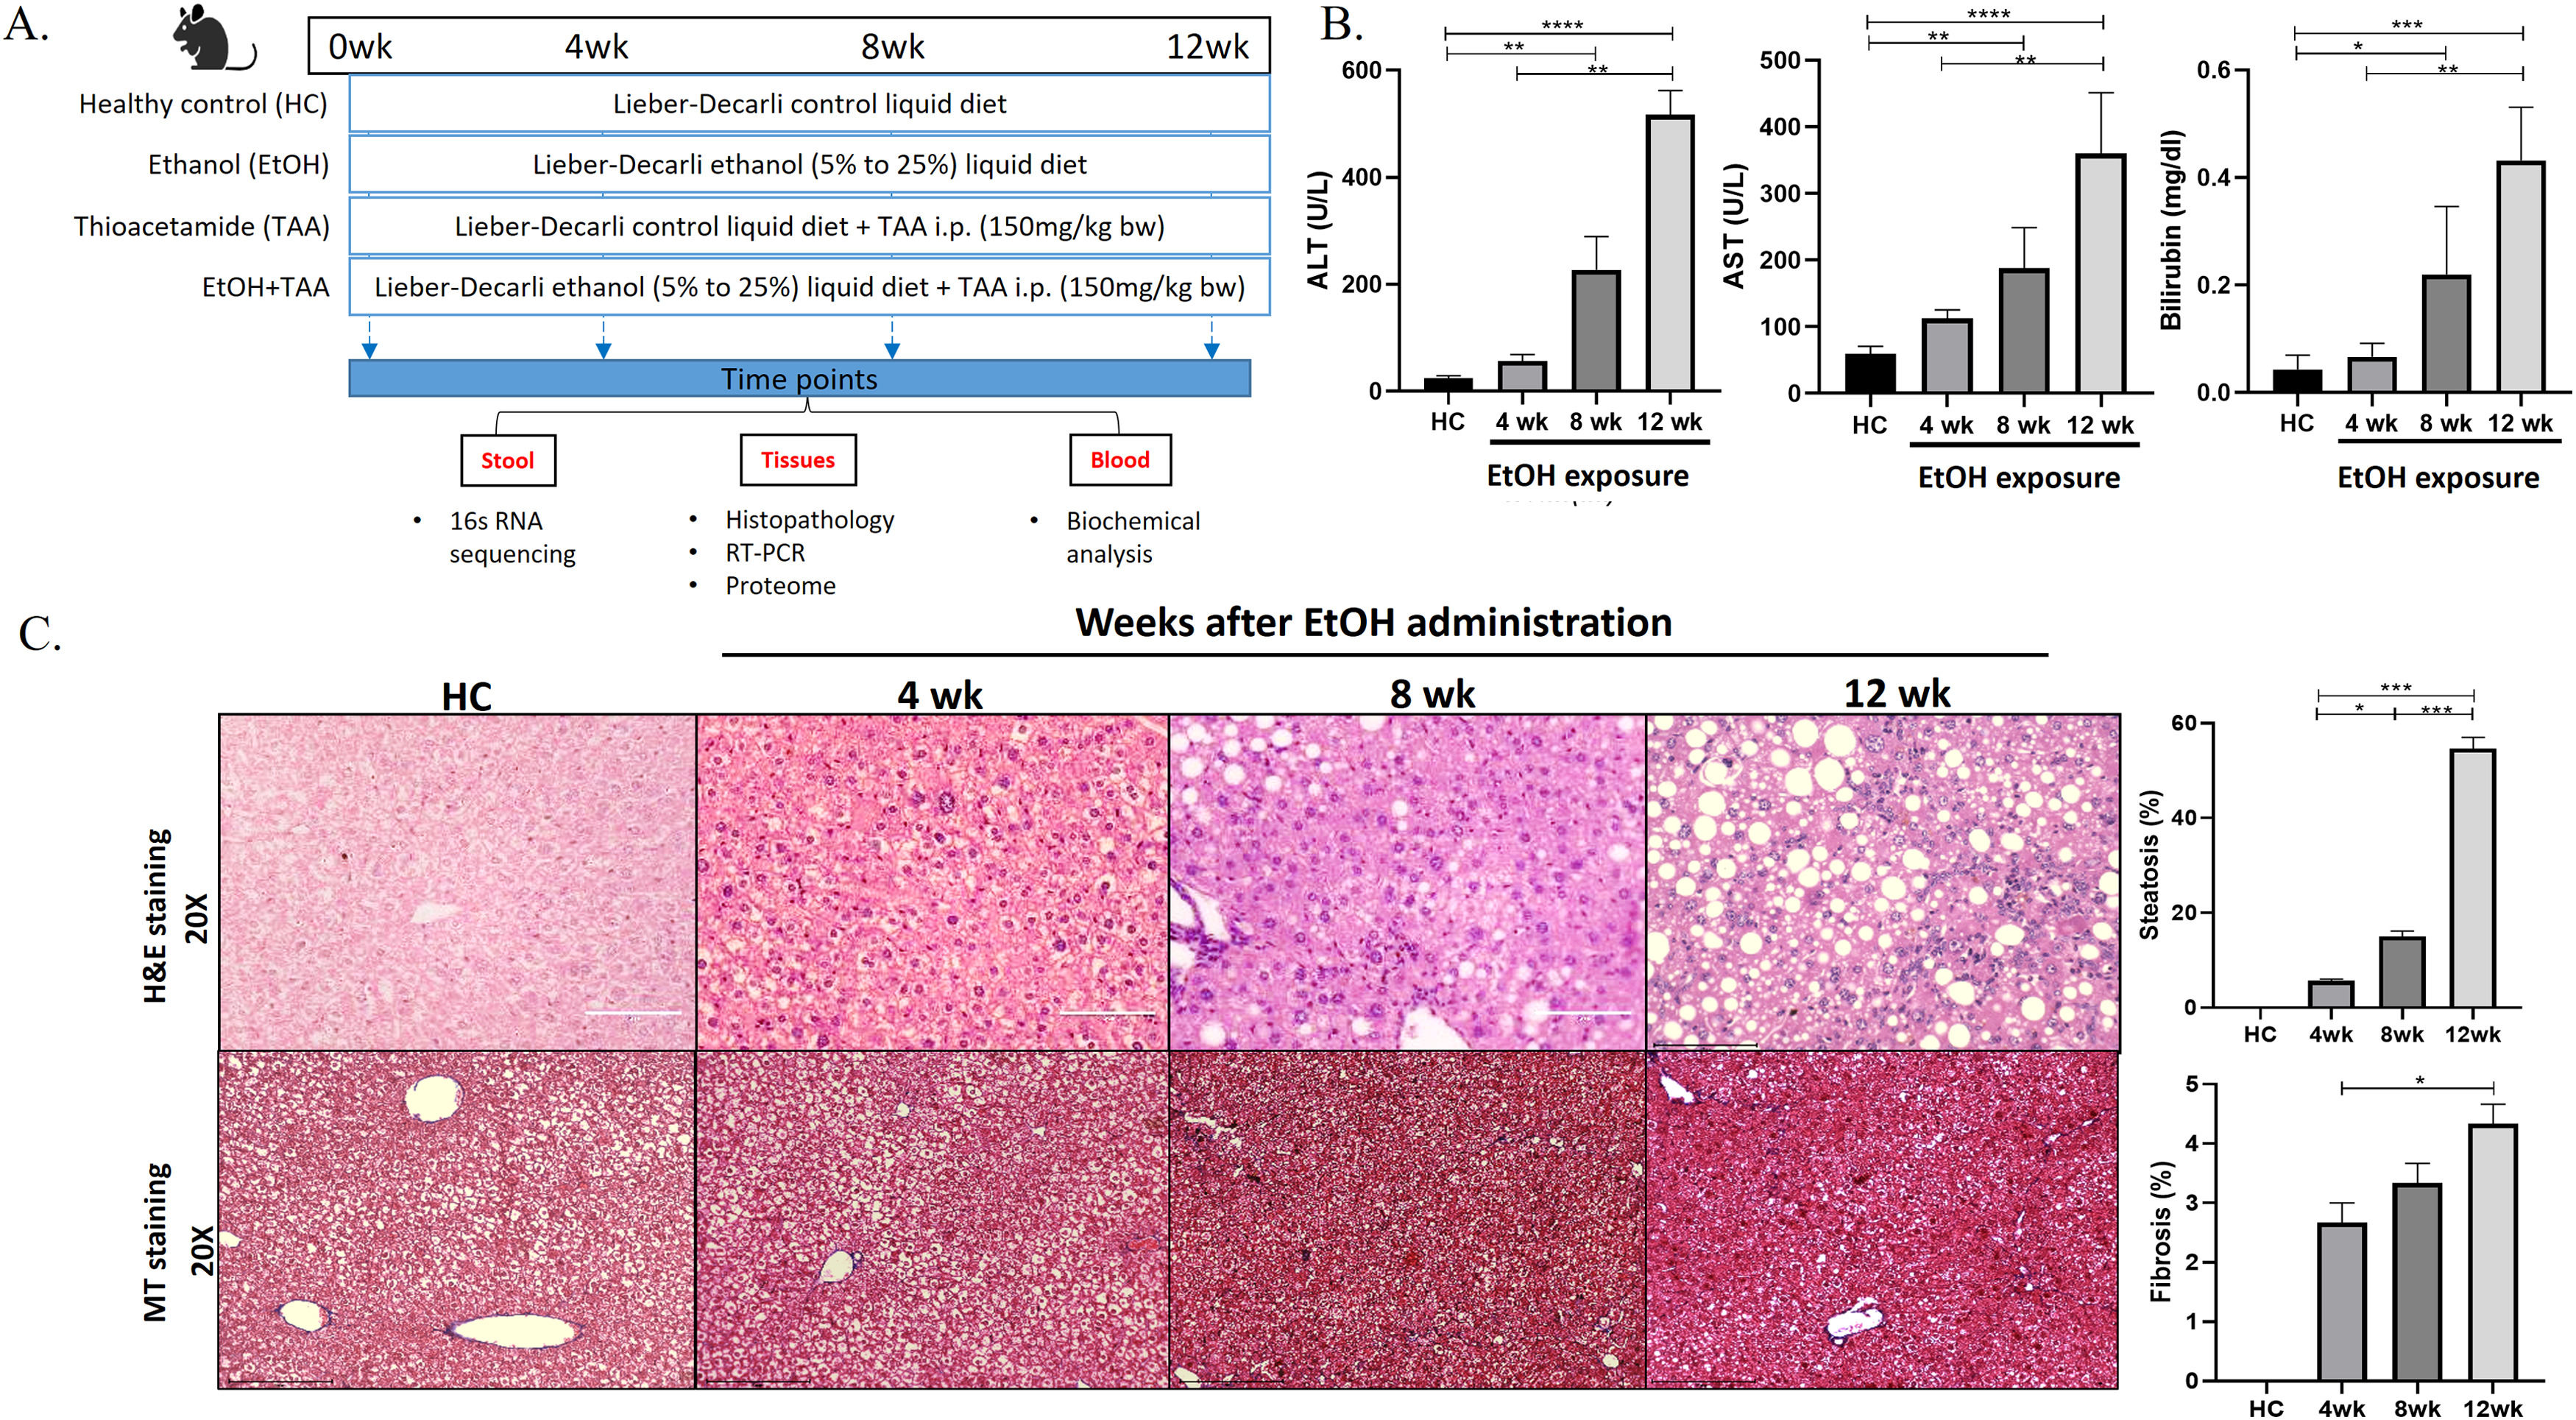
Ethanol-fed liquid diet induces steatosis and mild fibrosis. A. The study design shows groups of animals given a control, alcohol, thioacetamide (TAA), and EtOH+TAA (ethanol+TAA) diet for 12 weeks. 16s rRNA sequencing for gut microbiota analysis was performed at 4,8 and 12 weeks. B: Serum liver damage markers ALT (alanine transaminase), AST (aspartate aminotransferase), and Bilirubin levels in mice at 4, 8, and 12 weeks after EtOH exposure increased over time. C: Liver injury, as assessed by hematoxylin and eosin (H&E) staining after EtOH exposure, showed increased steatosis at week 12. The Masson's trichrome staining showed mild fibrosis by 12 weeks. Values are expressed as means ± SEM (standard error mean). *p < 0.05, **p < 0.01, ***p < 0.001.
Animals (n = 16) were fed a Lieber-DeCarli liquid diet with alcohol (total 1000kcal/L; Cat no.#F1258SP, Bio-Serv, USA [12]). The alcohol amount started at 5 % and was increased to 25 % by the 8th week and maintained so for the next 4th weeks. Control animals (n = 10) were pair-fed isocaloric non-alcoholic Lieber-DeCarli liquid diet (total 1000kcal/ltr; Cat no.#F1259SP, Bio-Serv, USA). Thioacetamide (TAA; Cat no.163678 Sigma-Aldrich) was administered at 150 mg/kg body weight, i.p., twice a week [13,22]. Mice (n = 6) from each group were sacrificed at 4, 8 & 12-weeks. Organs were snap-frozen and stored at -80°C. For histology, liver and intestine tissues were stored in 10 % formalin until processing for cytology.
2.2Liver function testsBlood was collected from mice via the retroorbital sinuses at the time of euthanasia (Ketamine, 80-100mg/Kg + Xylazine, 8-10 mg/Kg). The serum was separated by centrifugation at 3,000 xg for 10 minutes. Bilirubin, alanine aminotransferase (ALT), aspartate aminotransferase (AST), total protein, and γ-glutamyl transpeptidase (γ-GGT) biochemical markers were detected by an Olympus AU5400 automatic analyzer (Olympus Optical, Tokyo, Japan). After withdrawing the blood, livers were extracted, weighed, and snap-frozen in liquid nitrogen for molecular work or preserved in 10 % formalin for histology.
2.3Histopathology and immunohistochemistryFor histopathological studies, the liver tissues were fixed with 10 % formalin, embedded in paraffin, sectioned at 4 μm thickness, and stained with hematoxylin-eosin to capture steatosis, Masson's trichrome staining for fibrosis. Three liver tissues from each group were assessed to score injury. Briefly, the extent of hepatic injury and fibrosis were measured through the Ishak index score, using α-SMA (1:1000, Cat no.E-AB-34268, E-Lab, USA) and F4/80 (Cat #PA5-32399, Invitrogen polyclonal antibody, USA).
2.4Gene expression analysisRNA was isolated from the liver tissue using TRIzol™ Reagent (Cat no.15596026, Thermo, USA); this was followed by cDNA synthesis (Cat no.AB1453A, Verso cDNA kit, Thermo, USA) and real-time PCR analysis on Applied Biosystems 7300 real-time PCR system (California, USA). Gene expression of fibrosis-related genes (TGF-β, Col-1α1, ICAM-1), inflammatory genes (IL-6, TNF -α, IL10, IL1Ra), macrophage markers (Ccr2), hepatocyte regeneration marker (PCNA), antioxidant marker (HO-1) and hepatic triglyceride markers (PPAR-γ, CD-36, Srebp-1c) was estimated using the ΔΔCT method normalized against GAPDH. Primer details are shown in Supplementary Table 1.
2.5Measurement of hepatic lipid levelsHepatic triglycerides were quantified using colorimetric assay according to the manufacturer's protocol (Cat. No ab6533, Abcam, UK)
2.6Total protein extractionTotal hepatic protein was extracted using RIPA lysis buffer (Cat No.786490, G-Biosciences, USA). After 12,000 × g centrifugation at 4°C, the supernatant was collected and stored at −20°C till further analysis.
2.7Antioxidant enzymes and MDA quantificationThe levels of superoxide dismutase (SOD, Cat no.A001-1 T-SOD), malondialdehyde (MDA, Cat no.A003-1-1), and glutathione (GSH, Cat no.A006-2-1) were estimated using commercial kits (Nanjing Jiancheng Bioengineering Institute, China) following the manufacturer's instructions.
2.8ELISALevels of Interleukin 1 Receptor Antagonist (IL1Ra) were assessed as per manufacturer's instructions: ELISA Kit (Cat No.E-EL-M0038, Elabsciences; Texas, USA). A 100 μl of hepatic protein lysates (1:100 in sample/conjugate diluent) were added to commercially coated wells and incubated for 90 min at 37°C. After washing the wells three times with 300 μl of kit washing buffer, 100 μl HRP conjugate solution was added to each well and incubated for 30 min at 37°C. After another five washings, 90 μl substrate reagent was added to each well and incubated for 15 min at 37°C. The reaction was terminated by adding 50 μl of Stop Solution to all the wells. Absorbance was then measured at 450nm. ELISA for MMP-2 (Cat no.E-EL-M0780), ICAM-1(Cat no.E-EL-M3037), TIMP-1(Cat no.E-EL-M3071) and HO-1(Cat no.E-EL-M3031) was performed as per manufacturer's (Elabsciences; Texas, USA) protocol.
2.9Western blots analysisTissues were lysed in RIPA lysis buffer containing 1mM PMSF. 30µg of protein were run on SDS-PAGE and transferred to the nitrocellulose membrane. The membranes were washed, blocked, and incubated with specific primary anti-mouse antibodies against Col1α1 (Santa Cruz, cat no-sc-59772), PPAR-γ (Cloud-clone corp. cat no-PAA886Mu01), ADH5 (Abcam, cat no-ab177932) and β-actin (Cloud-clone corp., cat no-PAB340Mi01), followed by incubation with horseradish peroxidase-conjugated rabbit-anti-mouse antibodies (Cloud-clone corp. cat no-SAA544Mu09). Signals were visualized by chemiluminescence detection (Clarity Western ECL Substrate; cat no-1705060) on the gel documentation system.
2.10Gut microbiota analysisFecal samples were collected immediately upon defecation and stored at -80 °C. According to the manufacturer's protocol, fecal DNA was extracted using a Qiagen Stool DNA Kit (Cat No.51604). A 16S rRNA sequencing library was constructed according to the 16S metagenomics sequencing library preparation protocol (Illumina, San Diego, CA, USA) targeting the V3-V4 hypervariable regions of the 16S rRNA gene [23]. Samples were sequenced on the MiSeq (Illumina) using a 2 × 300 cycle V3 kit (Cat no.MS-102-3001), following standard Illumina sequencing protocols. All the bioinformatics analysis was performed using QIIME2 (version 6.0). Sequences with PHRED score >25 were retained for analysis (average no. of sequences per sample >3,00,000). The web-based tool MicrobiomeAnalyst2.0 (https://www.microbiomeanalyst.ca/) was used to determine alpha and beta diversity24. The sample preparation and analysis are detailed in supplementary materials and methods (SS1).
2.11Hepatic proteome (LC-MS/MS analysis)Liver tissues were homogenized and digested with trypsin, and a label-free quantification (LFQ) analysis was performed [16] (SS2). Differential protein expression analysis was performed using the Perseus application v2.0.10.0 [25]. A log2-fold change and false discovery rate (FDR)-adjusted p-value (q-value) cutoff at ±0.05 and <0.1, respectively, were applied. Gene ontology enrichment analysis (GO 3.0) and KEGG-annotated pathways were used to determine the pathways associated with differentially expressed proteins (DEPs) [26]. Pathway enrichment analysis was conducted using Enrichr [27]. FDR q-value <0.05 and adjusted p-value <0.05 were considered as thresholds for enrichment.
2.12Statistical analysesThe proteomics data was compared to controls using paired t-tests or ANOVA. P-values are permutation-based FDR-corrected, with significance defined at p<0.05. UniProtKB (https://www.uniprot.org/) was used to extract protein annotations. Gene ontology and KEGG pathway databases were used for categorical annotations. The Kruskal-Wallis test was performed for microbial comparison. Bray-Curtis dissimilarity matrices were used for the principal coordinate analysis (PCoA). Only significant associations (p<0.05) were plotted in the respective graphs; p-values were determined by permutational multivariate analysis of variance (PERMANOVA) while adjusting for potentially confounding factors. Graph Pad Prism (ver.6) was used for statistical analyses, and p-values of <0.05 were considered statistically significant.
2.13Ethical statementInstitutional Animal Ethics Committee (IAEC) of the Institute of Liver and Biliary Sciences, New Delhi, India. The reference number is IAEC/ILBS/16/06.
3Results3.1Prolonged EtOH liquid diet intake promotes liver injury, steatosis, and mild fibrosisAt 12 weeks, healthy control mice had lustrous coats, normal behaviors, and no mortality. The ethanol group had disheveled hair and decreased activities. The livers in the disease groups showed decoloration granular nodules and had hard texture compared to healthy controls (S-Fig. 2 A). The liver weights and liver-to-body weight ratios showed a 1.2-fold increase than controls (p = 0.048), as shown in Supplementary Fig. 2 B (S-Fig 2B). After 12wk of EtOH exposure, alanine aminotransferase (ALT), aspartate aminotransferase (AST), and Bilirubin were significantly increased [11-fold (p = 0.0001), 5.5-fold (p = 0.0001) and 13-fold (p = 0.0002), respectively] compared to controls (Fig. 1 B). Histopathological analysis in the EtOH group showed hepatic steatosis at 12wk (55 % increase, p = 0.03) (Fig. 1 C), and Masson's trichrome showed only mild fibrosis (5 % fibrosis-positive area, p = 0.001) compared to controls.
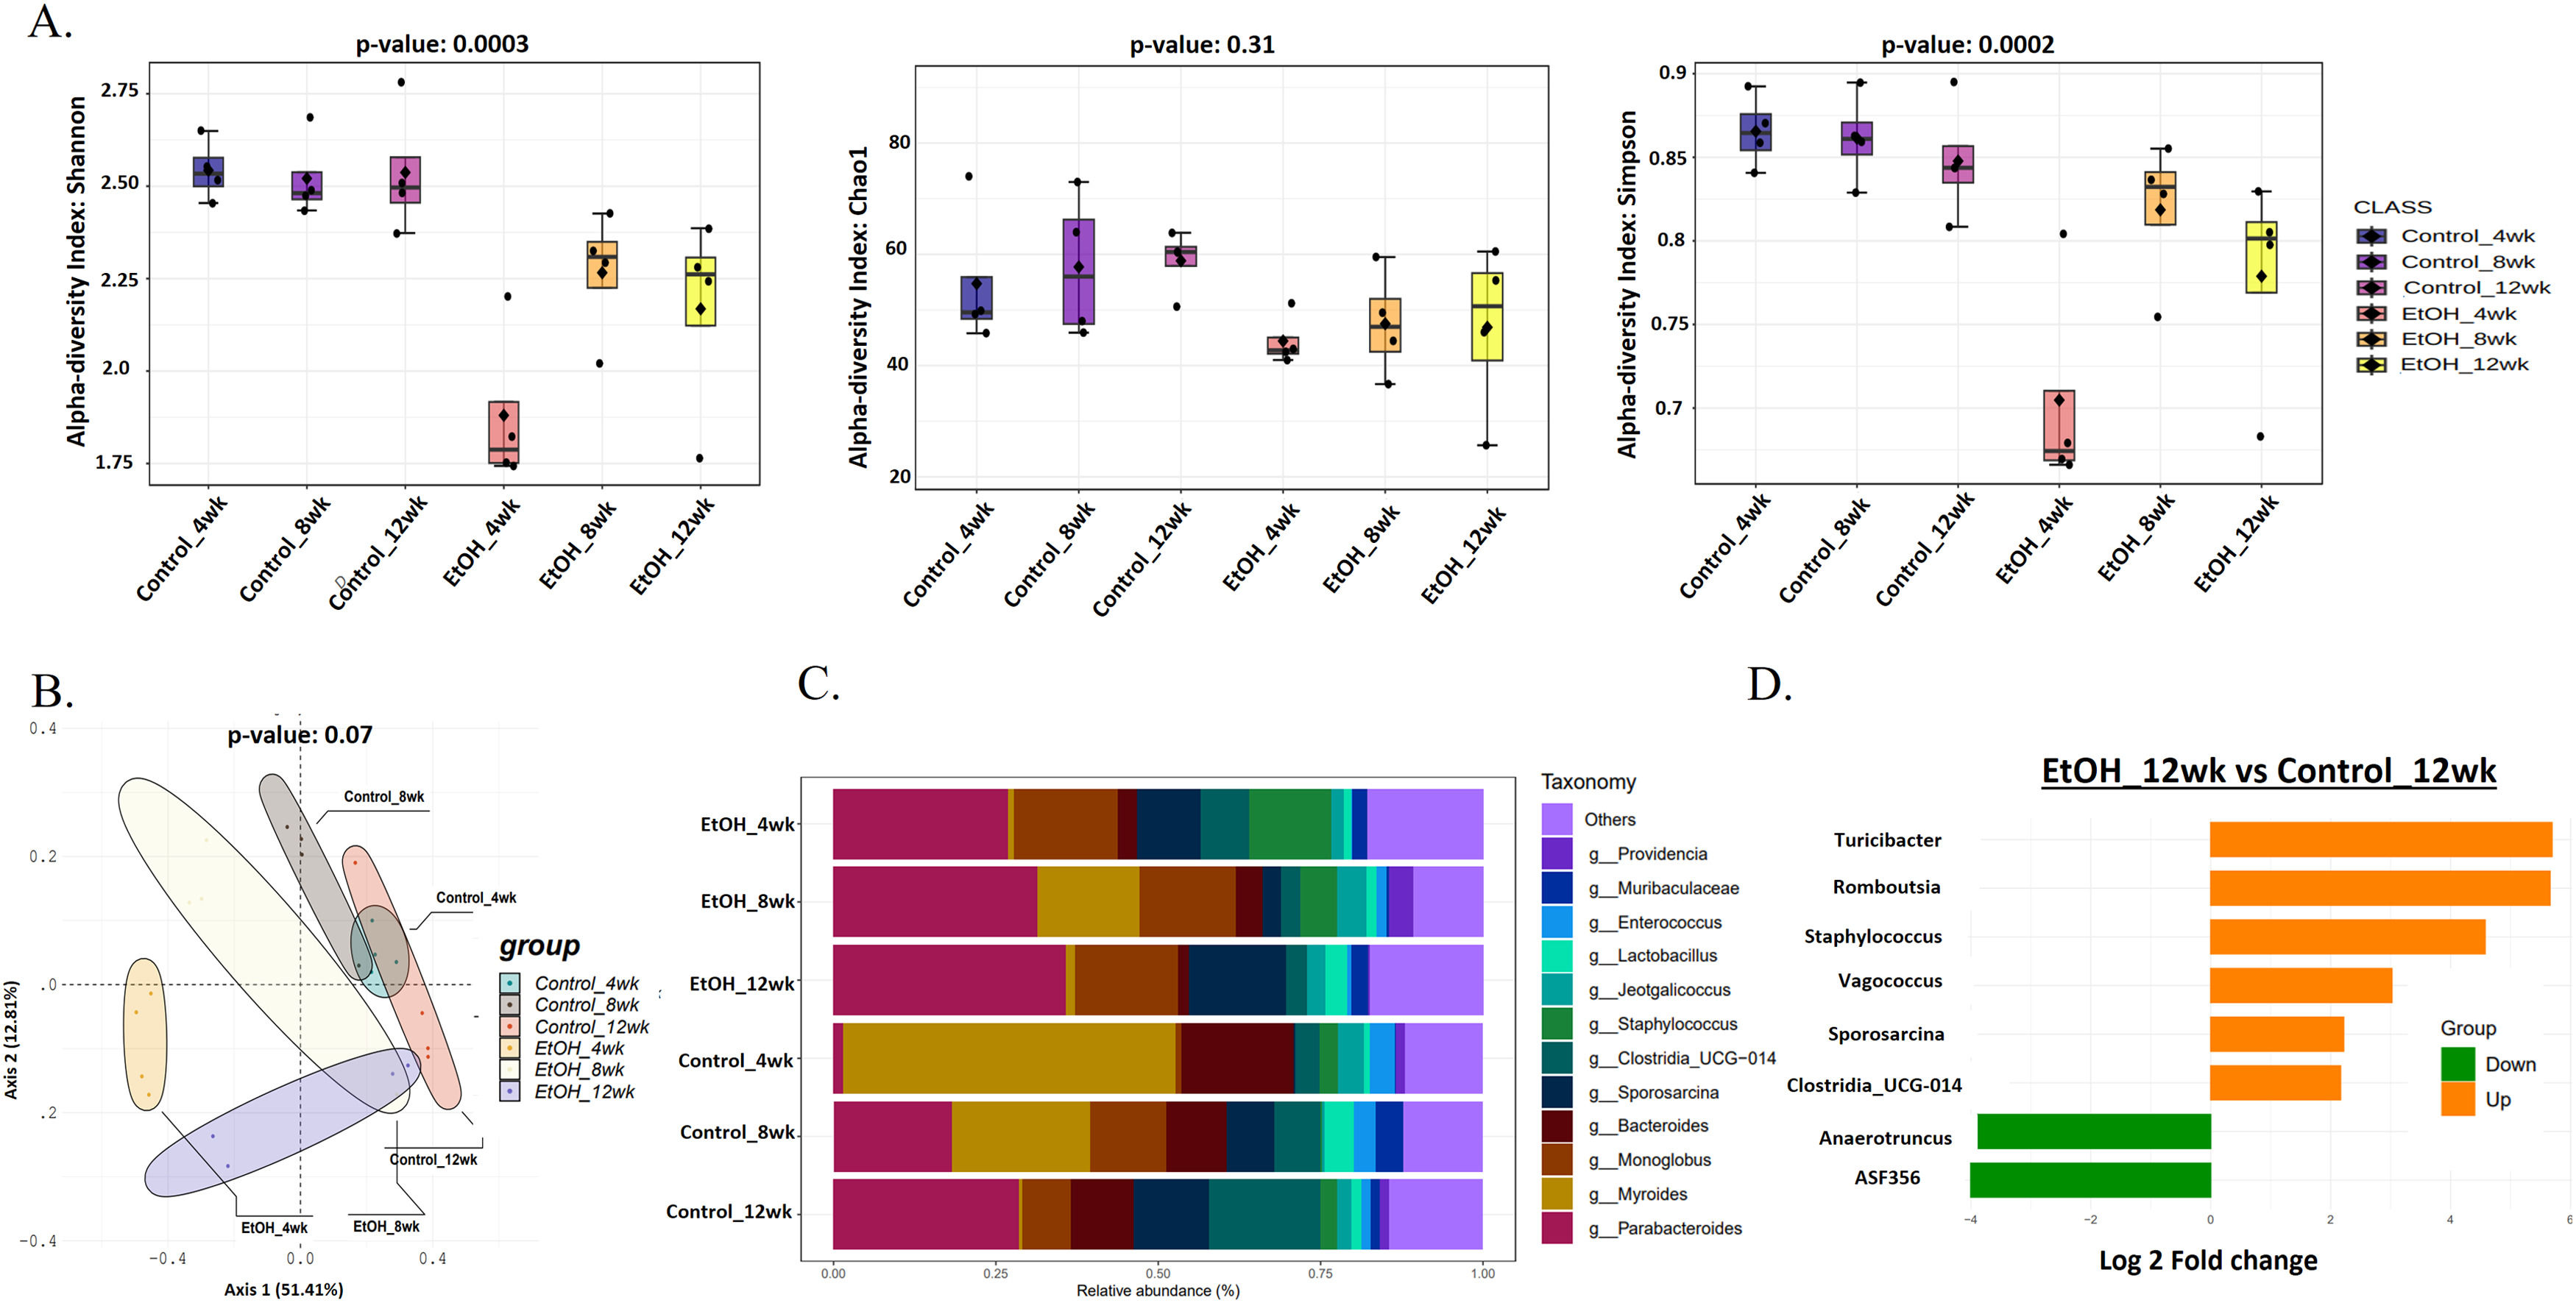
3.2Prolonged EtOH-fed liquid diet-induced intestinal microbiota variations during AAH progressionChronic ethanol administration is associated with intestinal and hepatic microbiota changes in mice [28]. Alpha diversity (Shannon index) showed a significant (p = 0.0003) decrease of approximately 30 % in gut microbial diversity in the EtOH group at 4wk in comparison to HC (Fig. 2 A). However, in the EtOH group, it increased by 20 % at 8 and 12wk. Evenness of the community (Simpson's index) followed the same trend (p = 0.0002) as Shannon (Fig. 2 A). Rare species estimated by the Chao1 index also decreased (10 %, p = 0.31) in EtOH groups. (Fig. 2 A). Principal coordinate analysis (PCoA) using the Bray-Curtis dissimilarity index showed significant variation (p = 0.07) between the EtOH and control communities (Fig. 2 B).
 using the Bray–Curtis dissimilarity metric (p = 0.001) showed significant variation in the community composition of control and EtOH groups. C: Relative abundance of prevalent microbiota at the genus level in Ethanol vs. control at 4, 8, and 12wks showed dominance of Sporosarcina, Clostridia, Staphylococcus, and Enterococcus, while Parabacteroides, Monoglobus, and Lactobacillus relatively decreased in EtOH 12wk. D: Bar chart showing significant differential gut bacteria between Ethanol and control at 12wk at the genus level (p < 0.05, fold change (FC) >1.5).")
Prolonged EtOH-fed liquid diet-induced intestinal microbiota variations during AAH progression. A: Alpha diversity using Shannon, Simpson, and Chao1 index of gut microbiota showed a reduction in the EtOH group by 12wk. B: Principal Coordinate Analysis (PCoA) using the Bray–Curtis dissimilarity metric (p = 0.001) showed significant variation in the community composition of control and EtOH groups. C: Relative abundance of prevalent microbiota at the genus level in Ethanol vs. control at 4, 8, and 12wks showed dominance of Sporosarcina, Clostridia, Staphylococcus, and Enterococcus, while Parabacteroides, Monoglobus, and Lactobacillus relatively decreased in EtOH 12wk. D: Bar chart showing significant differential gut bacteria between Ethanol and control at 12wk at the genus level (p < 0.05, fold change (FC) >1.5).
Of the ten phyla identified, most bacterial species belong to the phyla Firmicutes (gram-positive) and Bacteroidota (gram-negative). In contrast, the remnants belong to Actinobacteriota, Proteobacteria, Deferribacteriota, Cyanobacteria, Patescibacteria, Campylobacterota, Desulfobacterota, and Verrucomicrobiota (S-Fig 4). EtOH-induced variations in bacterial taxa were more evident at the genus level (Fig. 2 C). A total of 127 genera were present in all the groups, with the abundant genera Parabacteroides, Monoglobus, Sporosarcina, and Muribaculaceae relatively increased, while Staphylococcus, Providencia, and Bacteroides relatively decreased in EtOH 12wk when compared to HC 12wk (Fig. 2 C). Subsequently, a comparative analysis of differential taxa at 12wk (Fig. 2 D) showed ASF356 (belongs to Clostridia, a short-chain fatty acid (SCFA)-producing bacteria) and Anaerotruncus (belongs to Clostridia, sugar fermenting bacteria) decreased 4-fold significantly (p = 0.01 and p = 0.04 respectively) in EtOH 12wk in comparison to HC. There was a significant 4 to 5-fold increase in Turicibacter (p = 0.02), Romboutsia (p = 0.02), and Staphylococcus (p = 0.001) in the EtOH 12wk group as compared to HC. Both Romboutsia and Staphylococcus are classified as opportunistic taxa. Vagococcus (p = 0.01) increased 3-fold, Sporosarcina and Clostridia_UCG-014 (opportunistic) increased 2-fold significantly (p = 0.03 and p = 0.01 respectively) in EtOH 12wk when compared to HC 12wk (Supplementary Table- 2).
3.3Ethanol and thioacetamide combination results in aggravated injuryEthanol treatment alone in murine models does not induce significant liver fibrosis [29]. Hepatic sections from the EtOH+TAA group showed damaged liver lobule structure (S-Fig 3). Masson's trichrome staining confirmed fibrosis induction in all TAA-treated groups, with significant pericellular fibrosis in the EtOH+TAA group (S-Fig 3). Liver injury biochemical parameters were significantly increased in the EtOH+TAA group (S-Fig 3).
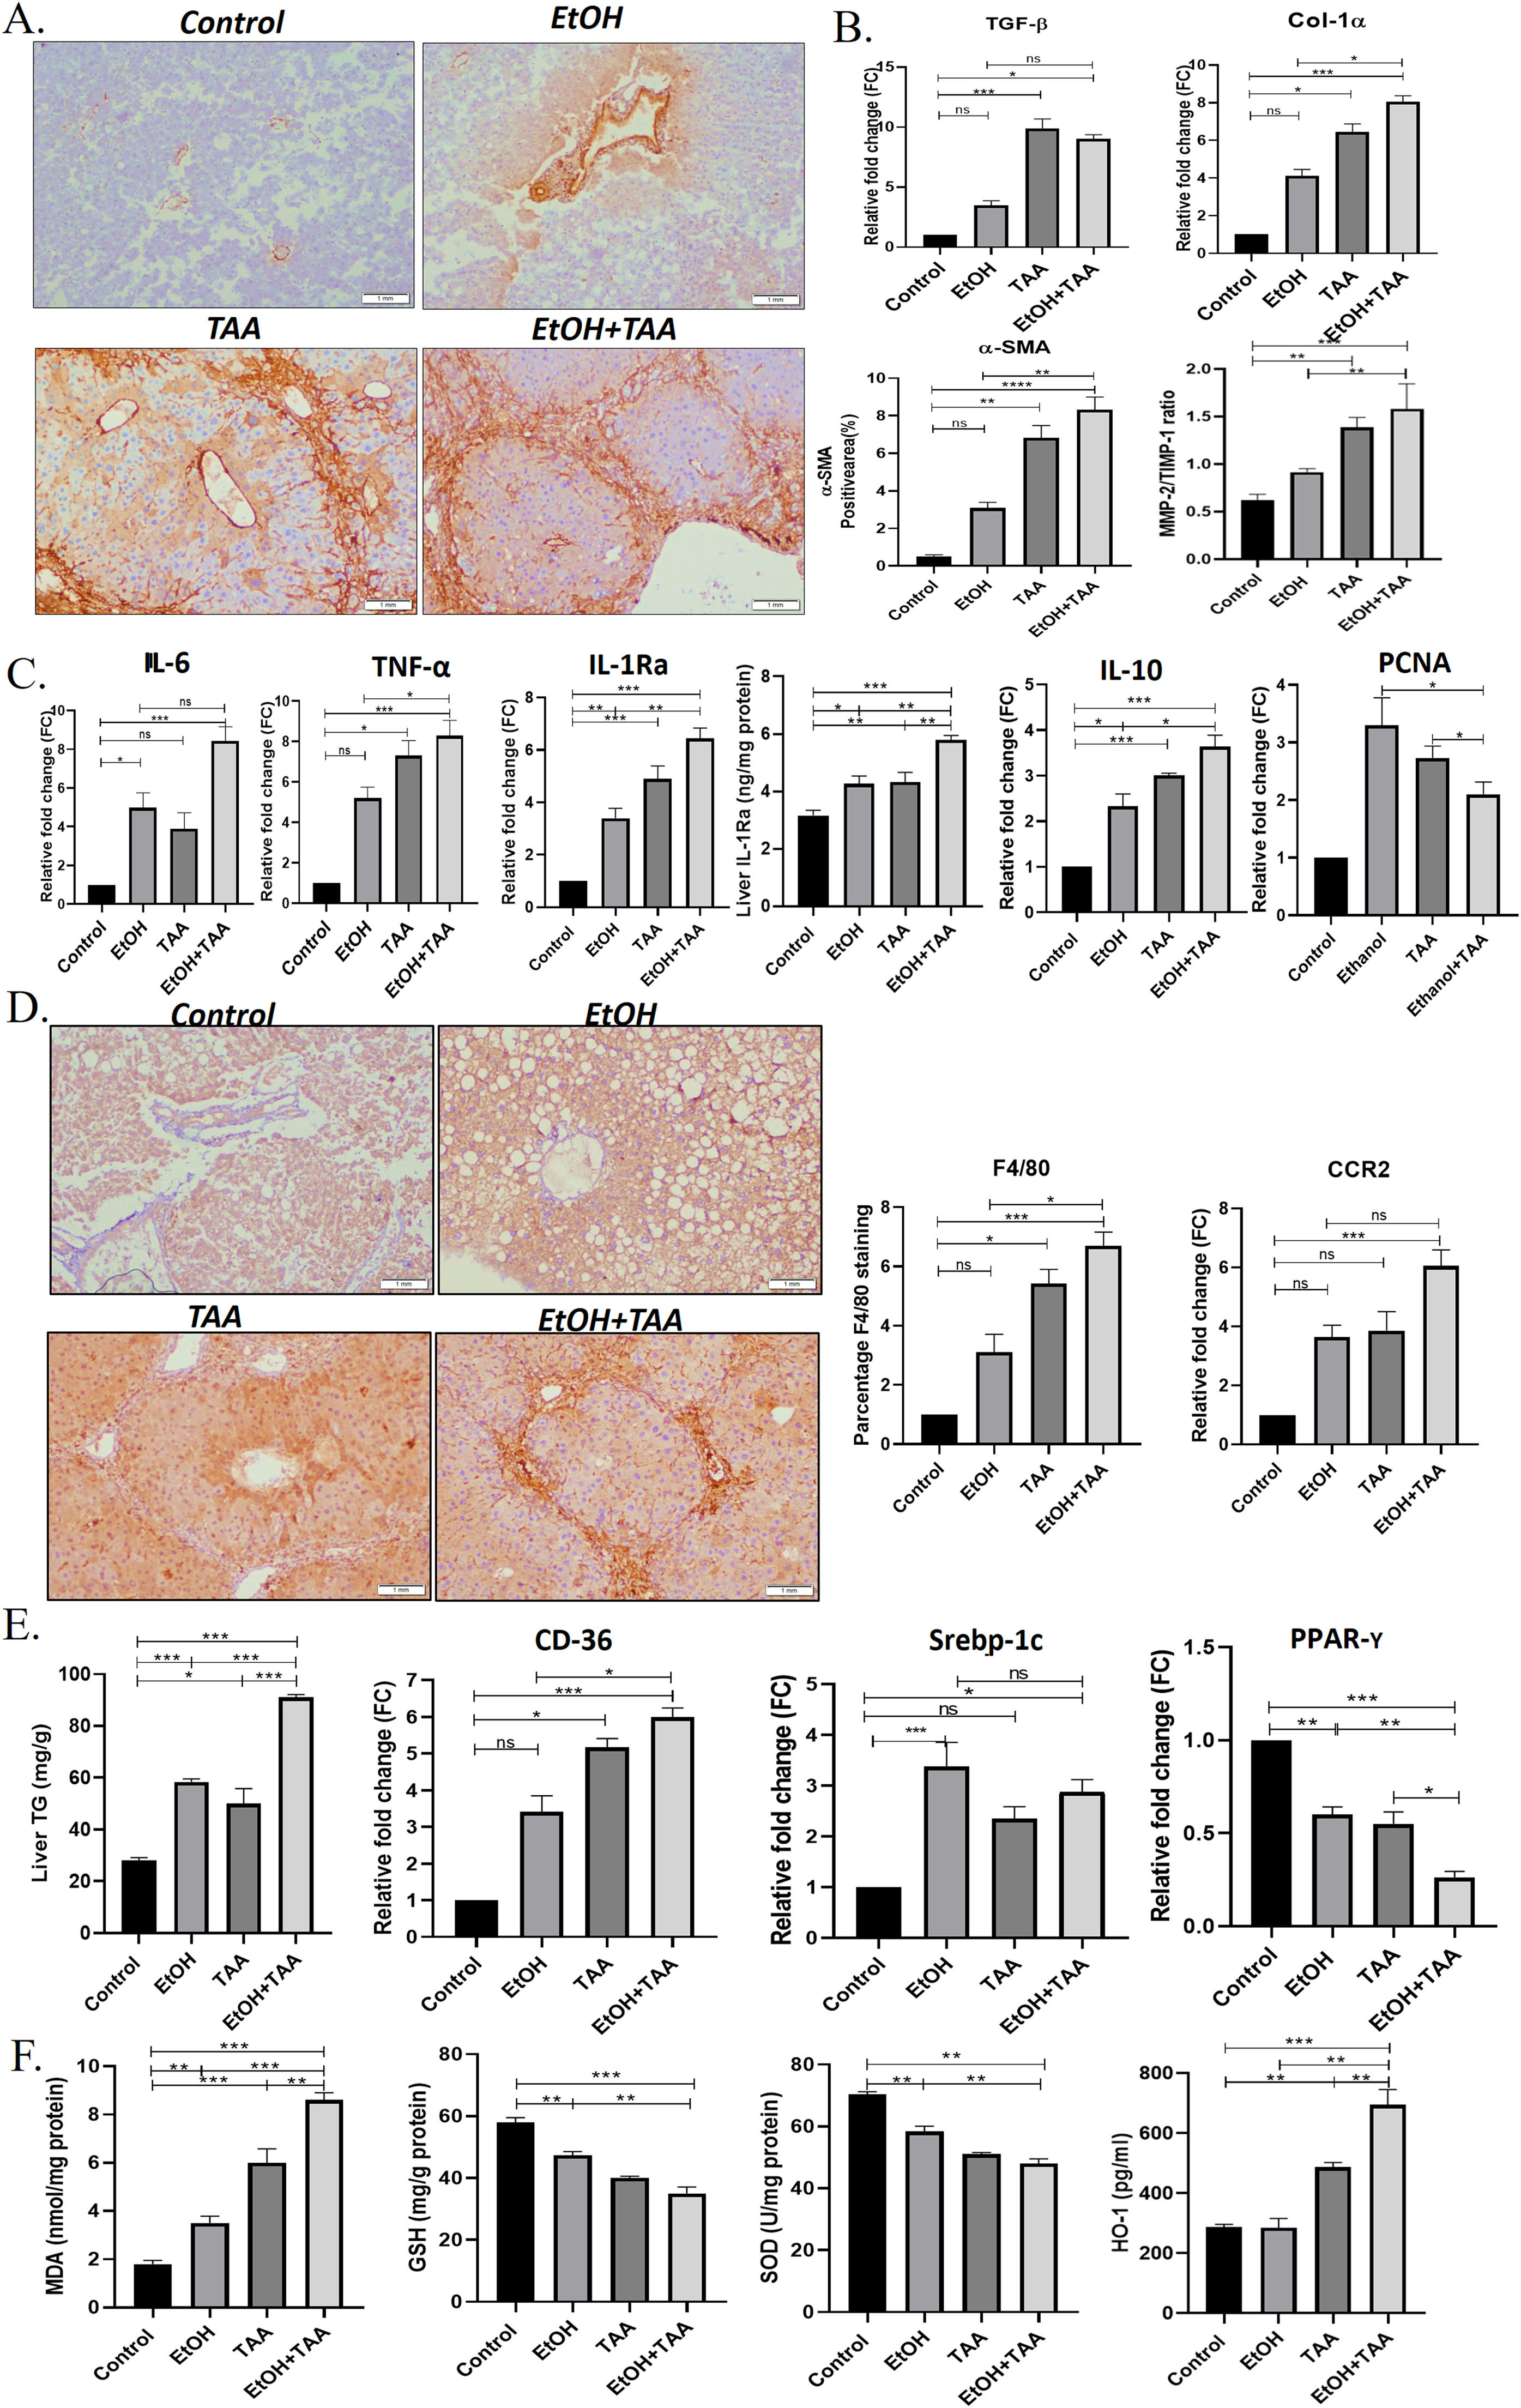
Additionally, to determine hepatic stellate cell (HSC) activation, α-SMA-immunohistochemistry showed lower TAA activation than EtOH+TAA (Fig. 3 A). Whereas combined EtOH+TAA (p = 0.008) treatment compared to Ethanol alone showed a pronounced increase (50 %) in the α-SMA-positive area, indicating strong HSC activation. This was further confirmed by the mRNA expression levels of hepatic TGF-β and Col1α-1 known fibrotic markers, which also show a 3-fold (p = 0.189) and 2-fold (p = 0.016) increase, respectively, in EtOH+TAA group when compared to Ethanol alone (Fig. 3 B). Col1α-1 protein showed a 2-fold increase in the EtOH+TAA group (S. Fig 7). Fibrosis was further confirmed by increased MMP-2/TIMP-1 protein ratio (1.7-fold, p = 0.02, Fig. 3 B), mRNA and protein expression of ICAM-1 (2-fold, p = 0.002 and 0.001 respectively, (S-Fig 3). The mRNA expression of pro-inflammatory markers, IL-6 (p = 0.14), TNF-α (p = 0.024), mRNA and protein expression of IL-1Ra (p = 0.01 & 0.003 respectively; and anti-inflammatory marker IL-10 showed a 2-fold increase (p = 0.01) in EtOH+TAA group (Fig. 3 C). The hepatocyte proliferation marker PCNA (p = 0.03) showed reduced expression in combined EtOH+TAA treated animals compared to Ethanol alone, suggesting a loss of hepatocyte regeneration capacity (Fig. 3 C).
 combination results in aggravated alcoholic liver disease. A: The hepatic expression of α-SMA (alpha-smooth muscle actin) measured by immunohistochemistry showed elevated expression in the ethanol+TAA group. B: The hepatic mRNA expression levels of fibrosis markers (Col-1α1, collagen, type 1, alpha1 and TGF-β, transforming growth factor-ß1) measured by qPCR (real-time polymerase chain reaction) showed elevated expression in the ethanol+TAA group. C: Hepatic mRNA expression of inflammatory (IL-6, interleukin 6; TNF-α, tumor necrosis factor-alpha; IL-10, interleukin-10 and mRNA and protein expression IL-1Ra, interleukin-1 receptor antagonist) and proliferation marker PCNA (proliferating cell nuclear antigen) showed elevated expression in ethanol+TAA group. D: Immunohistochemistry staining of F4/80 showed the highest expression in the ethanol+TAA group. Macrophage markers, C-C motif chemokine receptor 2 (Ccr2) was also highly expressed in the ethanol+TAA group. E: Liver triglycerides were significantly increased in ethanol+TAA. The mRNA expression of lipid metabolism markers: sterol regulatory element-binding protein 1c (Srebp-1c) and a cluster of differentiation-36 (CD36) were increased, while peroxisome proliferator-activated receptors gamma (PPAR-y) were decreased in ethanol+TAA group. F. Liver oxidative stress markers: Malondialdehyde (MDA) protein showed increased expression, while reduced glutathione (GSH) and superoxide dismutase (SOD) proteins showed decreased expression in ethanol+TAA. Protein expression of heme oxygenase (HO-1, induced by oxidative stress) showed increased expression in the ethanol+TAA group. Values are expressed as means ± SEM. *p < 0.05, **p < 0.01, ***p < 0.001.")
Ethanol and thioacetamide (EtOH+TAA) combination results in aggravated alcoholic liver disease. A: The hepatic expression of α-SMA (alpha-smooth muscle actin) measured by immunohistochemistry showed elevated expression in the ethanol+TAA group. B: The hepatic mRNA expression levels of fibrosis markers (Col-1α1, collagen, type 1, alpha1 and TGF-β, transforming growth factor-ß1) measured by qPCR (real-time polymerase chain reaction) showed elevated expression in the ethanol+TAA group. C: Hepatic mRNA expression of inflammatory (IL-6, interleukin 6; TNF-α, tumor necrosis factor-alpha; IL-10, interleukin-10 and mRNA and protein expression IL-1Ra, interleukin-1 receptor antagonist) and proliferation marker PCNA (proliferating cell nuclear antigen) showed elevated expression in ethanol+TAA group. D: Immunohistochemistry staining of F4/80 showed the highest expression in the ethanol+TAA group. Macrophage markers, C-C motif chemokine receptor 2 (Ccr2) was also highly expressed in the ethanol+TAA group. E: Liver triglycerides were significantly increased in ethanol+TAA. The mRNA expression of lipid metabolism markers: sterol regulatory element-binding protein 1c (Srebp-1c) and a cluster of differentiation-36 (CD36) were increased, while peroxisome proliferator-activated receptors gamma (PPAR-y) were decreased in ethanol+TAA group. F. Liver oxidative stress markers: Malondialdehyde (MDA) protein showed increased expression, while reduced glutathione (GSH) and superoxide dismutase (SOD) proteins showed decreased expression in ethanol+TAA. Protein expression of heme oxygenase (HO-1, induced by oxidative stress) showed increased expression in the ethanol+TAA group. Values are expressed as means ± SEM. *p < 0.05, **p < 0.01, ***p < 0.001.
Inflammation is a critical component of alcoholic liver disease. Hepatic macrophages were identified using F4/80 immunostaining. All treatment groups showed increased F4/80 expression. EtOH+TAA showed a 2-fold increase (p = 0.016, Fig. 3 D) compared to Ethanol alone. In addition, the mRNA expression of other macrophage markers Ccr2 was also increased (p = 0.82) in the livers of the TAA group when compared to the ethanol group, whereas EtOH+TAA treated mice showed a moderate and significant increase (1.67-fold change) in comparison to Ethanol alone (p = 0.05, Fig. 3 D).
EtOH+TAA group showed increased levels of hepatic triglycerides compared to plain alcohol (1.5-fold increase, p = 0.001, Fig. 3 E). An increase in the mRNA expression of fat deposition markers, CD-36 and Srebp-1c in treated animals further confirmed this. CD-36 was highly expressed in EtOH+TAA (p = 0.016, Fig. 3 E). Fat deposition regulator PPAR-γ showed a 1.5-fold reduction in the EtOH+TAA group (p = 0.001), suggesting a dysregulation of lipid metabolism. Ethanol-induced oxidative stress markers [30], were assessed in the hepatic tissues. MDA activity showed a 2-fold increase in the EtOH+TAA group (p = 0.002, Fig. 3 F), while GSH and SOD showed a reduction by 1.5-fold (p = 0.004 and p = 0.005 respectively, Fig. 3 F). In response to oxidative stress, mRNA levels of HO-1 were also significantly increased in the EtOH+TAA group (2-fold, p = 0.005, S. Fig 3), consistent with its protein expression (Fig. 3 F). In summary, these results suggest that animals with the combined treatment group EtOH+TAA exhibited phenotypes related to human AAH, such as exacerbated liver injury, activation of hepatic stellate cells, fibrosis, lipid accumulation, and oxidative stress [31].
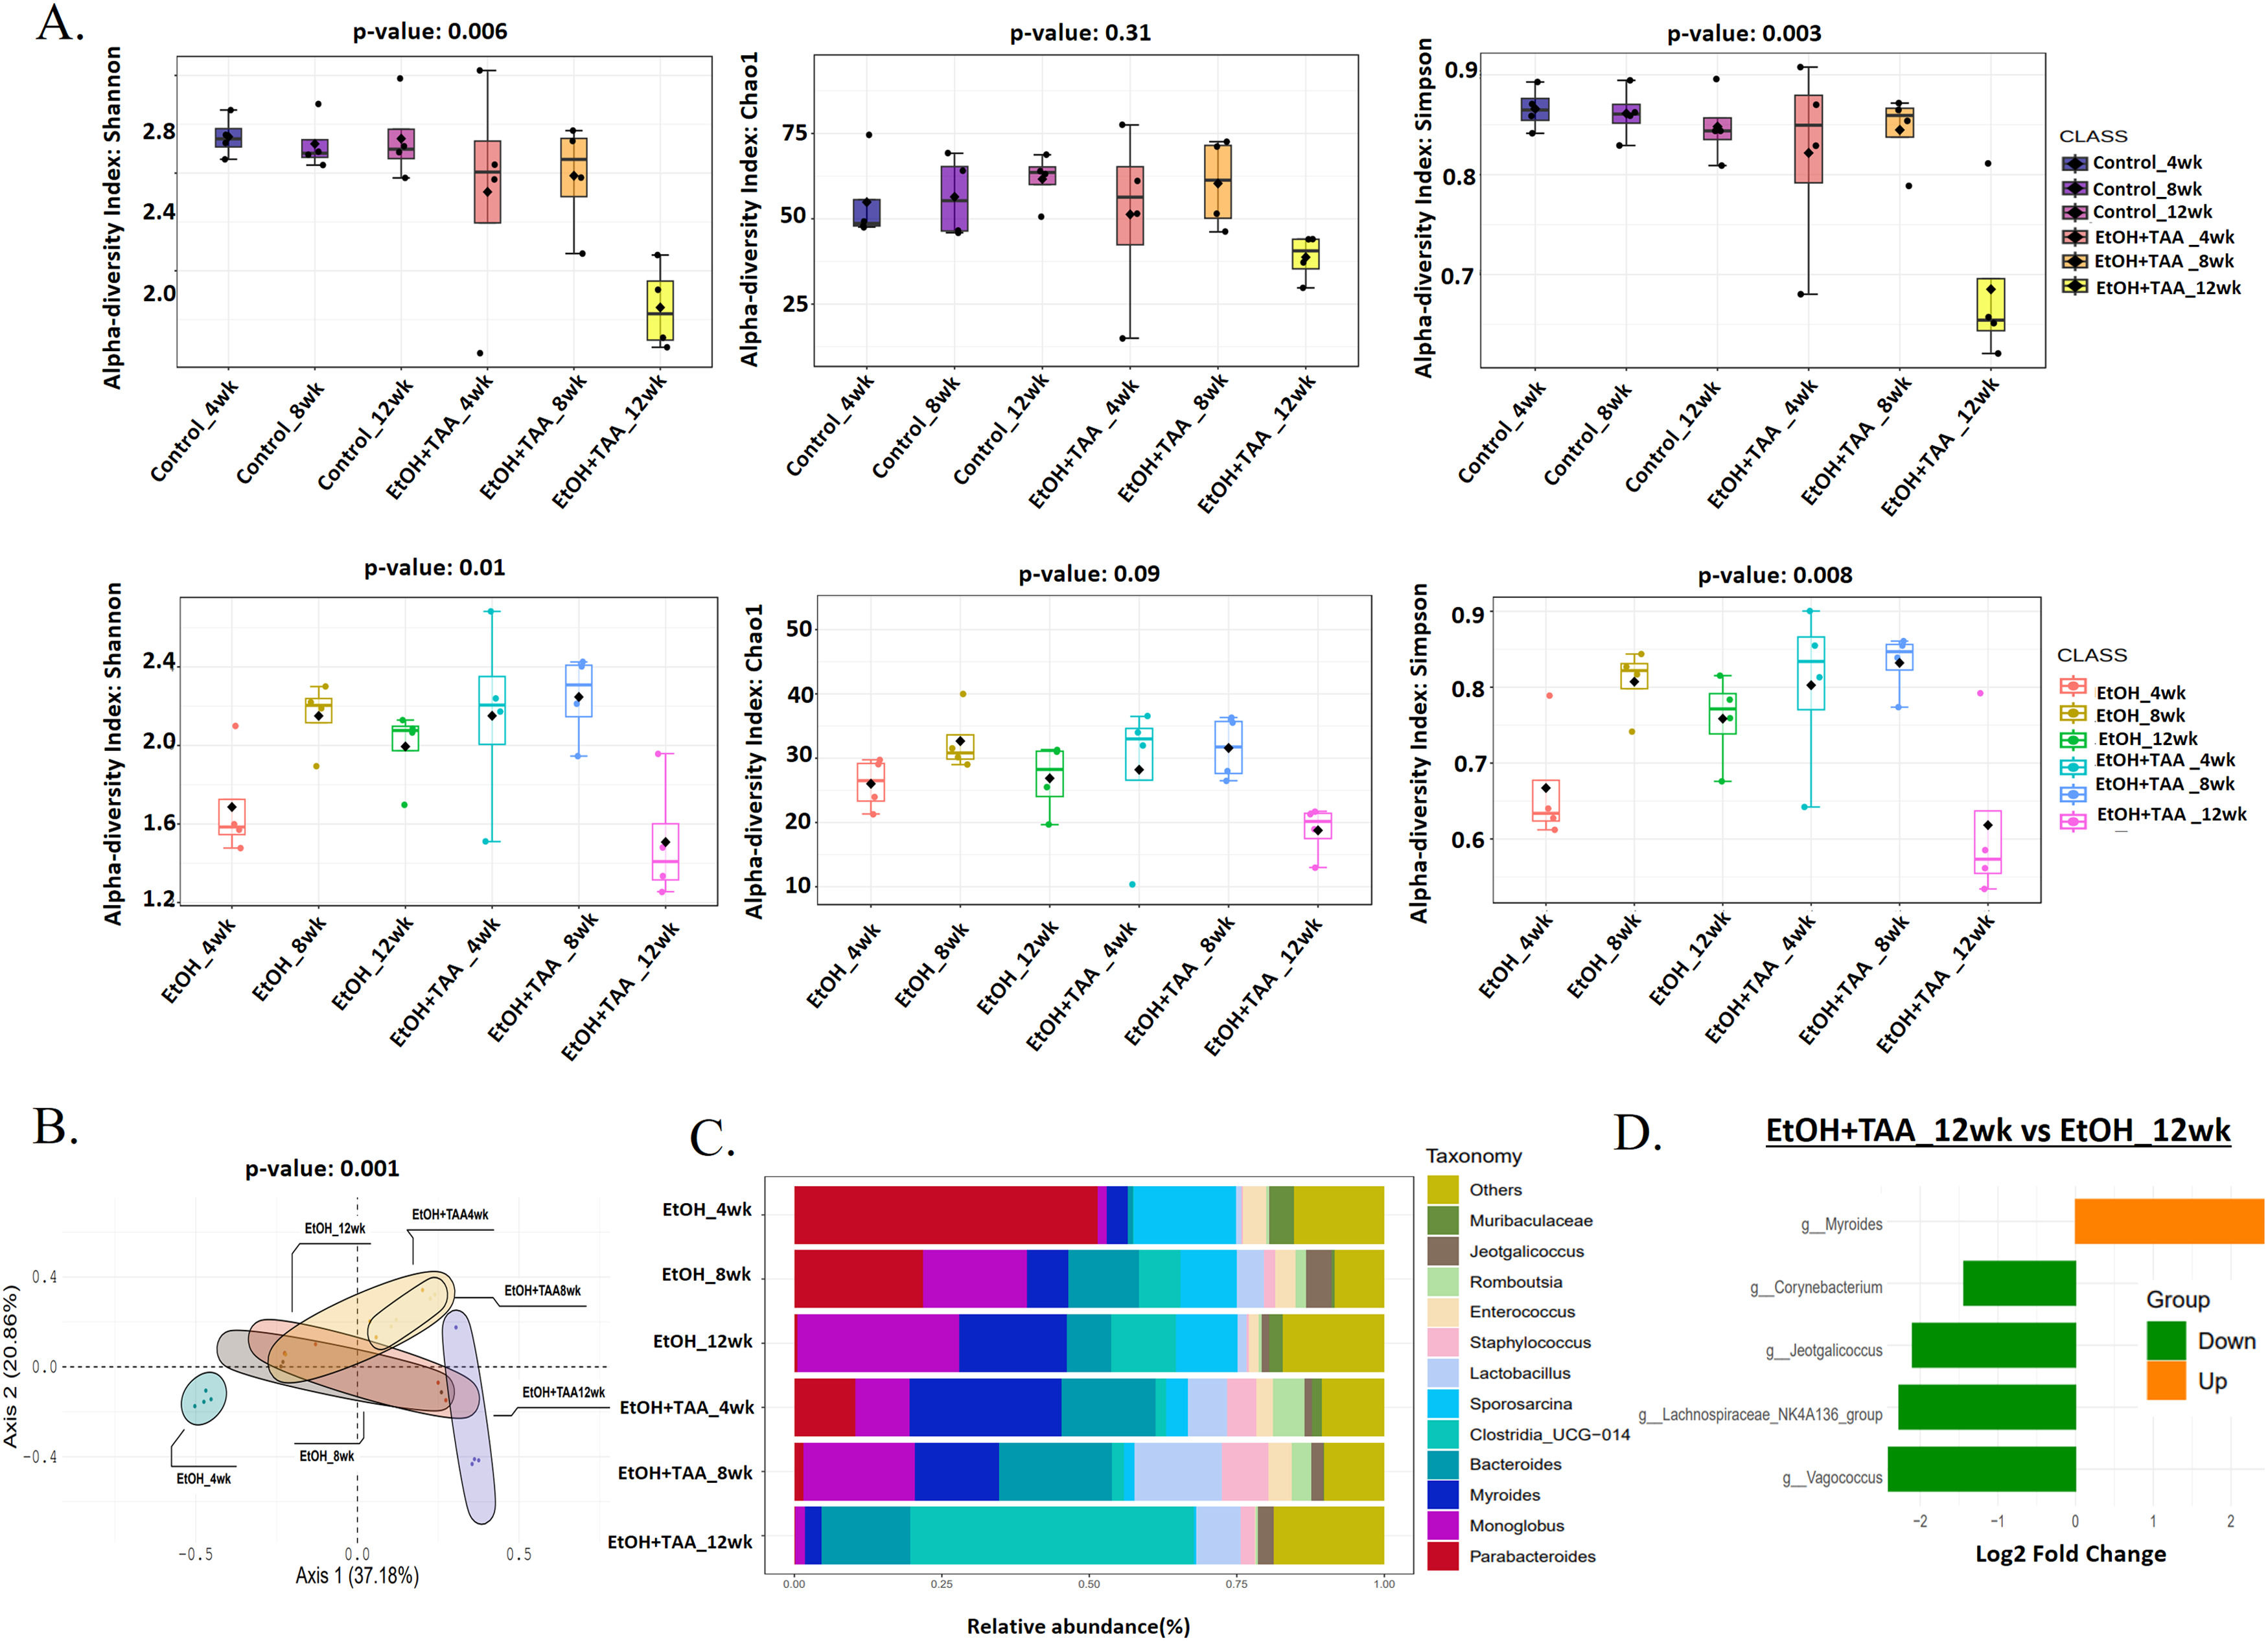
3.4EtOH+TAA induces gut microbiome change in mice model during AAH progressionShannon diversity decreased significantly by 30 % (p = 0.006) at 12wk in the EtOH+TAA group compared to HC at 12wk (Fig. 4 A). Rare species, calculated by the Chao1 index, followed the same trend but were not significant (p = 0.31). The evenness of the community distribution in EtOH+TAA also decreased significantly by 40 % (p = 0.003) by 12wk compared to HC. Each diversity index initially increased at 4wk and 8wk but decreased as the disease progressed, as was also observed in the ethanol-only group. To investigate the diversity differences between EtOH alone and EtOH+TAA, diversity between these two groups was calculated (Fig. 4 A). At the initial stage of the disease (4wks), the Shannon, Chao1, and Simpson's index increased in EtOH+TAA by 1.3-fold (p = 0.01), 1.2-fold (p = 0.09) and 1.3-fold (p = 0.008) as compared to EtOH alone. But as the disease progressed, i.e., at 12wk, Shannon diversity decreased significantly (p = 0.01) by 30 %, rare species decreased by 30 % (p = 0.09), and the evenness of the community decreased significantly (p = 0.008) by 35 % in EtOH+TAA group. Principal coordinate analysis (PCoA) using the Bray-Curtis dissimilarity index showed significant variation (p = 0.004) in the community composition of EtOH alone and EtOH+TAA groups (Fig. 4 B). The first two components showed a total variation of 75.1 % between these two groups at different time points.
. C: Relative abundance of prevalent microbiota at the EtOH and EtOH+TAA group genus level. D: Bar chart showing significant differential gut bacteria between EtOH+TAA vs EtOH at 12wk at the genus level (p < 0.05, FC>1.5).")
Combined treatment with EtOH+TAA induces gut microbiome change in mice model during disease progression. A: Alpha diversity calculated using Shannon, Simpson, and chao1 index between EtOH+TAA vs HC and EtOH+TAA vs EtOH groups showed a significant decrease at 12wk. B: PCoA using the Bray–Curtis dissimilarity metric between EtOH+TAA and EtOH at 4, 8, and 12wk showed significant variation in community composition (p = 0.004). C: Relative abundance of prevalent microbiota at the EtOH and EtOH+TAA group genus level. D: Bar chart showing significant differential gut bacteria between EtOH+TAA vs EtOH at 12wk at the genus level (p < 0.05, FC>1.5).
Composition differences in the gut microbiota at the phylum level in healthy Ethanol alone and combined EtOH+TAA groups across the time points were analyzed. A total of ten bacterial phyla, including Firmicutes, Bacteroidetes, Proteobacteria, Actinobacteria, Deferribacterota, Verrucomicrobia, Desulfobacteria, Campylobacteria, Patescibacteria, and Cyanobacteria were present in all groups (S-Fig 4). At the genera level, Staphylococcus and Bacteroides relatively increased, while Monoglobus, Sporosarcina, Enterococcus, and Parabacteroides relatively decreased in the EtOH+TAA group at 12wk (Fig. 4 C). Next, differential taxa were analyzed between EtOH+TAA and EtOH at 12wk (Fig. 4 D). Myroides increased 2.4-fold significantly (p = 0.03) in EtOH+TAA 12wk in comparison to EtOH alone. There was a significant 2.4-fold decrease in Vagococcus (p = 0.03; commensal bacteria) and Lachnospiraceae_NK4A136_group (p = 0.04; SCFA-producing bacteria), 2-fold decrease in Jeotgalicoccus (p = 0.03) and 1.5-fold decrease in Corynebacterium (p = 0.04; potential probiotic) in EtOH+TAA 12wk group as compared to EtOH 12wk (Supplementary Table- 3).
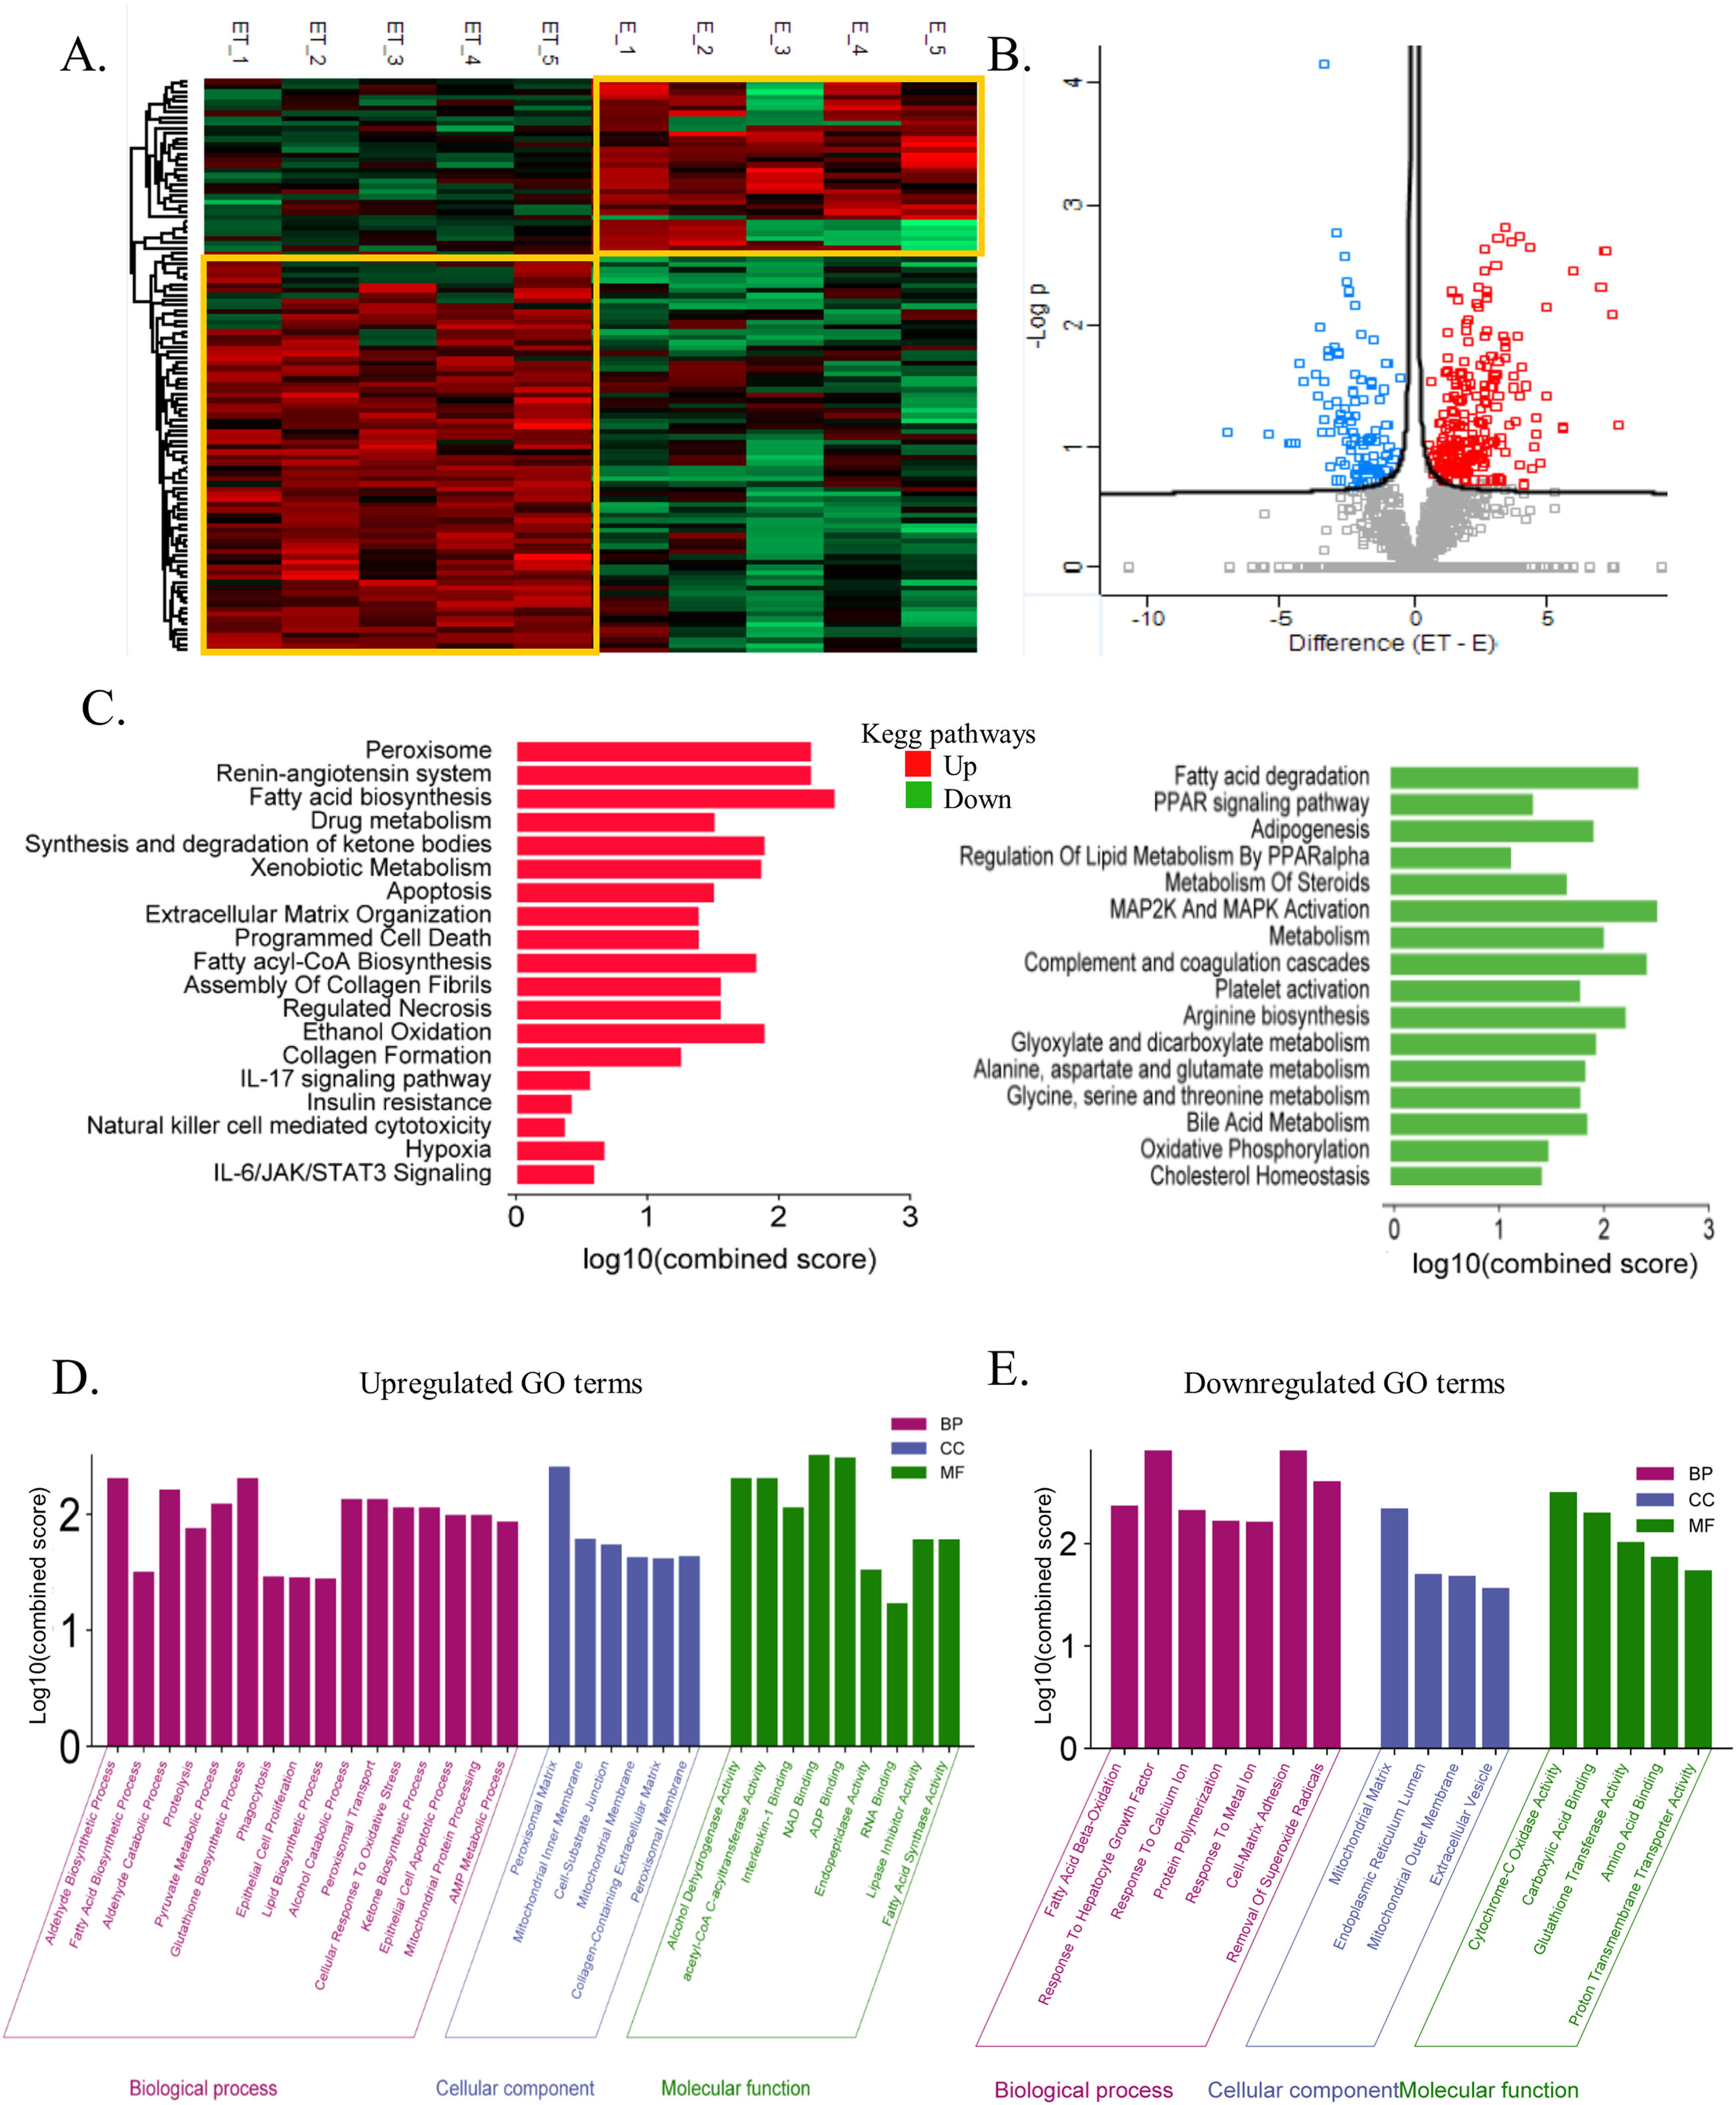
3.5The global liver proteome identifies phenotypes associated with alcoholic liver diseaseTo further elucidate the mechanism of alcohol-associated liver injury and fibrosis, proteome was performed on the liver tissue of an alcoholic mouse model with and without TAA exposure. A total of 4292 proteins were identified. Unsupervised clustering analysis clearly showed the distinction between EtOH+TAA and EtOH (Fig. 5 A) into two distinct clusters. The volcano plot shows significantly differentially abundant proteins between EtOH and EtOH+TAA (Fig. 5 B). In the EtOH+TAA group, 110 differentially expressed proteins (DEPs) were found when compared to the EtOH group; of them, 82 were upregulated, and 28 were downregulated (fold change ± 1.5, p<0.05, Supplementary Table- 4a). Among these, ADH5 (alcohol dehydrogenase-5), ATP5F1 (ATP synthase), GP1 (glucose-6-phosphate isomerase-1), Collagen type 1 alpha 1 (Col1α1), FASN (fatty acid synthase) were a few proteins that were upregulated, and ALB (albumin), ACADL (acyl-Coenzyme A dehydrogenase), ACY1 (aminoacylase-1), SOD1 (superoxide dismutase-1) were downregulated in the EtOH+TAA when compared to the EtOH group.
 groups showed a clear distinction between the groups. B: Volcano plot showing significantly changed proteins (p < 0.05, t-test; Fold change>1.5) in mice livers between EtOH and EtOH+TAA group. C: Kyoto Encyclopedia of Genes and Genomes (KEGG) pathways upregulated and downregulated in EtOH+TAA. D: Gene ontology (GO) terms upregulated in EtOH+TAA. E: GO terms downregulated in EtOH+TAA.")
The global liver proteome identifies phenotypes associated with alcohol-associated hepatitis at 12 weeks. A: Heatmap analysis between EtOH and EtOH+TAA (ET) groups showed a clear distinction between the groups. B: Volcano plot showing significantly changed proteins (p < 0.05, t-test; Fold change>1.5) in mice livers between EtOH and EtOH+TAA group. C: Kyoto Encyclopedia of Genes and Genomes (KEGG) pathways upregulated and downregulated in EtOH+TAA. D: Gene ontology (GO) terms upregulated in EtOH+TAA. E: GO terms downregulated in EtOH+TAA.
We then performed the KEGG pathway enrichment analysis for significantly upregulated and downregulated proteins. EtOH+TAA led to upregulation of hepatic extracellular matrix organization (CS=1.41; CTRB1, Col1α1, COL6A3, PLG, NID1, PLEC), assembly of collagen fibrils (CS=1.59) and collagen formation (CS=1.28; COL6A3, Col1α1, PLEC), which contributes to hepatic fibrosis. Hepatic necrosis (CS=1.59; FASN, CYCS), ethanol oxidation (CS=1.93; ADH5), apoptosis (CS=1.5; GSN, FASN, CYCS, PLES), hypoxia (CS=0.68; GPI, TPI1), insulin resistance (CS=0.42; PCK2), IL-6/JAK/STAT3 signaling (CS=0.59; HAX1), pyruvate metabolism (CS=2.57; HAGH, ACACA, ACAT2, PCK2), fatty acid biosynthesis (CS=2.48; FASN, ACACA), metabolism of xenobiotics by cytochrome P450 (CS=1.91; GSTA, ADH5), and synthesis of ketone bodies (CS=1.93; ACAT2) also get upregulated, which are the typical pathways that get perturbed by Ethanol (Fig-5C, Supplementary Table- 4b). Downregulated pathways were cholesterol homeostasis (CS=1.43; LGMN), PPAR signaling pathway (CS=1.35; ACADL, PPARy) causing impaired lipid metabolism, bile acid metabolism (CS=1.87; AGXT, SOD1), oxidative phosphorylation (CS=1.50; CYB5A, ACAA2), complement and coagulation cascades (CS=2.44; FGA, SERPINA1D, FGG), fatty acid degradation (CS=2.35; ACAA2, ACADL), and arginine biosynthesis (CS=2.23; ACY1), glyoxylate and dicarboxylate metabolism (CS=1.95; AGXT) (Fig. 5 C, Supplementary Table- 4c).
We then analyzed gene enrichment for gene ontology terms. EtOH+TAA induced upregulation of aldehyde (CS=2.31; ADH5), fatty acid & lipid (CS=1.5; FASN, ACACA), ketone (CS=2.05; TPI1), and glutathione (CS=2.31; HAGH) biosynthetic processes. It also upregulates phagocytosis (CS=1.46; GSN, CORO1C), cellular response to oxidative stress (CS=2.05; DHFR), alcohol catabolic processes (CS=2.13; AKR1D1), alcohol dehydrogenase (CS=2.31; ADH5), fatty acid synthase activity (CS=1.99; FASN), and collagen-containing extracellular matrix (CS=1.62; ANXA6, COL6A3, PLG, NID1, CTSC, HSP90B1), which again proved that this animal model exhibits fibrosis (Fig. 5 D). EtOH+TAA led to downregulation of fatty acid beta-oxidation (CS=2.37; ACCA2, ACADL; which causes triglycerides to accumulate in the liver), cell-matrix adhesion (CS=2.91; FGA, FGG), and response to hepatocyte growth factor (CS=2.91; LGMN). It also downregulated the removal of superoxide radicals, which cause oxidative stress (CS=2.60; SOD1), cytochrome c oxidase & proton transmembrane transporter (CS=2.50; CYB5A), and glutathione transferase activity (CS=2.01; GSTT1) (Fig. 5 E).
We also compared other groups (Ethanol vs. Control and EtOH+TAA vs. Control); their details are provided in S-Fig 5 and 6. The PCA plot clearly distinguishes EtOH and the control group (S-Fig 5C). Purine-containing compounds and cytoskeleton organization were found to be upregulated in EtOH (S-Fig 5E). At the same time, the biosynthesis of amino acids, drug metabolism, and the TCA cycle were downregulated by Ethanol (S-Fig 5F). EtOH+TAA and the control group also separated when compared using PCA (S-Fig 6C). In the EtOH+TAA group, the lipid metabolic process, drug metabolic process, and oxidation-reduction process were upregulated (S-Fig E). In contrast, the peptide biosynthetic process and protein-containing complex assembly were downregulated (S-Fig 6F). Protein expression of Col1α1 and PPAR-γ was further validated by western blots (S-Fig 7). Therefore, our EtOH+TAA mouse model of alcoholic liver disease was able to mimic the clinical phenotype of alcoholic hepatitis at 12 weeks.
4DiscussionIn this study, we developed a mouse model of alcoholic liver disease that demonstrates hepatic proteome and gut bacterial variations along with biochemical parameters similar to those of human AAH patients. Even though several experimental models of alcoholic steatohepatitis in mice are available, the reproducibility of human AAH features and hepatic fibrosis is not accurately represented [32]. In contrast to other models, we elicited fibrosis through a chronic mouse model of ad libitum alcohol feeding in combination with thioacetamide (TAA), which acts as a fibrosis accelerator [13]. Our model also exhibited impaired lipid metabolism, increased liver inflammation, activation of hepatic stellate cells, and enhanced oxidative stress. Proteome analysis in the present study characterized variations in hepatic protein expression and compared the pathways in this mouse model to human alcohol-associated liver disease. Also, alcoholic hepatitis was established much faster than the prevailing mice models of chronic alcoholic hepatitis [32].
Chronic metabolic illnesses such as obesity, metabolic syndrome, diabetes, and cardiovascular disease are linked to gut dysbiosis [33]. It is also well known that gut microbiota and chronic liver disease are connected. Alcohol liver disease (ALD) progression and microbiota function are still poorly understood. We investigated microbiota composition and diversity changes at different time points for 4, 8, and 12 weeks in mice to understand microbial change during disease progression. Alpha- and beta-diversity analysis revealed that gut microbial diversity was significantly lesser than that of healthy control at 12 weeks peak injury. Firmicutes were the most common phylum, followed by Bacteroidetes, as previously reported [34]. Human studies have shown that dominant microbial anaerobes, such as the genera Bacteroides and Ruminococcus, were reduced, whereas the genus Streptococcus was prominent in alcoholic patients [33]. Compared to EtOH alone, the combined treatment group shows significant alterations in gut microbiota associated with the development of liver disease. A relative increase of phyla Desulfobacteria, Campylobacteria, and Patescibacteria characterizes the alterations. Desulfobacteria is also reported to be enriched in AAH patients [33]. At the genera level, Staphylococcus and Bacteroides relatively increased while Monoglobus, Sporosarcina, Enterococcus, and Parabacteroides decreased with disease progression and increased disease severity. Staphylococcus has been found to be increased [36] in alcoholics while Enterococcus has been shown to be decreased [32]. Also, in differential analysis, beneficial bacteria Lachnospiraceae_NK4A136_group [34] and Corneybacterium [37] decrease with disease severity. These results suggest that the bacterial microbiota composition in the animal model changes with the progression and stage of liver disease similar to those in patients.
Continuous administration of ethanol results in hepatotoxicity with mild to minimal liver fibrosis in animal models [12]. Pre-clinical studies by Kisseleva et al. showed that intragastric feeding of alcohol in mice resulted in diffuse pericellular liver fibrosis only in combination with high-fat/western diet pre-treatment [38]. TAA or CCl4 increases alcohol-induced liver fibrosis by modulating adaptive and innate inflammatory responses, activating stellate cells into myofibroblast-like cells, and promoting dysbiosis and gut permeability [22]. We found that TAA accelerates liver fibrosis in alcoholic mice, as evident by the increase in Col1α1, ICAM- and MMP-2/TIMP-1 ratio. Increased Tgf-ß, α-sma, and Col1α1 demonstrated activation of hepatic stellate cells and further caused liver fibrosis. Liver inflammation was also increased, as evident by the increase in cytokines IL6, TNF-α, IL1-Ra, macrophage marker F4/80, and recruiter Ccr2. This is reasonable, as TAA and alcohol cause inflammation and oxidative damage [39,40].
The proteome analysis nearly matched the pathophysiology of the liver in human alcoholic hepatitis. The proteins that have been discovered have a variety of roles in the metabolism of Ethanol, fatty acids, and lipids, as well as oxidative stress. Since mitochondria are known to be the site of oxidative damage, it is unsurprising that many differentially expressed proteins are mitochondrial proteins (such as those involved in Ethanol and fat metabolism). Increased MDA activity and decreased GSH and SOD levels were additional indicators of liver oxidative stress. As a result, any treatment that causes stress, such as prolonged exposure to alcohol, is expected to affect the expression of mitochondrial proteins [41]. Our findings demonstrate that alcohol use enhances the expression of liver proteins involved in the metabolism of fat (FASN), which probably indicates a higher need for energy in alcoholic hepatitis [41,42]. An increase in ATP synthase also supports the increase in ATP generation [41]. We could find multiple hepatic pathways upregulated in our model similar to human alcoholic hepatitis disease, such as ethanol oxidation, hypoxia causing oxidative stress, fatty acid biosynthesis, necrosis, extracellular matrix organization, assembly of collagen fibrils, and collagen formation, which resulted in extensive fibrosis in the animal model [43]. Also, our model exhibited downregulation of the hepatic PPAR signaling pathway, which results in impaired lipid metabolism and decreased fatty acid beta-oxidation in hepatocytes, which is the key mechanism leading to alcoholic liver injury [44]. This was confirmed by increased hepatic triglyceride levels, mRNA expressions of CD-36 and Srebp-1c, and decreased mRNA and protein expression of PPAR-γ.
5ConclusionsOur findings suggest that many early-stage disease conditions and kinetic studies could not be conducted in human patients due to ethical concerns. Models of liver diseases thus provide a method to overcome this issue. The model must mimic human disease as far as possible (given that gene and protein composition vary in different species). The model presented here is such an attempt in which studies on early-stage molecular interactions between the liver and gut, immune cells, and alcohol injury in the liver, or the potential of novel therapeutic drugs could be tested. It can also be employed to investigate the microbiome's role in AAH progression and to test human disease-related microbiome-modulating therapies. The EtOH+TAA mouse model exhibited pathological features similar to those of patients with alcoholic hepatitis, such as activation of hepatic stellate cells, increased fat deposition, hepatocyte regeneration, impaired lipid metabolism, and oxidative stress.
Author contributionsSS and SKS conceptualized the design of the model. AM, N, SC, and AK were responsible for experimental work and sample processing. Histological analysis was performed by AR and data analysis was performed by GK, AM, N, SC, JSM, and SS. The results were reviewed by SS, JSM, and SKS. AM, N, and SC drafted the manuscript. SS and SKS proofread the manuscript. This manuscript has been approved by all authors.
Uncited referencesThe work was supported by project DST SERB (grant number EMR/2016/007622, 2018) and ICMR (grant number 2017-0924, 2017)


