


Nonalcoholic fatty liver disease (NAFLD) is a common clinical condition and an important public health problem. Some epidemiological studies have suggested that soft drinks (SD) intake is associated with NAFLD. However, the evidence is inconsistent. Our objective was to assess the association between SD consumption and the risk of NAFLD in the Mexican adult population.
Materials and MethodsA total of 1,759 participants from the Health Workers Cohort Study (HWCS) were included in the analyses. SD intake was measured using a validated food frequency questionnaire. We classified SD consumption as follows: a) less than 1 serving per week, b) 1 to less than 3.5 servings per week, and c) 3.5 or more servings per week. Hepatic steatosis index (HSI) was calculated based on sex, BMI, and blood transaminase levels, and was categorized as NAFLD ≥ 36. To assess the relation between SD and NAFLD, we followed two approaches: fixed effects logistic regression and generalized estimating equations.
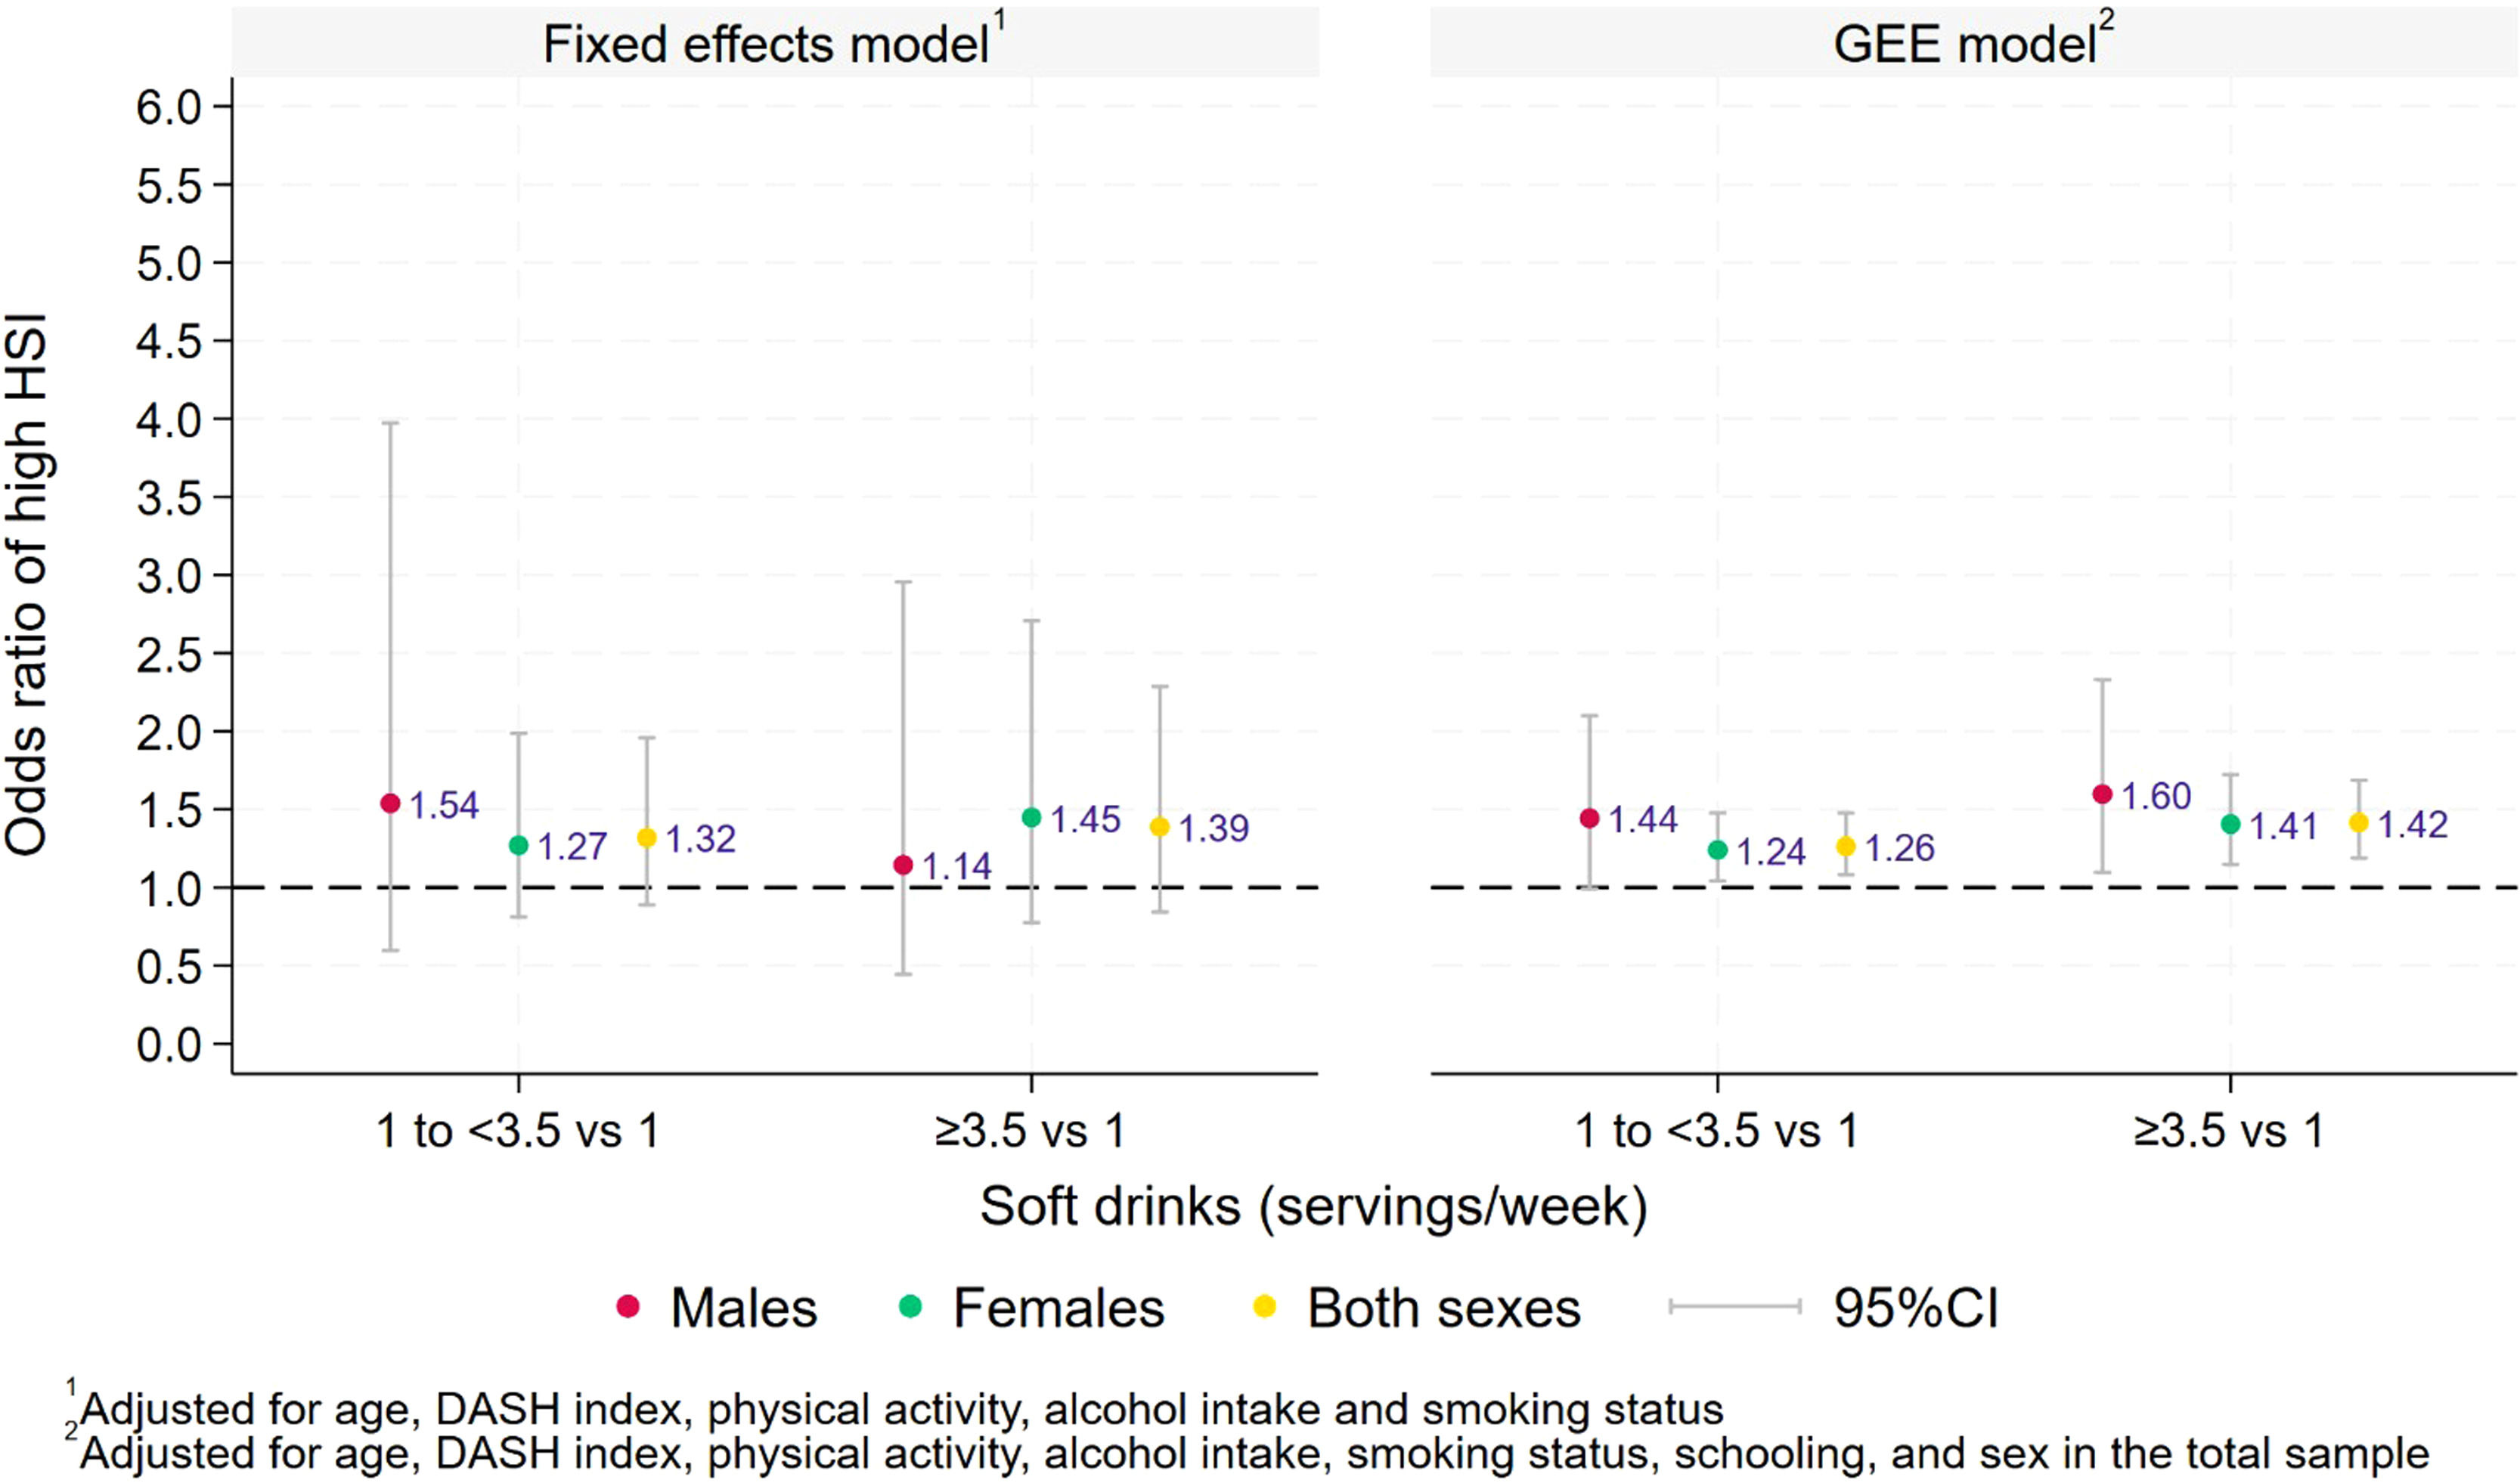
ResultsAfter adjusting for demographic characteristics, lifestyle factors, and dietary intake, the odds ratio (OR) and 95 % confidence interval (95 % CI) for NAFLD were 1.26 (95 % CI: 1.03, 1.55) for 1 to less than 3.5 servings per week and 1.42 (95 % CI: 1.15, 1.74) for ≥3.5 servings/week category in both sexes. When stratifying the analysis by sex, we observed that the association was greater in men than in women.
ConclusionsThe results from our prospective study indicate that SD consumption is associated with an increased risk of NAFLD.
Nonalcoholic fatty liver disease (NAFLD) is the most common liver disease affecting an estimated 20–30 % of the global population [1,2]. The main risk factors associated with NAFLD are obesity and metabolic disorders such as insulin resistance, type 2 diabetes (T2D), and dyslipidemia, which are all highly prevalent in the Mexican population [3].
Liver enzyme concentrations, such as alanine aminotransferase (ALT), aspartate aminotransferase (AST), and gamma-glutamyl transferase (GGT) have been used as a proxy for NAFLD at the population level. Although not all people with elevated liver enzyme levels have or will progress to NAFLD, these clinical measures are broadly recognized as appropriate to identify and monitor those who are potentially at risk [4]. In addition, different scores have been developed to predict NAFLD, such as the fatty liver index (FLI) [5] and the hepatic steatosis index (HSI) [6], which may offer a reasonably accurate, inexpensive, and noninvasive tool; being the HSI one of the most used worldwide [7].
The clinical definition of NAFLD is not straightforward, because it includes a spectrum of disease states. NAFLD consists of a variety of liver diseases ranging from simple steatosis to nonalcoholic steatohepatitis (NASH), distinguished by disproportionate fat accumulation in the liver and the lack of significant alcohol consumption or any secondary causes for hepatic steatosis. Simple steatosis is characterized by liver fat infiltration in >5 % of the hepatocytes and is generally indolent, while NASH involves fibrosis and may lead to cirrhosis and hepatocellular carcinoma [8,9]. NAFLD has been linked to higher liver-related morbidity and mortality, as well as a greater risk of cardiovascular disease (CVD), T2D, and chronic kidney disease [10,11].
Recently, various hepatic scientific organizations have updated the terminology pertaining to liver diseases with the aim of achieving greater precision in characterization. One such term introduced for this purpose is Metabolic Associated Steatotic Liver Disease (MASLD). MASLD is defined by the absence of any alternative etiologies of steatosis and the presence of one or more of five metabolic risk factors (MRF). In contrast, NAFLD is characterized by the absence of competing causes of steatosis[11]. This differentiation holds significant importance for the precise classification and management of the disease.
Changes in dietary behaviors have been observed during the last few decades, including an increase in the indiscriminate use of sugar, soft drinks (SD), and other sugar-sweetened beverages (SSBs) [12]. SD, which contains substantial amounts of added sugars, are the most popular SSBs in various populations [13]. For example, in the last 30 years, per capita intake of SSBs more than doubled, from 64 to 142 kcal/day [14], contributing to a large proportion of the added sugars consumed in the United States [15,16]. A similar trend has been observed in Mexico, where SD intake accounts for an estimated 207 kcal/day, based on results from the 2012 Mexican National Health and Nutrition Survey [17]. Additionally, it has been reported that SSBs are the main source of added sugars in the Mexican adult population, and they make up 74 % of the added sugar intake [18].
Some evidence suggests that fructose, one of the main caloric sweeteners used in SSBs [19], induces hepatic inflammation and insulin resistance, thereby fueling the development of NAFLD [20,21]. In addition, fructose metabolism could promote the hepatic lipogenesis pathway and regulate lipogenic gene expression in the liver [22]. Thus, SD consumption may increase the risk of developing NAFLD [23–26].
Some studies have suggested that SD consumption is associated with a higher likelihood of NAFLD, even in the absence of traditional risk factors [27,23]. However, most studies were cross-sectional and could be subject to reverse causation [23–26]. Only two prospective cohort studies conducted in the same cohort form China found that consumption of ultra-processed food consumption [28], specially SDs consumption in the adult population was associated with an increased risk of NAFLD [29]. However, these results may not apply to the Mexican adult population due to different lifestyles, disease susceptibility, and confounders. Thus, the objective of this prospective cohort study was to examine the association between SD consumption and the risk of NAFLD (as evaluated by HSI) as well as the risk of elevated liver enzyme levels in the Mexican adult population.
2Materials and methods2.1Study populationThe Health Workers Cohort Study (HWCS) is a longitudinal study that began in 2004–2006. The study design, protocol, and procedures have been reported elsewhere [30]. Participants, who were predominantly female, were mostly employees of the Mexican Social Security Institute (IMSS, for its Spanish acronym) and their relatives, who reside in Cuernavaca, Morelos. The eligibility criteria for this analysis at baseline were as follows: adult male and female (≥20 years old); with information on ALT/AST levels and those with total energy intakes between 500 kcal/day and 6500 kcal/day [31]. From 2010 to 2012, 1744 individuals who met eligibility criteria were invited to continue their participation, and 1627 of them responded (response rate of 93 %). In addition, 186 new participants were enrolled. From 2016 to 2018, a new invitation was done and a total of 1012 subjects attended the invitation, of which 186 were recruited in 2010–2012. As a complete case analysis was performed, individuals with less than two complete measurements in the variables of interest were excluded. From the missing pattern analysis, the variable contributing the most to missing data was truncal fat, followed by HSI and glucose. Due to the diverse missing patterns across variables, specifying which measurement data were missing was challenging. Supplementary Figure 1 includes the number of individuals excluded for each follow-up pattern. Thus, 1412 participants were included in the analyses; of these, 54.5 % of the participants had complete information in the first and second waves, 30 % had information in all three waves, 9.9 % in the second and third waves, and 5.5 % in the first and third waves.
2.2Definition of dependent variables / NAFLD assessment2.2.1Aminotransferase levelsAfter a fasting period of 8 to 14 h, venous blood samples were drawn during the clinic visit. Serum alanine aminotransferase (ALT) and aspartate aminotransferase (AST) levels were determined by the catalytic concentration from the rate of decrease of nicotinamide adenine dinucleotide measured at 340 nm using a lactate dehydrogenase coupled reaction [32,33].
2.2.2Assessment of nonalcoholic fatty liver diseaseNAFLD was evaluated using the HSI, which was calculated as follows: HSI=8 × (ALT/AST ratio) + body mass index [BMI] (+2, if female; +2, if T2D). An HSI value ≥ 36 was used as the cut-off point to classify a subject as having NAFLD [6].
2.3Definition of independent variables2.3.1Soft drink consumptionSD was defined as the intake of carbonated drinks such as cola or other flavors and was assessed using a 116-item FFQ, which was previously validated in the Mexican population [34]. Participants reported their usual average consumption of each beverage in the year prior to each assessment, on a scale of ten possible response categories. We then converted the reported intake to servings per day. We considered 12 ounces (355 mL) as a standard serving of these beverages. We classified SD per week consumption as follows: a) <1 serving/week (low consumption), b) 1 to <3.5 servings/week (moderate consumption), and c) 3.5 or more servings/week (high consumption). For the purpose of this study, we do not include diet/zero calories SD.
2.3.2Covariates assessmentStudy participants completed self-reported questionnaires that collected information about other independent covariates, which included age and sex, overall health status (prior diagnosis of T2D), and lifestyle habits (e.g., smoking status, diet, physical activity, and alcohol consumption), at each follow-up period [30]. Fasting glucose levels were measured with the enzymatic colorimetric method by using glucose oxidize with a Selectra XL instrument (Randox) [35]. Leisure time physical activity was evaluated with a previously validated questionnaire [36]. The type of leisure activity, intensity, and duration (hours per week) were used to calculate metabolic equivalents (METs) according to the Physical Activity Compendium [37]. The Dietary Approaches to Stop Hypertension (DASH) score was determined for each participant using the FFQ responses with the method described by Fung et al. [37]. DASH score components include the intake of fruits, vegetables, nuts, legumes, low-fat dairy products, and whole grains, as well as the intake of sodium, sweetened beverages, and red and processed meats. For each of the components, participants were classified into quintiles according to their intake ranking. The healthy food components score was rated on a scale from 1 to 5 according to the quintile value, with a higher score indicating a more frequent consumption of that food. Less healthy components were scored on a reverse scale (5 to 1), with a lower consumption receiving the higher scores. Component scores were summed up to obtain the overall DASH score for each participant. Average alcohol intake (in grams), assessed by self-report using a FFQ, was calculated by multiplying the consumption frequency of each unit of a beverage by the alcohol content of the specified portions with a comprehensive database of food contents[37]. The truncal fat proportion was measured using Dual-energy X-ray absorptiometry (DXA) Lunar DPX NT instrument (Lunar Radiation Corp., Madison, WI) as previously described [30].
2.4Statistical analysisDescriptive data are presented as mean and standard deviation (SD) for continuous variables and as percentages for categorical variables. To analyze longitudinal associations, fixed effects regression models were fitted for the ALT, the AST, and HSI, including the SD consumption categories, age, alcohol intake, METs per week, smoking status, education, and the DASH index as explanatory variables. For a second model, we added the glucose and truncal fat percentage along with the previous explanatory variables. Fixed effects models have the advantage of focusing on within-subject variations isolated from between-subject variations and controlling for time-invariant confounders with time-invariant effects [38].
For modeling NAFLD (as evaluated by HSI), we followed two approaches: fixed effects logistic regression and generalized estimating equations (GEE). Since having a high HSI is not necessarily permanent, we did not exclude those with high HSI in their first measurement. Therefore, a reduction in soft drinks consumption associated to changing from “high” to “not high” HSI can be reflected in our estimates. The fixed effects logistic regression focuses exclusively on within-subject variations and discards all participants who maintained their high HSI status over time. To report higher precision estimates for the associations with SD consumption, we present analyses for the total population and sex-specific odds ratios. For these analyses, we specified a GEE model with a binomial family, logit link function, and an unstructured covariance. Our GEE models combine within and between-subject variations for estimating associations and provide lower standard errors. In contrast to fixed effects logistic regression, our GEE models are susceptible to potential biases from unobserved and time-invariant individual-level effects that may be correlated with SD consumption.
Given that sexual dimorphism in adipose tissue distribution and hepatic substrate metabolism, among other factors, have been proposed to predominantly account for sex differences in tissue-specific insulin sensitivity, likely implicating both insulin-dependent and -independent mechanisms[39], we conducted our analysis stratifying by sex. An alpha value of <0.05 was considered statistically significant. All analyses were performed using Stata 14.0 (StataCorp, Stata Statistical Software, Release 14, 2015).
2.5Ethical statementsThis study was planned and conducted according to the guidelines of the Declaration of Helsinki. All participants signed informed consent before enrollment and initiating data collection activities, and the IMSS Institutional Review Board approved all procedures.
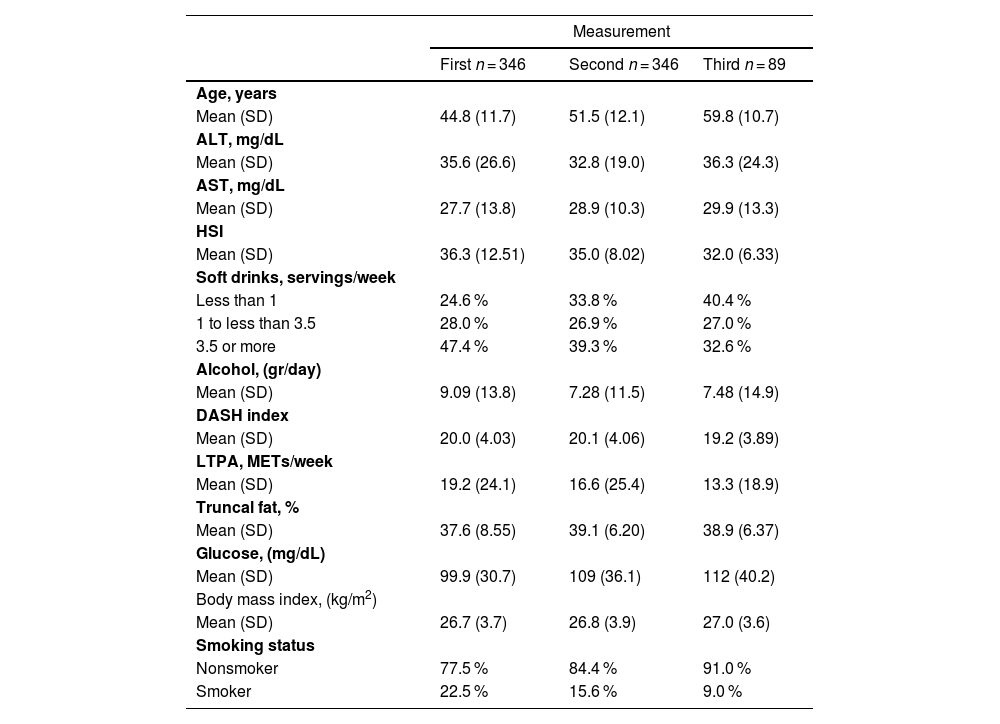
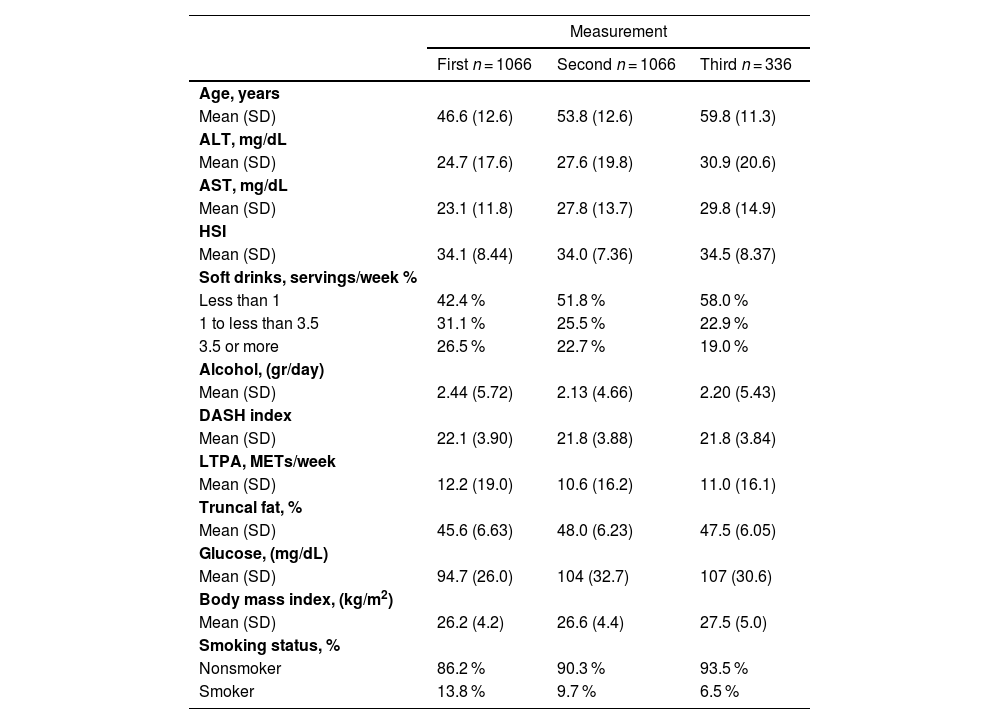
3ResultsThe final analytic sample size for males was — participants with a median age of 44.8 (11.7) years. The median SD intake was 3.1 servings/week. Approximately 28.0 % of males consumed 1 to <3.5 servings per week, and 47.4 % consumed ≥3.5 servings per week. For females, the final analytic sample size — was participants and the median age was 46.6 (12.6). Regarding SD consumption, 31.1 % of females consumed 1 to <3.5 servings per week, and 26.5 % consumed ≥3.5 servings per week (Table 1 and Table 2).
Descriptive characteristics of the study population among men.
ALT, Alanine transaminase; AST, Aspartate aminotransferase; HSI, Hepatic steatosis index; LTPA, Leisure time physical activity; METs, Metabolic equivalent of task; DASH, Dietary Approaches to Stop Hypertension diet.
Descriptive characteristics of the study population among women.
ALT, Alanine transaminase; AST, Aspartate aminotransferase; HSI, Hepatic steatosis index; LTPA, Leisure time physical activity; METs, Metabolic equivalent of task; DASH, Dietary Approaches to Stop Hypertension diet.
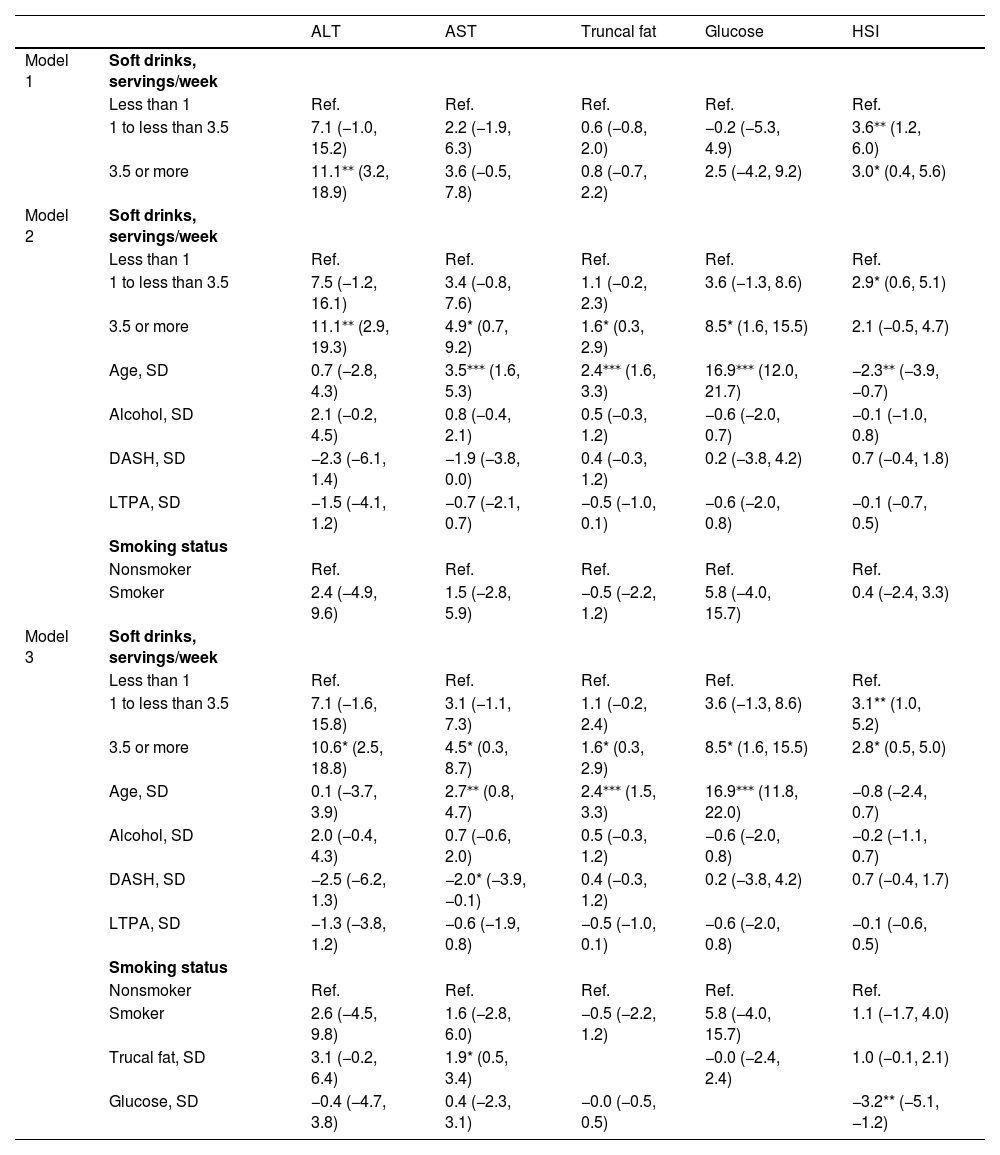
For males, results from the fixed-effects linear regression of the crude model indicate an increase in ALT levels when changing from a low to high consumption of SDs (β=11.1; 95 % CI: 3.2, 18.9), and this association remained statistically significant after adjusting for potential confounders (β=11.1; 95 % CI: 2.9, 19.3for model 2 and β=10.6; 95 % CI: 2.5, 18.8 for model 3). After adjusting for potential confounders, males had an increased risk of NAFLD (based on HSI levels) when changing from a low to high consumption of SDs (β=2.8; 95 % CI: 0.5, 5.0). Age was positively associated with ALT, AST, truncal fat, and glucose in model 2, while in model 3, truncal fat was found to be associated with increased AST levels, and glucose with higher HSI score. (Table 3).
Fixed effects models for estimating within and between subject associations for each outcome variable for men.
| ALT | AST | Truncal fat | Glucose | HSI | ||
|---|---|---|---|---|---|---|
| Model 1 | Soft drinks, servings/week | |||||
| Less than 1 | Ref. | Ref. | Ref. | Ref. | Ref. | |
| 1 to less than 3.5 | 7.1 (−1.0, 15.2) | 2.2 (−1.9, 6.3) | 0.6 (−0.8, 2.0) | −0.2 (−5.3, 4.9) | 3.6⁎⁎ (1.2, 6.0) | |
| 3.5 or more | 11.1⁎⁎ (3.2, 18.9) | 3.6 (−0.5, 7.8) | 0.8 (−0.7, 2.2) | 2.5 (−4.2, 9.2) | 3.0* (0.4, 5.6) | |
| Model 2 | Soft drinks, servings/week | |||||
| Less than 1 | Ref. | Ref. | Ref. | Ref. | Ref. | |
| 1 to less than 3.5 | 7.5 (−1.2, 16.1) | 3.4 (−0.8, 7.6) | 1.1 (−0.2, 2.3) | 3.6 (−1.3, 8.6) | 2.9* (0.6, 5.1) | |
| 3.5 or more | 11.1⁎⁎ (2.9, 19.3) | 4.9* (0.7, 9.2) | 1.6* (0.3, 2.9) | 8.5* (1.6, 15.5) | 2.1 (−0.5, 4.7) | |
| Age, SD | 0.7 (−2.8, 4.3) | 3.5⁎⁎⁎ (1.6, 5.3) | 2.4⁎⁎⁎ (1.6, 3.3) | 16.9⁎⁎⁎ (12.0, 21.7) | −2.3⁎⁎ (−3.9, −0.7) | |
| Alcohol, SD | 2.1 (−0.2, 4.5) | 0.8 (−0.4, 2.1) | 0.5 (−0.3, 1.2) | −0.6 (−2.0, 0.7) | −0.1 (−1.0, 0.8) | |
| DASH, SD | −2.3 (−6.1, 1.4) | −1.9 (−3.8, 0.0) | 0.4 (−0.3, 1.2) | 0.2 (−3.8, 4.2) | 0.7 (−0.4, 1.8) | |
| LTPA, SD | −1.5 (−4.1, 1.2) | −0.7 (−2.1, 0.7) | −0.5 (−1.0, 0.1) | −0.6 (−2.0, 0.8) | −0.1 (−0.7, 0.5) | |
| Smoking status | ||||||
| Nonsmoker | Ref. | Ref. | Ref. | Ref. | Ref. | |
| Smoker | 2.4 (−4.9, 9.6) | 1.5 (−2.8, 5.9) | −0.5 (−2.2, 1.2) | 5.8 (−4.0, 15.7) | 0.4 (−2.4, 3.3) | |
| Model 3 | Soft drinks, servings/week | |||||
| Less than 1 | Ref. | Ref. | Ref. | Ref. | Ref. | |
| 1 to less than 3.5 | 7.1 (−1.6, 15.8) | 3.1 (−1.1, 7.3) | 1.1 (−0.2, 2.4) | 3.6 (−1.3, 8.6) | 3.1** (1.0, 5.2) | |
| 3.5 or more | 10.6* (2.5, 18.8) | 4.5* (0.3, 8.7) | 1.6* (0.3, 2.9) | 8.5* (1.6, 15.5) | 2.8* (0.5, 5.0) | |
| Age, SD | 0.1 (−3.7, 3.9) | 2.7⁎⁎ (0.8, 4.7) | 2.4⁎⁎⁎ (1.5, 3.3) | 16.9⁎⁎⁎ (11.8, 22.0) | −0.8 (−2.4, 0.7) | |
| Alcohol, SD | 2.0 (−0.4, 4.3) | 0.7 (−0.6, 2.0) | 0.5 (−0.3, 1.2) | −0.6 (−2.0, 0.8) | −0.2 (−1.1, 0.7) | |
| DASH, SD | −2.5 (−6.2, 1.3) | −2.0* (−3.9, −0.1) | 0.4 (−0.3, 1.2) | 0.2 (−3.8, 4.2) | 0.7 (−0.4, 1.7) | |
| LTPA, SD | −1.3 (−3.8, 1.2) | −0.6 (−1.9, 0.8) | −0.5 (−1.0, 0.1) | −0.6 (−2.0, 0.8) | −0.1 (−0.6, 0.5) | |
| Smoking status | ||||||
| Nonsmoker | Ref. | Ref. | Ref. | Ref. | Ref. | |
| Smoker | 2.6 (−4.5, 9.8) | 1.6 (−2.8, 6.0) | −0.5 (−2.2, 1.2) | 5.8 (−4.0, 15.7) | 1.1 (−1.7, 4.0) | |
| Trucal fat, SD | 3.1 (−0.2, 6.4) | 1.9* (0.5, 3.4) | −0.0 (−2.4, 2.4) | 1.0 (−0.1, 2.1) | ||
| Glucose, SD | −0.4 (−4.7, 3.8) | 0.4 (−2.3, 3.1) | −0.0 (−0.5, 0.5) | −3.2** (−5.1, −1.2) |
ALT, Alanine transaminase; AST, Aspartate aminotransferase; HSI, Hepatic steatosis index; LTPA: Leisure time physical activity; METs: Metabolic equivalent of task; DASH: Dietary Approaches to Stop Hypertension diet.
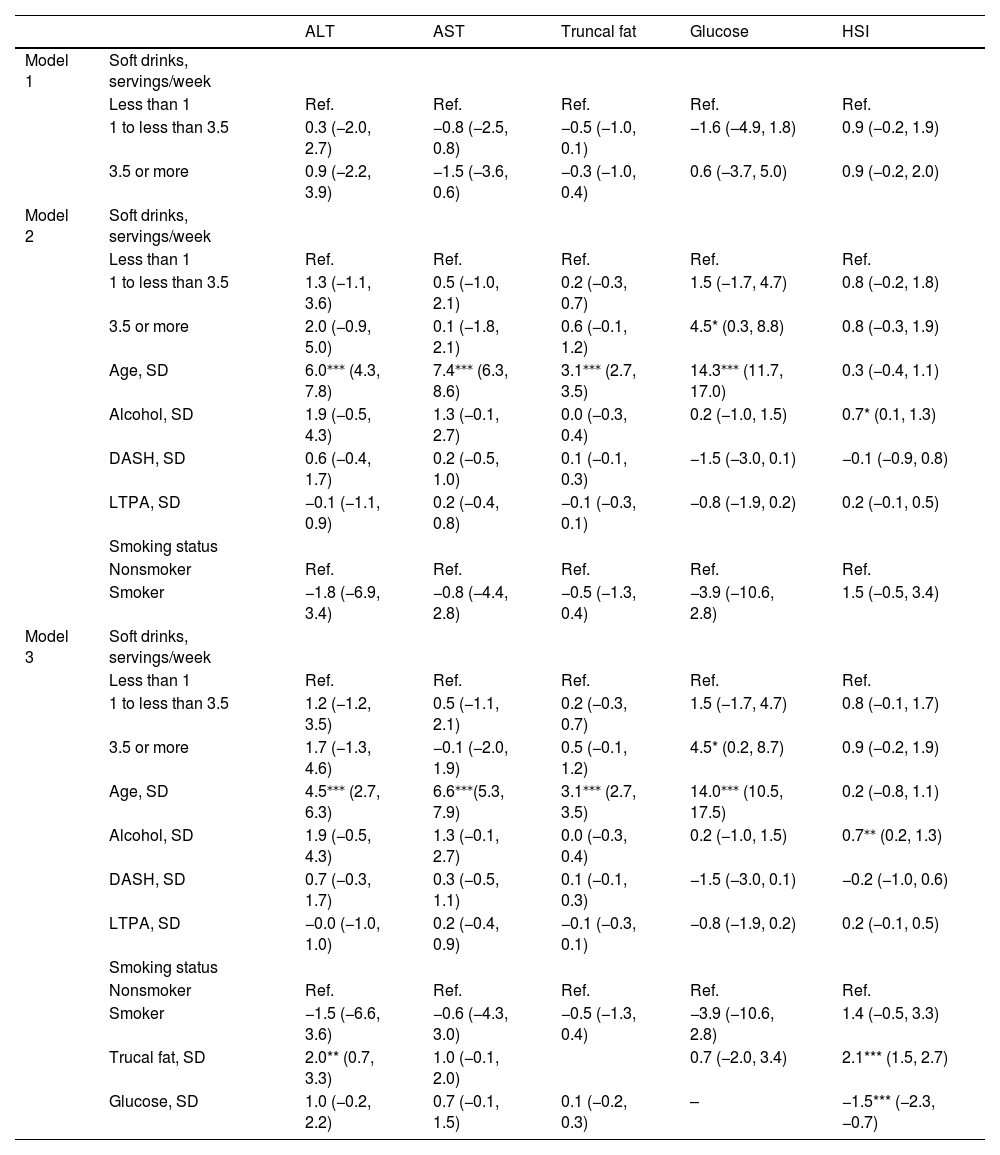
In females, SD consumption was associated with an increased risk of AST, ALT, and NAFLD as determined by the HSI, in the crude model; however, the results were not statistically significant, for example: HSI levels increased when SD consumption changed from a low to high consumption (β= 0.9; 95 % CI: −0.2, 1.9). As observed among males, a positive association was found between age and ALT, AST, truncal fat, and glucose levels in Model 2. A positive association was also observed for truncal fat and ALT and HSI levels, while glucose levels were associated with HSI levels (Table 4).
Fixed effects models for estimating within and between subject associations for each outcome variable for women.
| ALT | AST | Truncal fat | Glucose | HSI | ||
|---|---|---|---|---|---|---|
| Model 1 | Soft drinks, servings/week | |||||
| Less than 1 | Ref. | Ref. | Ref. | Ref. | Ref. | |
| 1 to less than 3.5 | 0.3 (−2.0, 2.7) | −0.8 (−2.5, 0.8) | −0.5 (−1.0, 0.1) | −1.6 (−4.9, 1.8) | 0.9 (−0.2, 1.9) | |
| 3.5 or more | 0.9 (−2.2, 3.9) | −1.5 (−3.6, 0.6) | −0.3 (−1.0, 0.4) | 0.6 (−3.7, 5.0) | 0.9 (−0.2, 2.0) | |
| Model 2 | Soft drinks, servings/week | |||||
| Less than 1 | Ref. | Ref. | Ref. | Ref. | Ref. | |
| 1 to less than 3.5 | 1.3 (−1.1, 3.6) | 0.5 (−1.0, 2.1) | 0.2 (−0.3, 0.7) | 1.5 (−1.7, 4.7) | 0.8 (−0.2, 1.8) | |
| 3.5 or more | 2.0 (−0.9, 5.0) | 0.1 (−1.8, 2.1) | 0.6 (−0.1, 1.2) | 4.5* (0.3, 8.8) | 0.8 (−0.3, 1.9) | |
| Age, SD | 6.0⁎⁎⁎ (4.3, 7.8) | 7.4⁎⁎⁎ (6.3, 8.6) | 3.1⁎⁎⁎ (2.7, 3.5) | 14.3⁎⁎⁎ (11.7, 17.0) | 0.3 (−0.4, 1.1) | |
| Alcohol, SD | 1.9 (−0.5, 4.3) | 1.3 (−0.1, 2.7) | 0.0 (−0.3, 0.4) | 0.2 (−1.0, 1.5) | 0.7* (0.1, 1.3) | |
| DASH, SD | 0.6 (−0.4, 1.7) | 0.2 (−0.5, 1.0) | 0.1 (−0.1, 0.3) | −1.5 (−3.0, 0.1) | −0.1 (−0.9, 0.8) | |
| LTPA, SD | −0.1 (−1.1, 0.9) | 0.2 (−0.4, 0.8) | −0.1 (−0.3, 0.1) | −0.8 (−1.9, 0.2) | 0.2 (−0.1, 0.5) | |
| Smoking status | ||||||
| Nonsmoker | Ref. | Ref. | Ref. | Ref. | Ref. | |
| Smoker | −1.8 (−6.9, 3.4) | −0.8 (−4.4, 2.8) | −0.5 (−1.3, 0.4) | −3.9 (−10.6, 2.8) | 1.5 (−0.5, 3.4) | |
| Model 3 | Soft drinks, servings/week | |||||
| Less than 1 | Ref. | Ref. | Ref. | Ref. | Ref. | |
| 1 to less than 3.5 | 1.2 (−1.2, 3.5) | 0.5 (−1.1, 2.1) | 0.2 (−0.3, 0.7) | 1.5 (−1.7, 4.7) | 0.8 (−0.1, 1.7) | |
| 3.5 or more | 1.7 (−1.3, 4.6) | −0.1 (−2.0, 1.9) | 0.5 (−0.1, 1.2) | 4.5* (0.2, 8.7) | 0.9 (−0.2, 1.9) | |
| Age, SD | 4.5⁎⁎⁎ (2.7, 6.3) | 6.6⁎⁎⁎(5.3, 7.9) | 3.1⁎⁎⁎ (2.7, 3.5) | 14.0⁎⁎⁎ (10.5, 17.5) | 0.2 (−0.8, 1.1) | |
| Alcohol, SD | 1.9 (−0.5, 4.3) | 1.3 (−0.1, 2.7) | 0.0 (−0.3, 0.4) | 0.2 (−1.0, 1.5) | 0.7⁎⁎ (0.2, 1.3) | |
| DASH, SD | 0.7 (−0.3, 1.7) | 0.3 (−0.5, 1.1) | 0.1 (−0.1, 0.3) | −1.5 (−3.0, 0.1) | −0.2 (−1.0, 0.6) | |
| LTPA, SD | −0.0 (−1.0, 1.0) | 0.2 (−0.4, 0.9) | −0.1 (−0.3, 0.1) | −0.8 (−1.9, 0.2) | 0.2 (−0.1, 0.5) | |
| Smoking status | ||||||
| Nonsmoker | Ref. | Ref. | Ref. | Ref. | Ref. | |
| Smoker | −1.5 (−6.6, 3.6) | −0.6 (−4.3, 3.0) | −0.5 (−1.3, 0.4) | −3.9 (−10.6, 2.8) | 1.4 (−0.5, 3.3) | |
| Trucal fat, SD | 2.0** (0.7, 3.3) | 1.0 (−0.1, 2.0) | 0.7 (−2.0, 3.4) | 2.1*** (1.5, 2.7) | ||
| Glucose, SD | 1.0 (−0.2, 2.2) | 0.7 (−0.1, 1.5) | 0.1 (−0.2, 0.3) | – | −1.5*** (−2.3, −0.7) |
ALT, Alanine transaminase; AST, Aspartate aminotransferase; HSI, Hepatic steatosis index; LTPA, Leisure time physical activity; METs: Metabolic equivalent of task. DASH: Dietary Approaches to Stop Hypertension diet.
Results from the fixed-effects logistic regression models showed increased odds of high HSI when SD consumption changed from the lower to the highest SD consumption category. For example, the odds of NAFLD increased an 39 % (OR = 1.39; 95 % CI: 0.98, 2.39) when changing from the <1 serving/week category to the ≥3.5 servings/week category. The GEE model showed results in the same direction as the fixed-effects analysis. Compared with the <1 serving/week category, the odds of NAFLD 42 % (OR = 1.42; 95 % CI: 1.15, 1.74) was higher for the ≥3.5 servings/week category in both sexes (Fig. 1).
4Discussion
The current prospective study provides evidence that increased SD intake was associated with higher AST and ALT levels in males and an increased HSI score (as a proxy of NAFLD) in both sexes when comparing low versus high consumption of SDs. However, concerning HSI, we noted that the association was more pronounced in men compared to women. This observation aligns with the suggestion made by Goossens et al. that sexual dimorphism in adipose distribution and metabolism of adipose tissue and liver substrates significantly contributes to the sex disparities observed in tissue-specific insulin sensitivity and cardiometabolic health.[39].
The results of this study are comparable with a previous prospective study that was conducted in 2021. Zhang et al., found that the consumption of SDs led to an increased risk of NAFLD of 30 % for males and 46 % for females, in a multipurpose cohort from China [28]. Another prospective study evaluated the consumption of SSBs and liver enzymes. The authors reported an increase in log ALT levels of 0.073 U/L when comparing the highest versus lowest category of SSB consumption, and no effect on AST levels was observed [40]. The increased ALT levels reported in the Shimony et al. study differ from the results of the present study, which found no statistically significant association after adjusting for potential confounders, such as truncal fat. This may be due to the small sample size that was used by Shimony et al., and the lack of diversity in their sample, which only included young premenopausal females.
The results of the present study are consistent with evidence from a meta-analysis that evaluated the association between the consumption of SSBs, including SDs, and the presence of NAFLD[19]. A meta-analysis found a risk of NAFLD of 1.39 (95 % CI: 1.29, 1.50) for both males and females who consumed SSBs. The authors also found that the risk of NAFLD depends on a dose-response effect of SD consumption, and even a low SD consumption increased risk of NAFLD by 14 % (95 % CI: 1.03, 1–26) [19]. However, most of the studies included in this meta-analysis had a cross-sectional or retrospective design; and due to the lack of temporal sequence of these epidemiological studies, it is not possible to establish causality.
There are several biological mechanisms related to the development of NAFLD in which SDs could play a role. In 2021, Tilg et al. proposed that there are multiple "hits" preceding the development of NAFLD like lipotoxicity of adipose tissue (AT), alterations in gut microbial functions, and inflammation of AT, among others[41]. It has been suggested that SD consumption may play a role in the pathological pathway of NAFLD [12]. It has also been observed that fructose can inhibit fatty acid catabolism due to decreased activation of the beta-oxidation pathway in the liver. In addition, the consumption of fructose can promote the decrease of ATP, which leads to hepatic necroinflammation. This could be associated with the elevated ALT levels observed with fructose consumption since an increase in the ALT enzyme not only depends on liver fat accumulation but also on the presence of liver inflammation [42]. Thus, experimental studies in humans suggest that fructose consumption, as compared to glucose, induces higher levels of plasma lipids [43], glucose, lipoproteins, and visceral adiposity, as well as a decrease in insulin sensitivity [23]. However, it's important not to confuse this with the consumption of fructose from fruits, which has been established as safe for the general population [44–47].
Our study has some limitations. First, the outcome measure was determined by using a predictive index for NAFLD, rather than a ultrasonographic fatty liver indicators, in accordance with current hepatological society recommendations and common research practices [48]. The HSI can only be used for the diagnosis of preliminary NAFLD, and cannot distinguish cirrhosis, or HCC. Furthermore, at the time of this study, GGT (considered an indiscriminate liver test, an index of alcohol consumption, and a biomarker of cardiometabolic health) [49] measurements were not available to build other indices, such as the fatty liver index, which have been used in other populations. However, the HSI has a good predictive capacity (AUC = 0.82), as evaluated in other populations. Another limitation is that the study population consisted mainly of a select group of health workers, which may not be representative of the entire Mexican population. More research is required to generalize our results to different regions of Mexico and other populations in the future. Additionally, we observed a significant reduction in the number of male and female participants from the second to the third measurement. This attrition could potentially influence the results of this study and should be considered when interpreting the findings presented here. In addition, the study design is not ideal for evaluating causality, but due to bioethical and safety issues, it is the best way to evaluate SD exposure and the development of NAFLD, therefore residual confusion cannot be ruled out. The recent update of the nomenclature to classify liver diseases, which now includes MASLD, reflects the recognition of the metabolic fundamentals of these conditions. While MASLD considers the presence of one or more metabolic conditions, NAFLD focuses on excluding significant alcohol consumption and secondary causes of hepatic steatosis [11,50]. This evolution in terminology may impact future research and clinical practice. However, due to the specific diagnostic criteria employed in this study, we have opted to maintain the terminology of NAFLD; moreover, it has been suggested that some patients who meet the previous NAFLD definition may not exhibit any MRF. This indicates that these individuals might not be classified under the new MASLD criteria[51]. Future research should consider the influence of these nomenclatural changes on various study designs, as well as on the clinical management of patients with these diseases.
Our research study has some important strengths. The main strength of this analysis is the use of a cohort study with measurements at three moments in time [30]. Second, our statistical analysis has a robust design that allows us to evaluate the associations for each subset of variables and determine relationships between the variables of different groups. Third, the questionnaire that was used to measure risk factors and exposures was previously validated [34]. In conclusion, the present study found that medium and high consumption of SD increases AST and ALT in males and increases the risk of NAFLD, as evaluated by the HIS in males and females. The findings of this study may help contribute to generating recommendations at the public health level for limiting the consumption of SD.
5ConclusionsThe present study found that medium and high SD consumption increases the risk of NAFLD, as evaluated by the HSI in both male and females subjetcs. The findings of this study could contribute to growing body of evidence supporting public health recommendations to limit SD consumption. Based on this evidence, it is recommended to reduce the consumption of SD due to their high fructose content, which is implicated in the pathogenesis of NAFLD.
Author contributionsConceptualization, ED-G, BR-P, and JS; methodology, ED-G, and BR-P; formal analysis, ED-G, BR-P, PM-A, and ADQ-S; resources, RV-C, JS, ED-G and YNF; data curation, ED-G, BA-G, and JS; writing original draft preparation, ED-G, BR-P, BA-G; writing review and editing, ED-G, BR-P, ADQ-S, BA-G, YNF, PM-A, RV-C, and JS. All authors have read and agreed to the published version of the manuscript.
The Health Workers Cohort Study was supported by Consejo Nacional de Ciencia y Tecnología (Grant numbers: 7876, 87783, 262233, 26267 M, SALUD-2010–01–139796, SALUD-2011–01–161930, and CB-2013–01–221628). YNF was supported by NIH/NCIK07CA197179.


