


Due to the high heterogeneity of HCC, which leads to poor prognostic outcomes for patients, there is a need to develop a novel predictive model for accurate classification of HCC in order to improve patient survival rates.
Materials and methodsThe data of the HCV, cirrhosis, and HCC were obtained from TCGA and GEO databases. Multivariable Cox regression analysis and survival analysis was conducted to assess the prognostic relevance of these differentially expressed genes. Single-cell sequencing was used to explore the intercellular interaction patterns and identify relevant signaling pathways. Drug sensitivity analysis was conducted to determine personalized treatment strategies for patients.
ResultsIn this study, we conducted integrated analysis of hepatitis, cirrhosis, and hepatocellular carcinoma datasets and identified 10 liver disease progression genes associated with prognosis. These genes exhibited significant downregulation in expression as the disease advanced, suggesting their crucial involvement in HCC development. By performing multivariable Cox analysis, we established a prognostic model for liver disease progression to predict the prognosis of HCC patients. The model was validated using ROC analysis, demonstrating good accuracy and stability in prognostic evaluation. Single-cell sequencing analysis revealed that these genes primarily exert their effects through the MIF signaling pathway during HCC progression. Furthermore, we observed that patients in the low-risk group exhibited higher sensitivity to TACE treatment, while patients in the high-risk group showed better response to sorafenib treatment.
ConclusionsIn summary, we have elucidated the key genes involved in the progression of liver diseases and established a precise prognostic model for assessing the prognosis of HCC patients. Our study provides novel insights and strategies for the treatment of HCC.
Hepatocellular carcinoma (HCC) is a globally prevalent malignancy whose incidence is climbing annually in several Western countries, severely impacting human health and lifespan [1-3]. Ongoing research identifies the principal risk factors for the development of HCC as viral infections, excessive alcohol consumption, non-alcoholic fatty liver disease, and metabolic liver disorders [4-6]. A multitude of treatment strategies for HCC have been developed, including radiofrequency ablation (RFA), surgical resection, liver transplantation, immunotherapy, and combined therapies [7-9]. However, due to the extensive heterogeneity of HCC, identifying suitable treatment approaches remains a challenging endeavor. Consequently, there is an urgent need to construct a model to predict the prognosis of HCC patients and the potential responses to various types of treatments, in order to mitigate the impact of HCC heterogeneity on therapeutic outcomes.
The liver undergoes inflammation and progresses to cirrhosis after infection with hepatitis C virus (HCV), ultimately leading to HCC, which is the primary driver of HCC occurrence and development [10]. Depending on the natural course of chronic hepatitis C, at least 30% will develop liver fibrosis, 7-18% will develop cirrhosis, and 1-5% will develop HCC within 20-30 years [11]. The hepatitis-cirrhosis-hepatocellular carcinoma sequence suggests whether any gene plays a role in this process, which we define as "driver genes" (DGs).
New insights into the epigenetic control of chronic liver disease, genomic signature, are now emerging. Our recent advances in the critical role of DNA methylation, histone modifications, gene mutations, and genomic copy number variants synergistically affecting gene expression can now be used to improve the management of fibrosis/cirrhosis and cancer [12,13]. DNA methylation changes before HCC are thought to be a driver of the disease, characterized by genome-wide hypomethylation and motif-specific hypermethylation [14]. ANGPTL4 gene copy number downregulated its mRNA expression and promoted tumor progression and metastasis [15]. Therefore, an in-depth exploration of the driver genes and their expression dysregulation mechanisms is an important basis for understanding hepatocarcinogenesis and development.
Several metrics have been created to ascertain patient prognosis. One such metric is the FIB-4 index, which is calculated using the patient's age, levels of AST/ALT, and platelet count. This index has been incorporated into various guidelines to predict the prognosis of individuals with chronic liver disease [16]. Additionally, markers such as free DNA methylation [17], circulating microRNA [18], and transcriptome expression profile [19] have also been employed in prognostic evaluations for patients with cirrhosis and HCC. These indicators play a crucial role in assessing the prognosis and guiding treatment strategies for individuals with these conditions.
In our study, we explored driver gene expression as well as genomic features. A new driver gene-based signature was developed to assess cirrhosis/HCC survival. We also analyzed tumor signatures, gene mutation profiles, and immunotherapy predictive power in different risk groups of HCC patients. Our predictive model informs the prognosis of HCC patients and provides personalized treatment options.
2Materials and methods2.1Data acquisitionRNA sequencing (RNA-seq) data and clinicopathologic information for ESCC were obtained from public databases such as the Cancer Genome Atlas (TCGA) and Gene Expression Omnibus. (GEO, https://cancergenome.nih.gov/, https://www.ncbi.nlm.nih.gov/geo/).
2.2DEGs identification and functional enrichment analysisThe limma package in R software was used to examine differential gene expression. We defined the threshold gene differential expression screening condition as "Adjusted P < 0.05 and log2 (FC) > 2 or log2 (FC) < −2". The PCA plot was generated using the ggord package in R, and the heat map was generated using the pheatmap package in R.
2.3Gene set enrichment analysis (GSEA)GSEA V.4.2.1 is a freely available software tool that evaluates genetic similarities related to common biological features, such as function, chromosomal location, or regulation. It analyzes the enrichment score (ES), significance levels, corrects for multiple hypothesis testing, and computes an FDR q value to determine the distribution of gene sets in phenotypic differences based on gene expression patterns. In our study, we employed GSEA to identify enriched KEGG and GO pathways within samples of HCV, cirrhosis, and HCC. Gene sets with familywise error rate (FWER) P values below 0.05 were considered statistically significant.
2.4Survival analysesSurvival analyses were performed utilizing the survival R package. To assess the OS differences between two groups, a stratified log-rank test was utilized, and HRs were estimated utilizing a stratified Cox proportional hazards model with the identical stratification factors utilized during randomization. The Kaplan-Meier method was utilized for OS analyses, and the Brookmeyer-Crowley method was utilized to estimate 95% confidence intervals. Genes with a significance level of P < 0.05 were identified and compared with differentially expressed genes. Subsequently, shared genes were selected for further analysis.
2.5Single-cell analysisWe acquired single-cell RNA sequencing datasets from cancer tissue. We utilized the Seurat pipeline for data reprocessing and to categorize the cell groups. Additionally, SingleR was employed to identify the cell types.
2.6Immune infiltration related analysisThe pivotal bioinformatic tool known as the CIBERSORT deconvolution algorithm was applied to analyze the distribution of 22 human immune cells in cirrhosis and HCC cohorts, evaluating immune infiltration in the microenvironment. The immune cell gene expression matrix was extracted from the CIBERSORT platform (https://cibersortx.stanford.edu) and paired with differentially expressed genes to ascertain the proportions of infiltrating immune cells in the tumor. Various visual representations such as histograms, correlation heatmaps, and violin plots were generated to highlight distinctions between the tumor and normal groups. Moreover, a lollipop diagram was utilized to examine the association between immune cells and target DE-IRGs.
2.7Protein–protein interaction (PPI) network analysisWe performed network analysis on protein-protein interactions (PPI) related to gene expression by utilizing the STRING network analysis tool (version: 11.0). Our input gene set consisted of genes showing significant expression levels, and we examined interaction networks with experimentally validated connections having a combined score above 0.4, which reflects high confidence. Nodes that did not have any connections within the network were eliminated. To visualize the interaction network, we utilized Cytoscape (version: 3.7.1), a software package specialized in displaying biological networks and data integration. For analyzing the topological features of nodes in the PPI network, the CytoNCA plug-in (version: 2.1.6) was used with parameters set to ignore weight.
2.8Drug susceptibility analysisTo explore the different therapeutic responses of medications in patients with HCC, we calculated the drug sensitivity score of medications obtained from Sanger's Cancer Genomics of Drug Sensitivity (GDSC) v2 using the "oncoPredict" R software package.
2.9Statistical analysisThe R software (4.0.5) were used to analyze the data in this study. And P< 0.05 served as statistical significance.
2.10Ethical statementNot applicable.
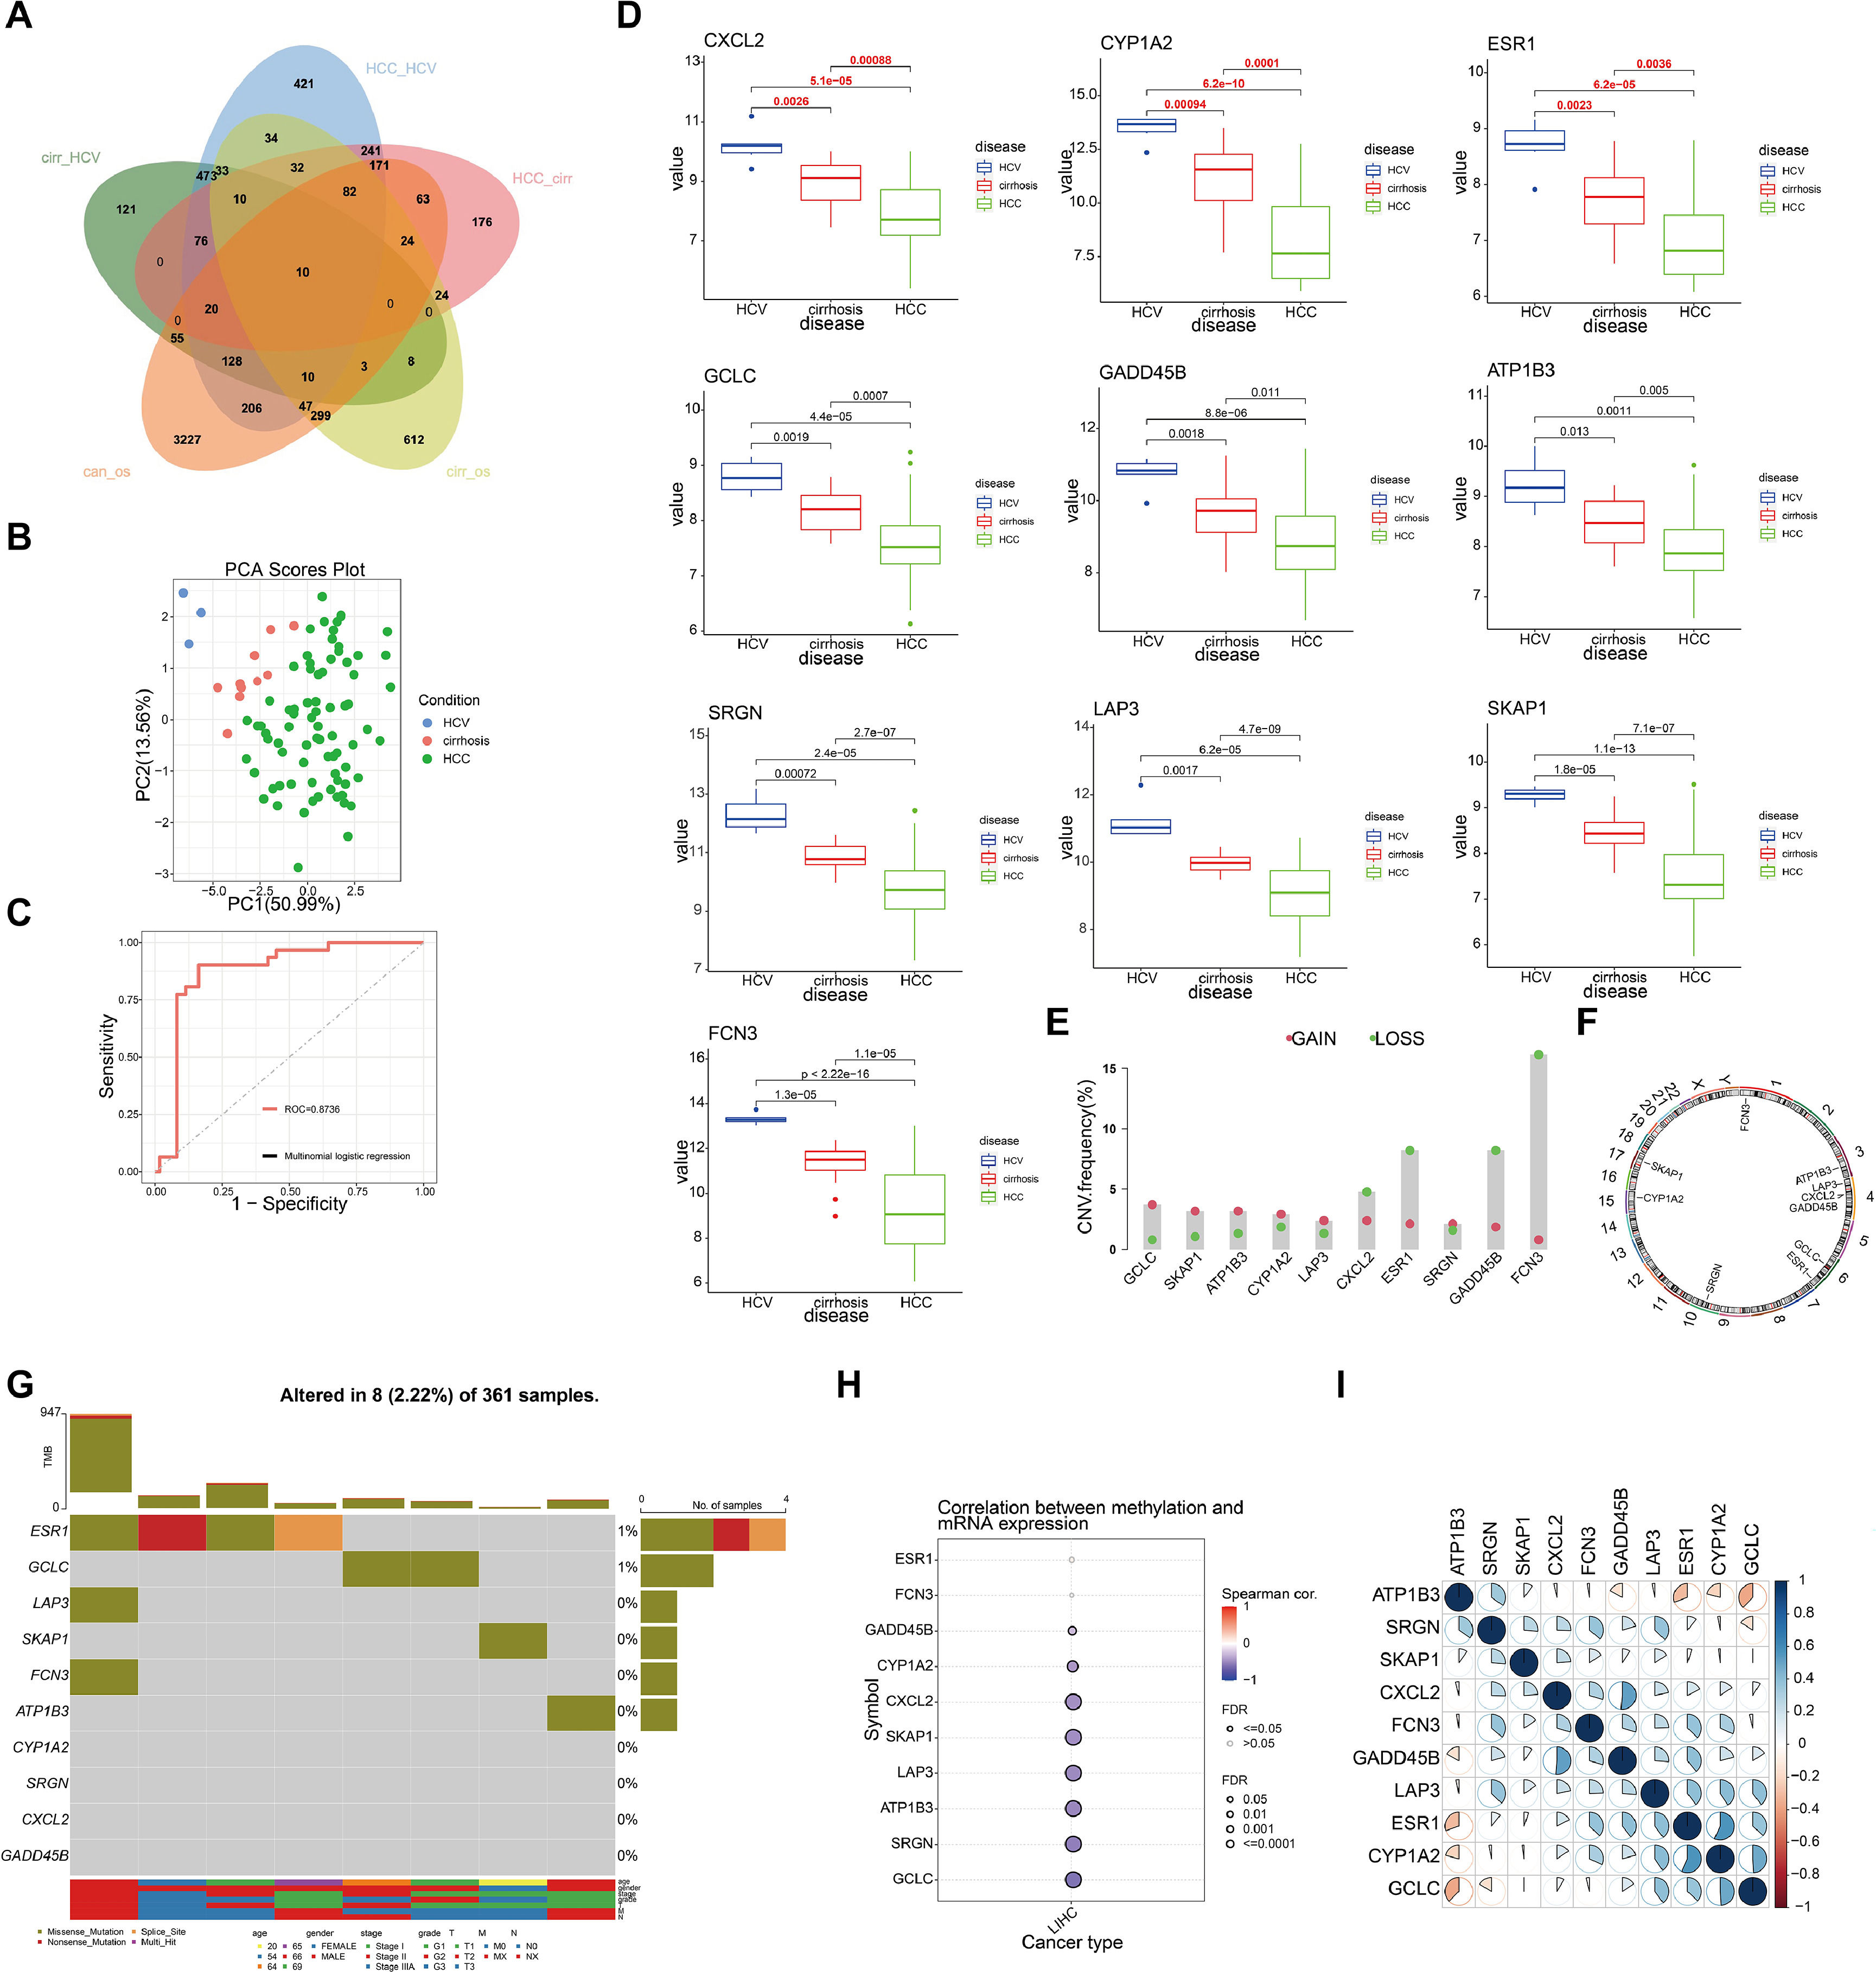
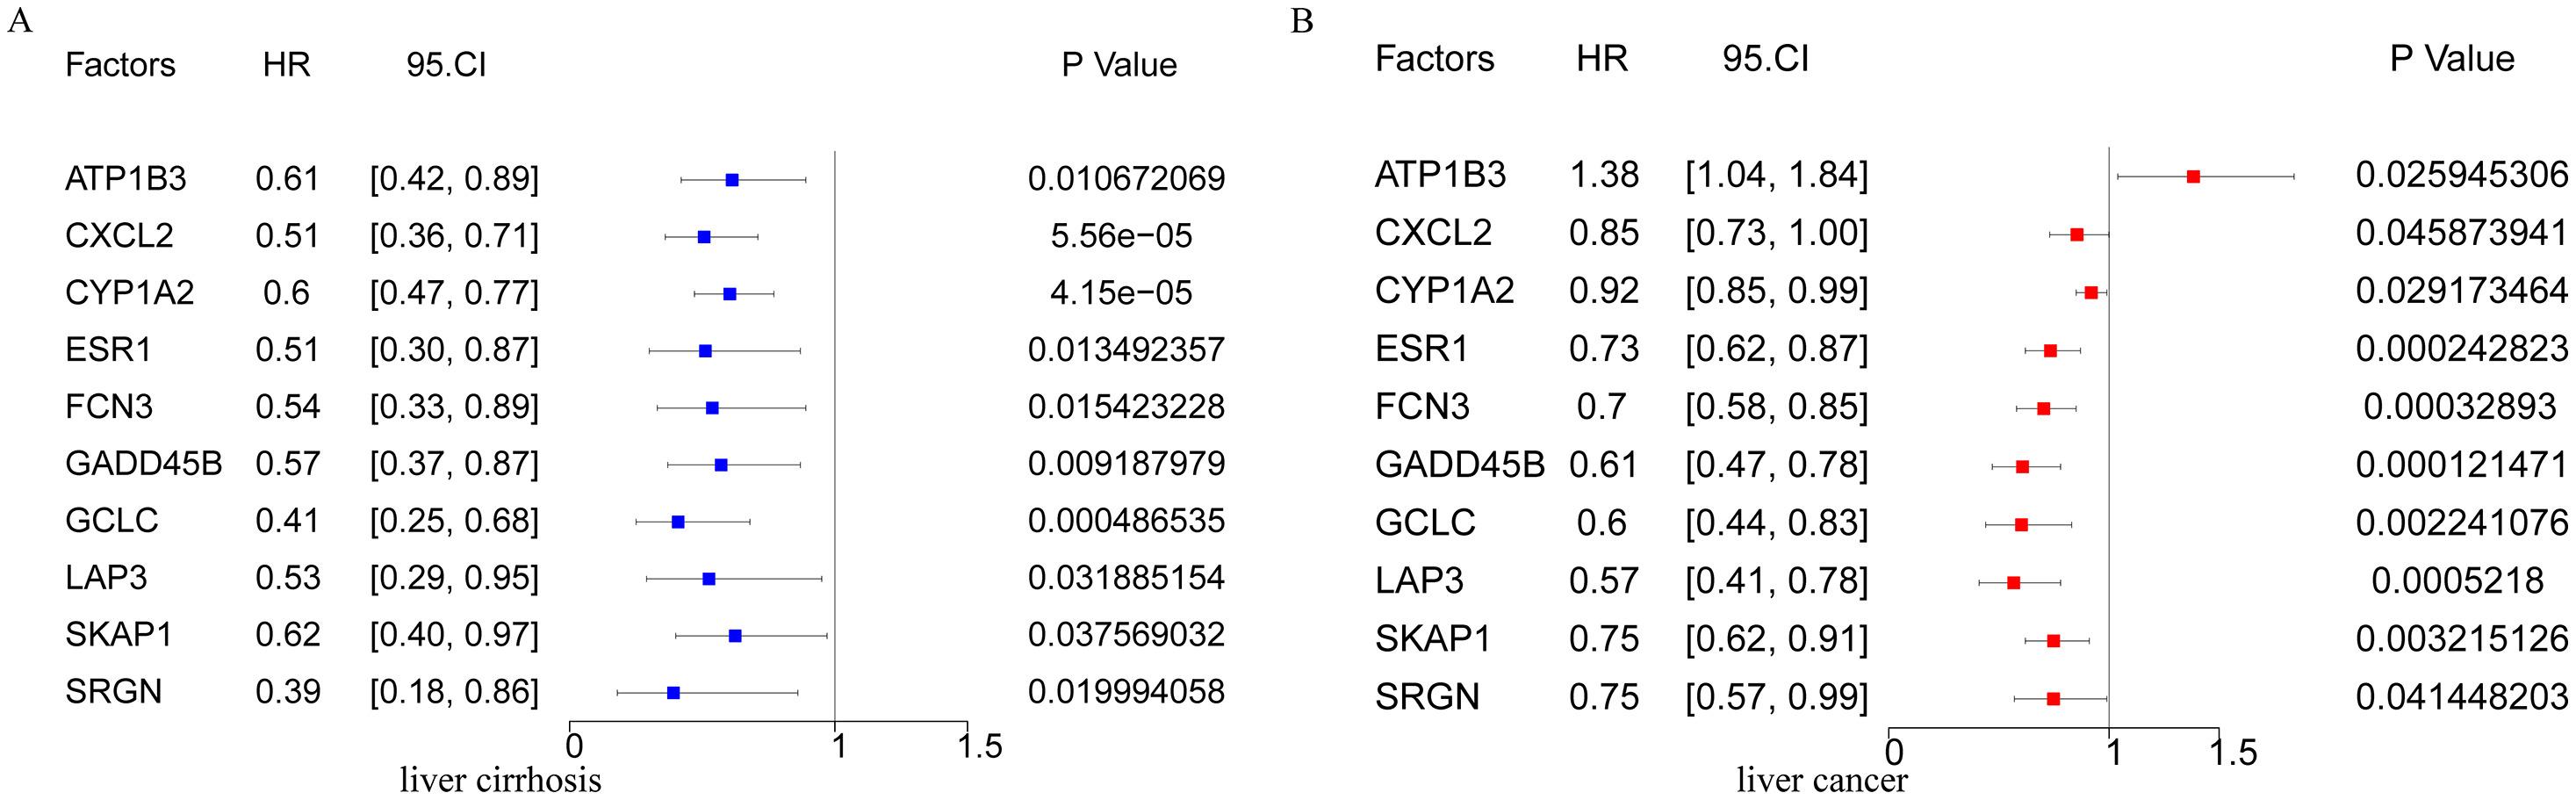
3Results3.1Identification of driver genes and their genomic features in hepatitis-cirrhosis-hepatocellular carcinoma patientsTo identify genes that play a driving role in the hepatitis-cirrhosis-hepatocellular carcinoma triad, differential genes were identified separately between two groups. Immediately afterwards, univariate Cox analysis was performed to obtain prognosis-related genes in patients with cirrhosis and hepatocellular carcinoma (Fig. S1A-B). Finally, these genes were intersected for a total of 10 prognosis-associated differential genes (ESR1, LAP3, SKAP1, FCN3, ATP1B3, GCLC, CYP1A2, SRGN, CXCL2, GADD45B) (Fig. 1A). PCA can provide insights into the structural information of the analyzed data, and our results revealed distinct differences among the three diseases (Fig. 1B). Subsequently, a multiclass logistic regression was performed to validate the 10 DGs, yielding an area under the ROC curve of 0.8736, indicating favorable predictive value of our model genes (Fig. 1C). All these genes exhibit a consistent mRNA expression trend, showing either upregulation or downregulation with disease progression (P<0.05) (Fig. 1D). We attempted to investigate the underlying factors contributing to the mRNA expression changes of these 10 genes during HCC progression. CNV analysis identified prominent deletions in FCN3, ESR1, and GADD45B (Fig. 1E-F). However, mutation analysis showed overall low mutation frequencies in the samples, with some genes lacking mutations altogether (Fig. 1G). Hence, mutations may not be the primary drivers of gene expression alterations. Previous research has emphasized the critical importance of DNA methylation in the regulation of gene expression [20]. Our further investigation explores the connection between mRNA expression and DNA methylation levels, uncovering a notable negative association between DNA methylation levels and mRNA expression across the majority of genes, with the exceptions of ESR1 and FCN3 (Fig. 1H). Finally, we compared the correlation between DGs and did not find a uniform pattern (Fig. 1I). In conclusion, we identified 10 prognosis-related genes involved in liver disease progression, and DNA methylation may be the primary factor contributing to the expression changes of these genes.
 The Venn diagram depicts the intersecting genes among HCV, cirrhosis, HCC, and prognosis-related genes. (B) PCA of the samples from the HCV, cirrhosis, HCC. (C) The multiclass logistic regression model for driver genes. (D) The expression levels of driver genes in three diseases. (E) CNV frequency of driver genes. (F) The genomic loci of driver genes. (G) The waterfall plot illustrates the mutation landscape of driver genes in HCC. (H) The correlation analysis between mRNA expression levels of driver genes and DNA methylation. (I) The heatmap illustrates the correlation among driver genes.")
Identification and selection of genes associated with liver disease progression. (A) The Venn diagram depicts the intersecting genes among HCV, cirrhosis, HCC, and prognosis-related genes. (B) PCA of the samples from the HCV, cirrhosis, HCC. (C) The multiclass logistic regression model for driver genes. (D) The expression levels of driver genes in three diseases. (E) CNV frequency of driver genes. (F) The genomic loci of driver genes. (G) The waterfall plot illustrates the mutation landscape of driver genes in HCC. (H) The correlation analysis between mRNA expression levels of driver genes and DNA methylation. (I) The heatmap illustrates the correlation among driver genes.
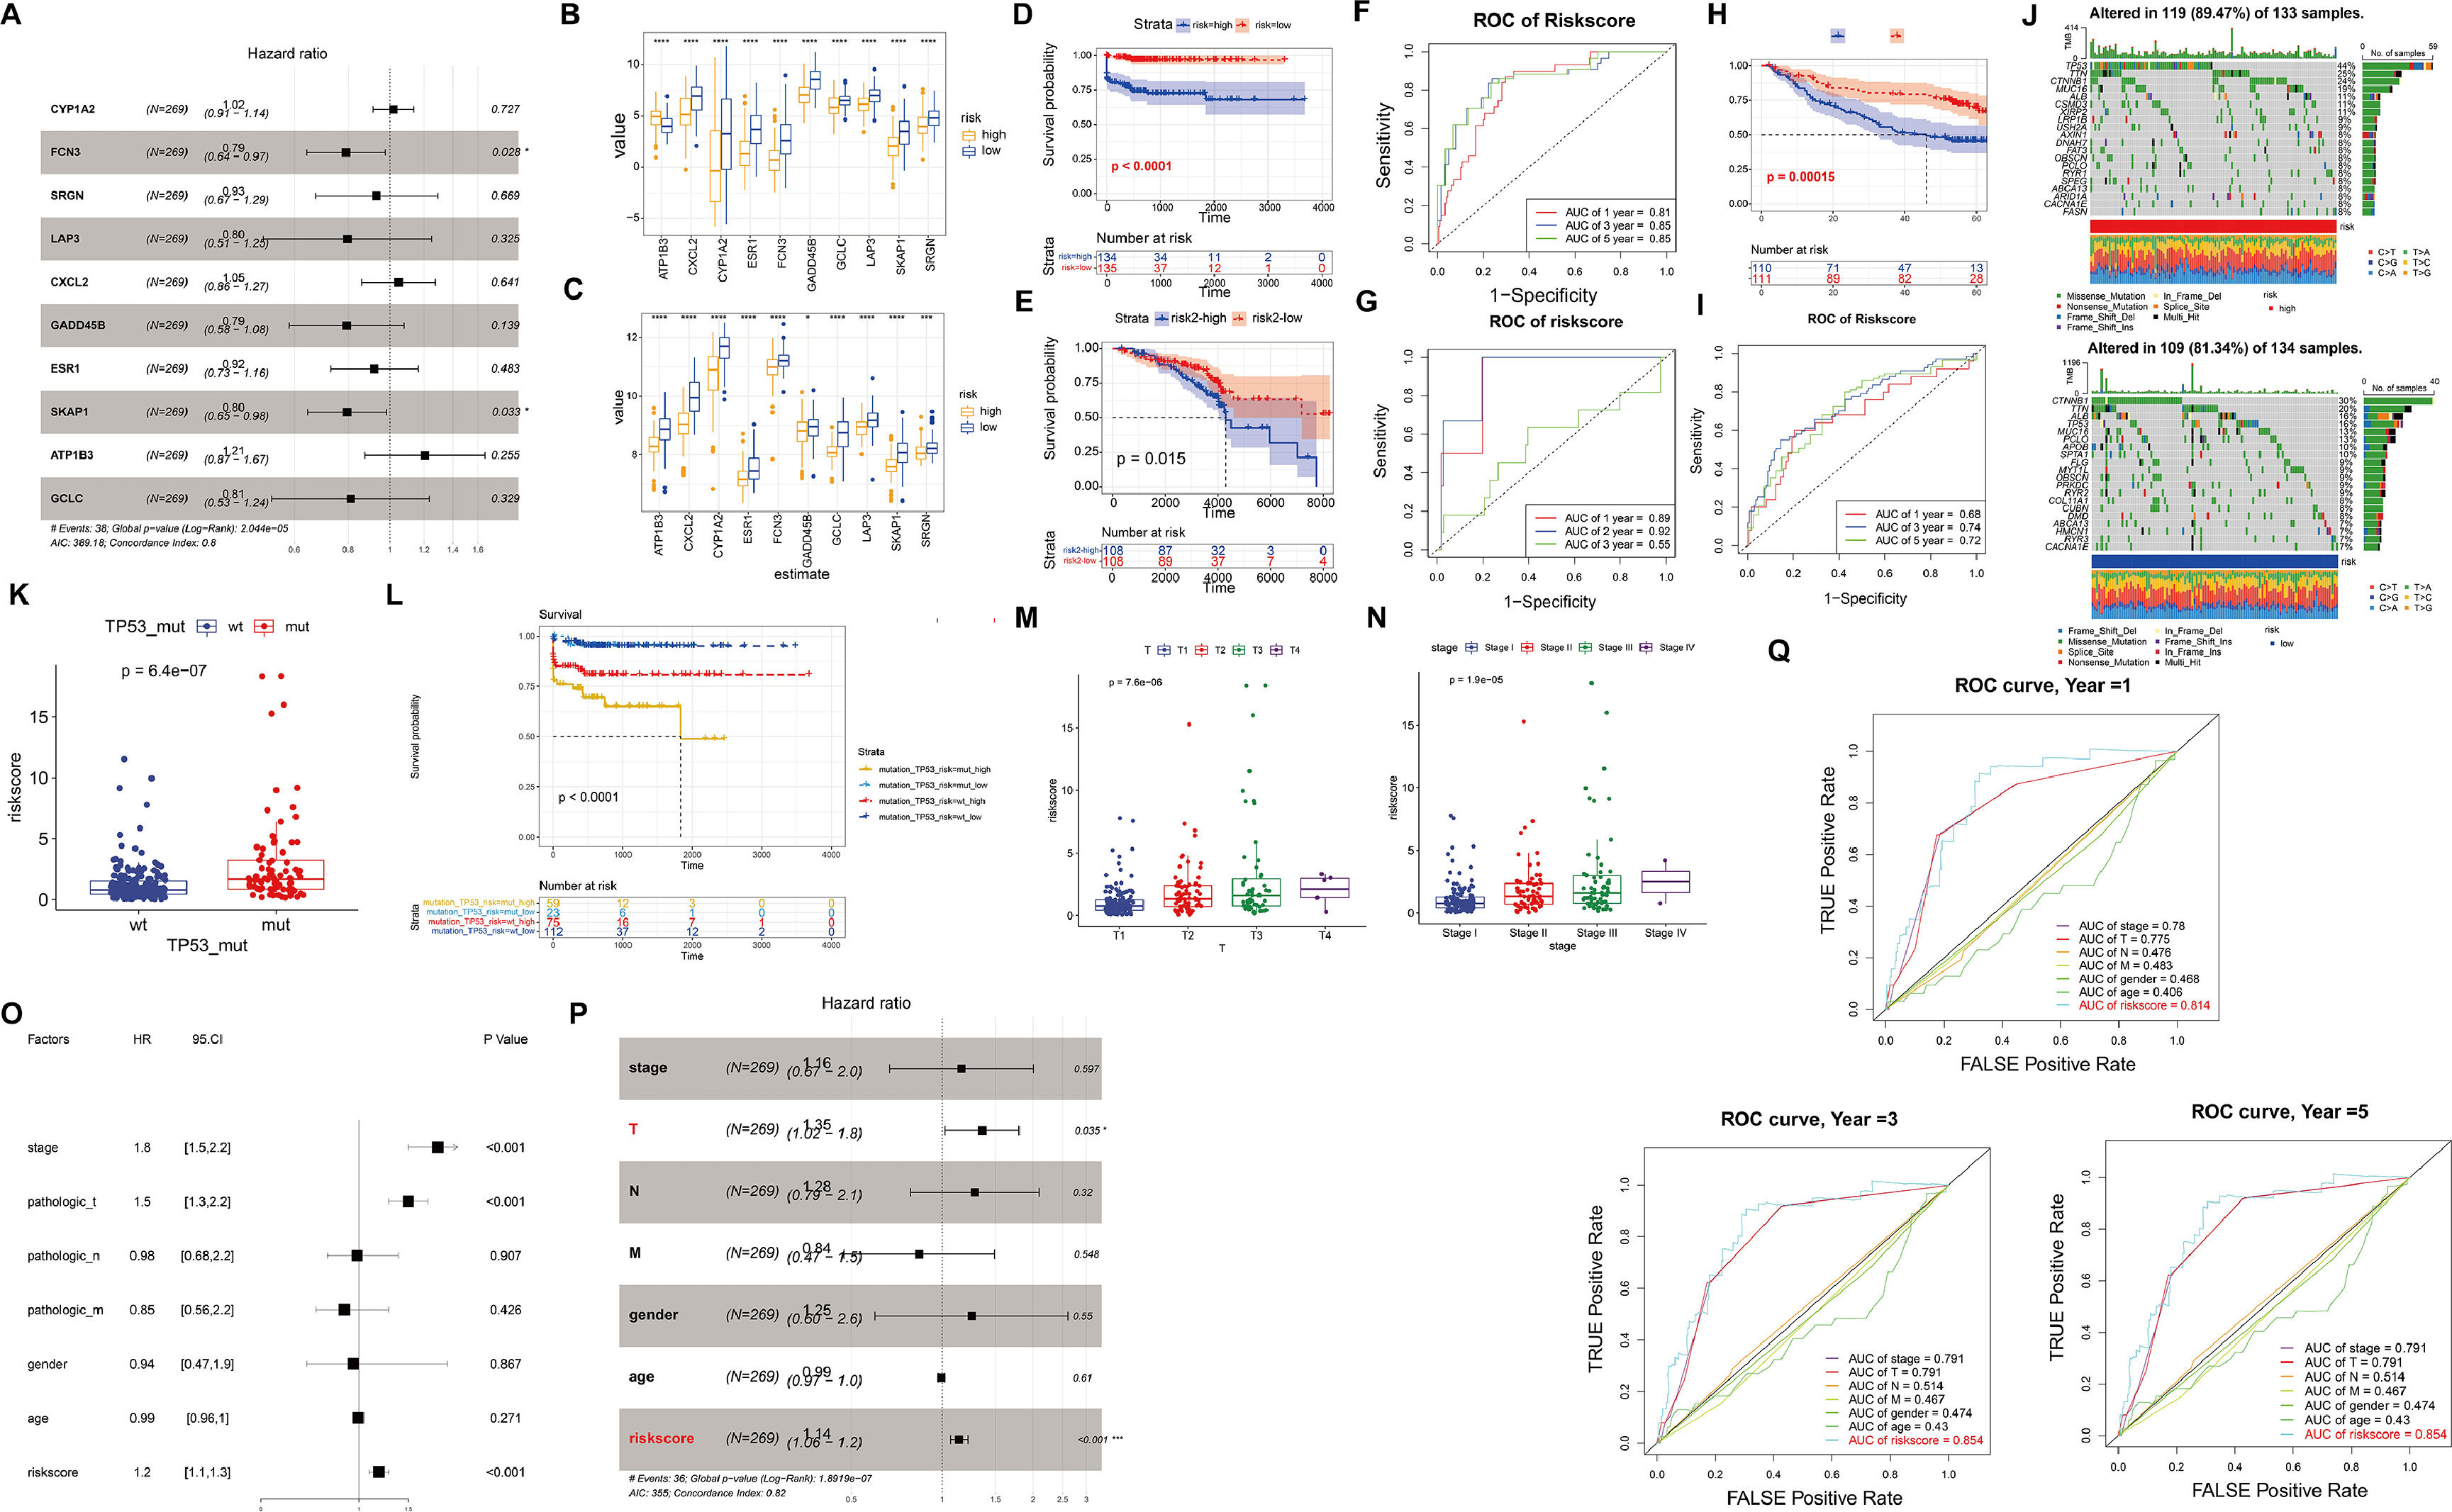
In order to establish a prognostic gene signature (DRS) associated with driver genes, we utilized LASSO and multivariable Cox regression analysis. Following this, the samples were divided into high-risk and low-risk groups based on the median risk score (Fig. 2A). Upon comparison of the gene expression patterns in the high-risk and low-risk groups across various diseases, it was observed that the model genes showed increased expression in the low-risk group. Particularly, in the high-risk group of HCC, the expression of ATP183 was notably higher compared to the low-risk group (Fig. 2B-C). Moreover, a correlation was identified between higher risk levels and a less favorable survival outlook for the patients (Fig. 2D-E). We then evaluated the predictive capability of our model genes using time-dependent ROC analysis. The results revealed that in TCGA-HCC, the prognostic accuracy related to the model genes was as follows: 1-year AUC=0.81, 3-year AUC=0.85, and 5-year AUC=0.85, while in TCGA-CC, the corresponding AUC values were 1-year AUC=0.89, 2-year AUC=0.92, and 3-year AUC=0.55 (Fig. 2F-G). Additionally, we utilized the GSE14520 dataset to validate the predictive ability of our model (Fig. 2H-I). These findings underscore the high accuracy of DRS in predicting the prognosis of HCC patients.
 The forest plot presents the prognostic outcomes of driver genes in the TCGA dataset. (B-C) Expression levels of each driver gene in the high and low-risk models of HCC (B) and cirrhosis (C). (D-E) Kaplan-Meier curves in the high and low-risk models of HCC (D) and cirrhosis (E). (F-G) ROC curves of HCC and cirrhosis. (H-I) Kaplan-Meier curves and ROC curves of GSE14520. (J) The waterfall plot illustrates the somatic mutation landscape of the top 20 mutated genes among all the mutated genes in the high-risk group (left) and low-risk group (right). (K) The relationship between wild-type and mutant TP53 and risk scores. (L) Kaplan-Meier curves illustrate the relationship between TP53 mutations, risk scores, and postoperative outcomes. (M-N) The relationship between risk scores and clinical characteristics. (O-P) The forest plot of prognostic outcomes for the training (O) and testing sets (P). (Q) The ROC curves of prognostic outcomes for clinical features and risk scores.")
Validation of the high and low-risk models based on driver genes. (A) The forest plot presents the prognostic outcomes of driver genes in the TCGA dataset. (B-C) Expression levels of each driver gene in the high and low-risk models of HCC (B) and cirrhosis (C). (D-E) Kaplan-Meier curves in the high and low-risk models of HCC (D) and cirrhosis (E). (F-G) ROC curves of HCC and cirrhosis. (H-I) Kaplan-Meier curves and ROC curves of GSE14520. (J) The waterfall plot illustrates the somatic mutation landscape of the top 20 mutated genes among all the mutated genes in the high-risk group (left) and low-risk group (right). (K) The relationship between wild-type and mutant TP53 and risk scores. (L) Kaplan-Meier curves illustrate the relationship between TP53 mutations, risk scores, and postoperative outcomes. (M-N) The relationship between risk scores and clinical characteristics. (O-P) The forest plot of prognostic outcomes for the training (O) and testing sets (P). (Q) The ROC curves of prognostic outcomes for clinical features and risk scores.
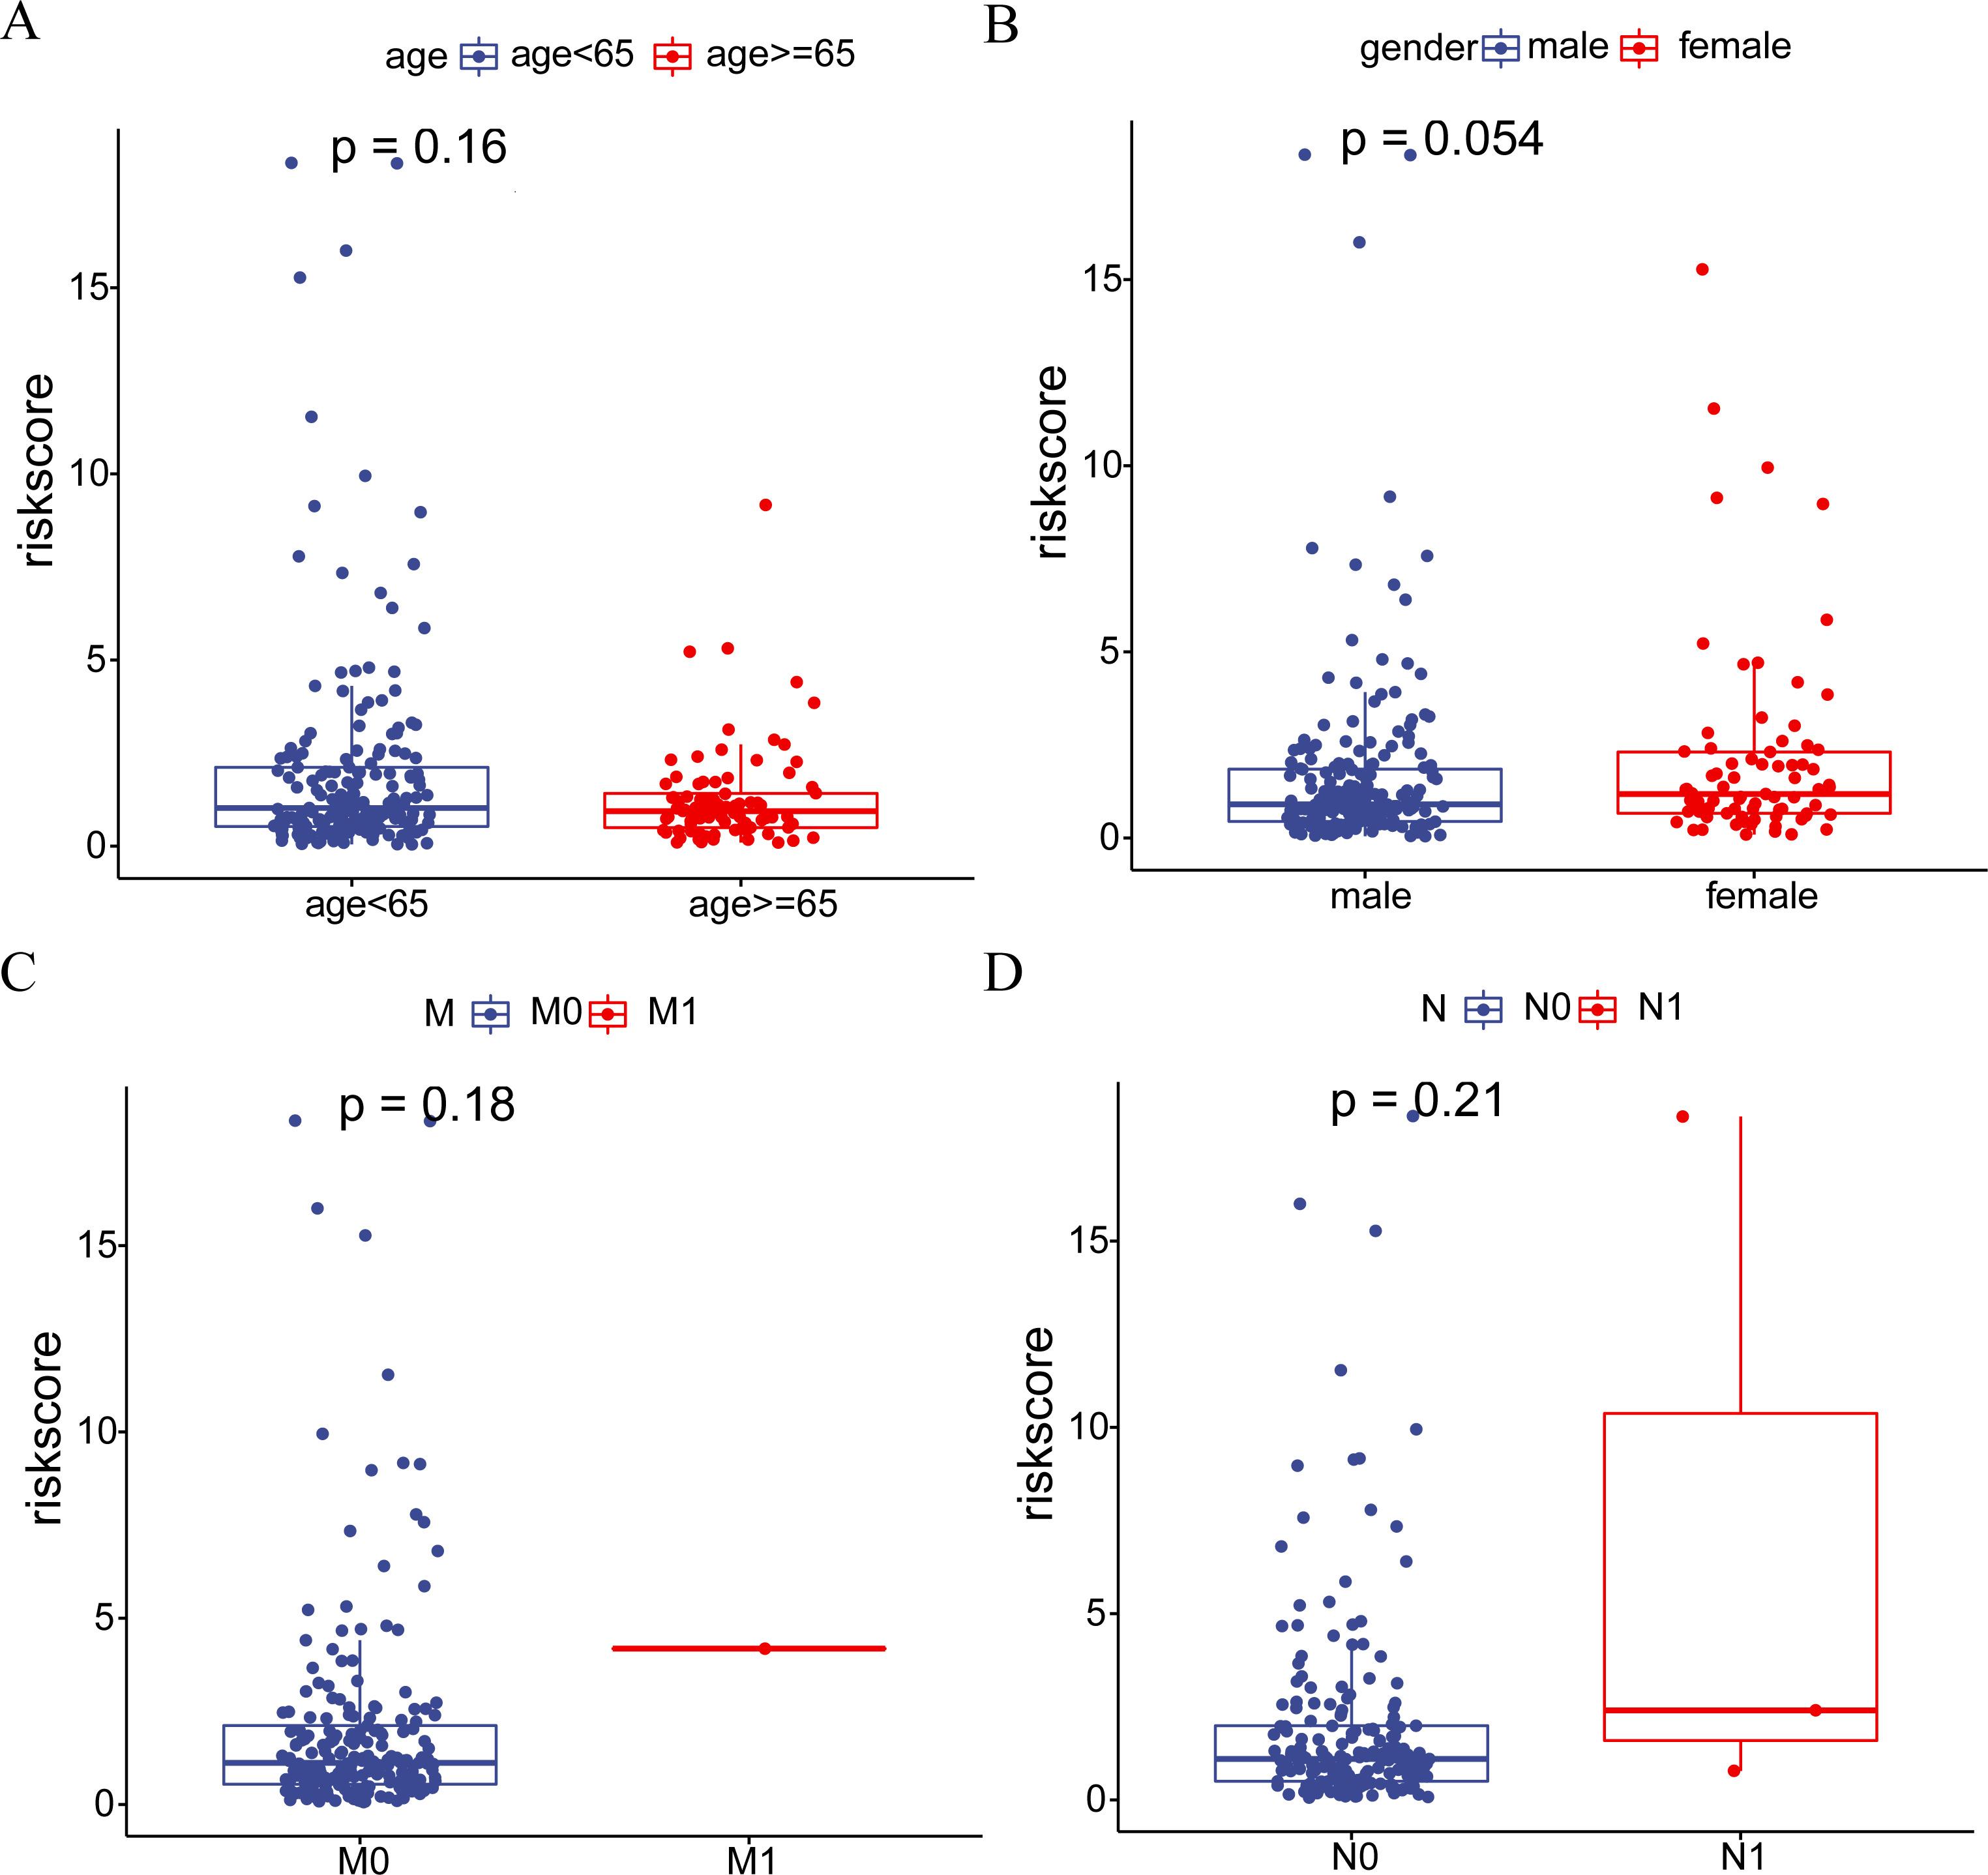
Furthermore, we investigated the heterogeneity between the high-risk and low-risk groups in HCC. The waterfall plot displayed a significantly increased mutation frequency of TP53 in the high-risk group compared to the low-risk group, and mutations were significantly positively correlated with risk scores, indicating that higher mutation frequency was associated with higher risk scores (Fig. 2J-K). Interestingly, we found that samples with TP53 mutations had significantly poorer prognosis (Fig. 2L). We further investigated the relationship between risk score and clinicopathological characteristics of HCC patients. There was no difference in risk score in terms of age, gender and distant metastasis and lymph node infiltration (Fig. S2A-D). However, T-stage as well as clinical stage were aggravated with increasing risk score (P<0.05) (Fig. 2M-N). To assess the potential of the risk score as an independent prognostic indicator of OS, clinicopathological characteristics and risk score were initially included in a univariate Cox regression analysis. The findings indicated that T-stage, clinical stage, and risk score were correlated with OS in HCC patients (P<0.05) (Fig. 2O). The results of the multivariate Cox regression analysis demonstrated that T stage and risk score remained independent prognostic indicators even after adjusting for other variables (P<0.05) (Fig. 2P). In terms of prognostic prediction, the ROC curve indicated that the prognostic accuracy of the risk score surpassed other clinical characteristics, including clinical stage, TMN stage, age, and gender, at 1, 3, or 5 years (Fig. 2Q). Overall, these results indicate that the risk score we developed can serve as a robust prognostic marker for HCC.
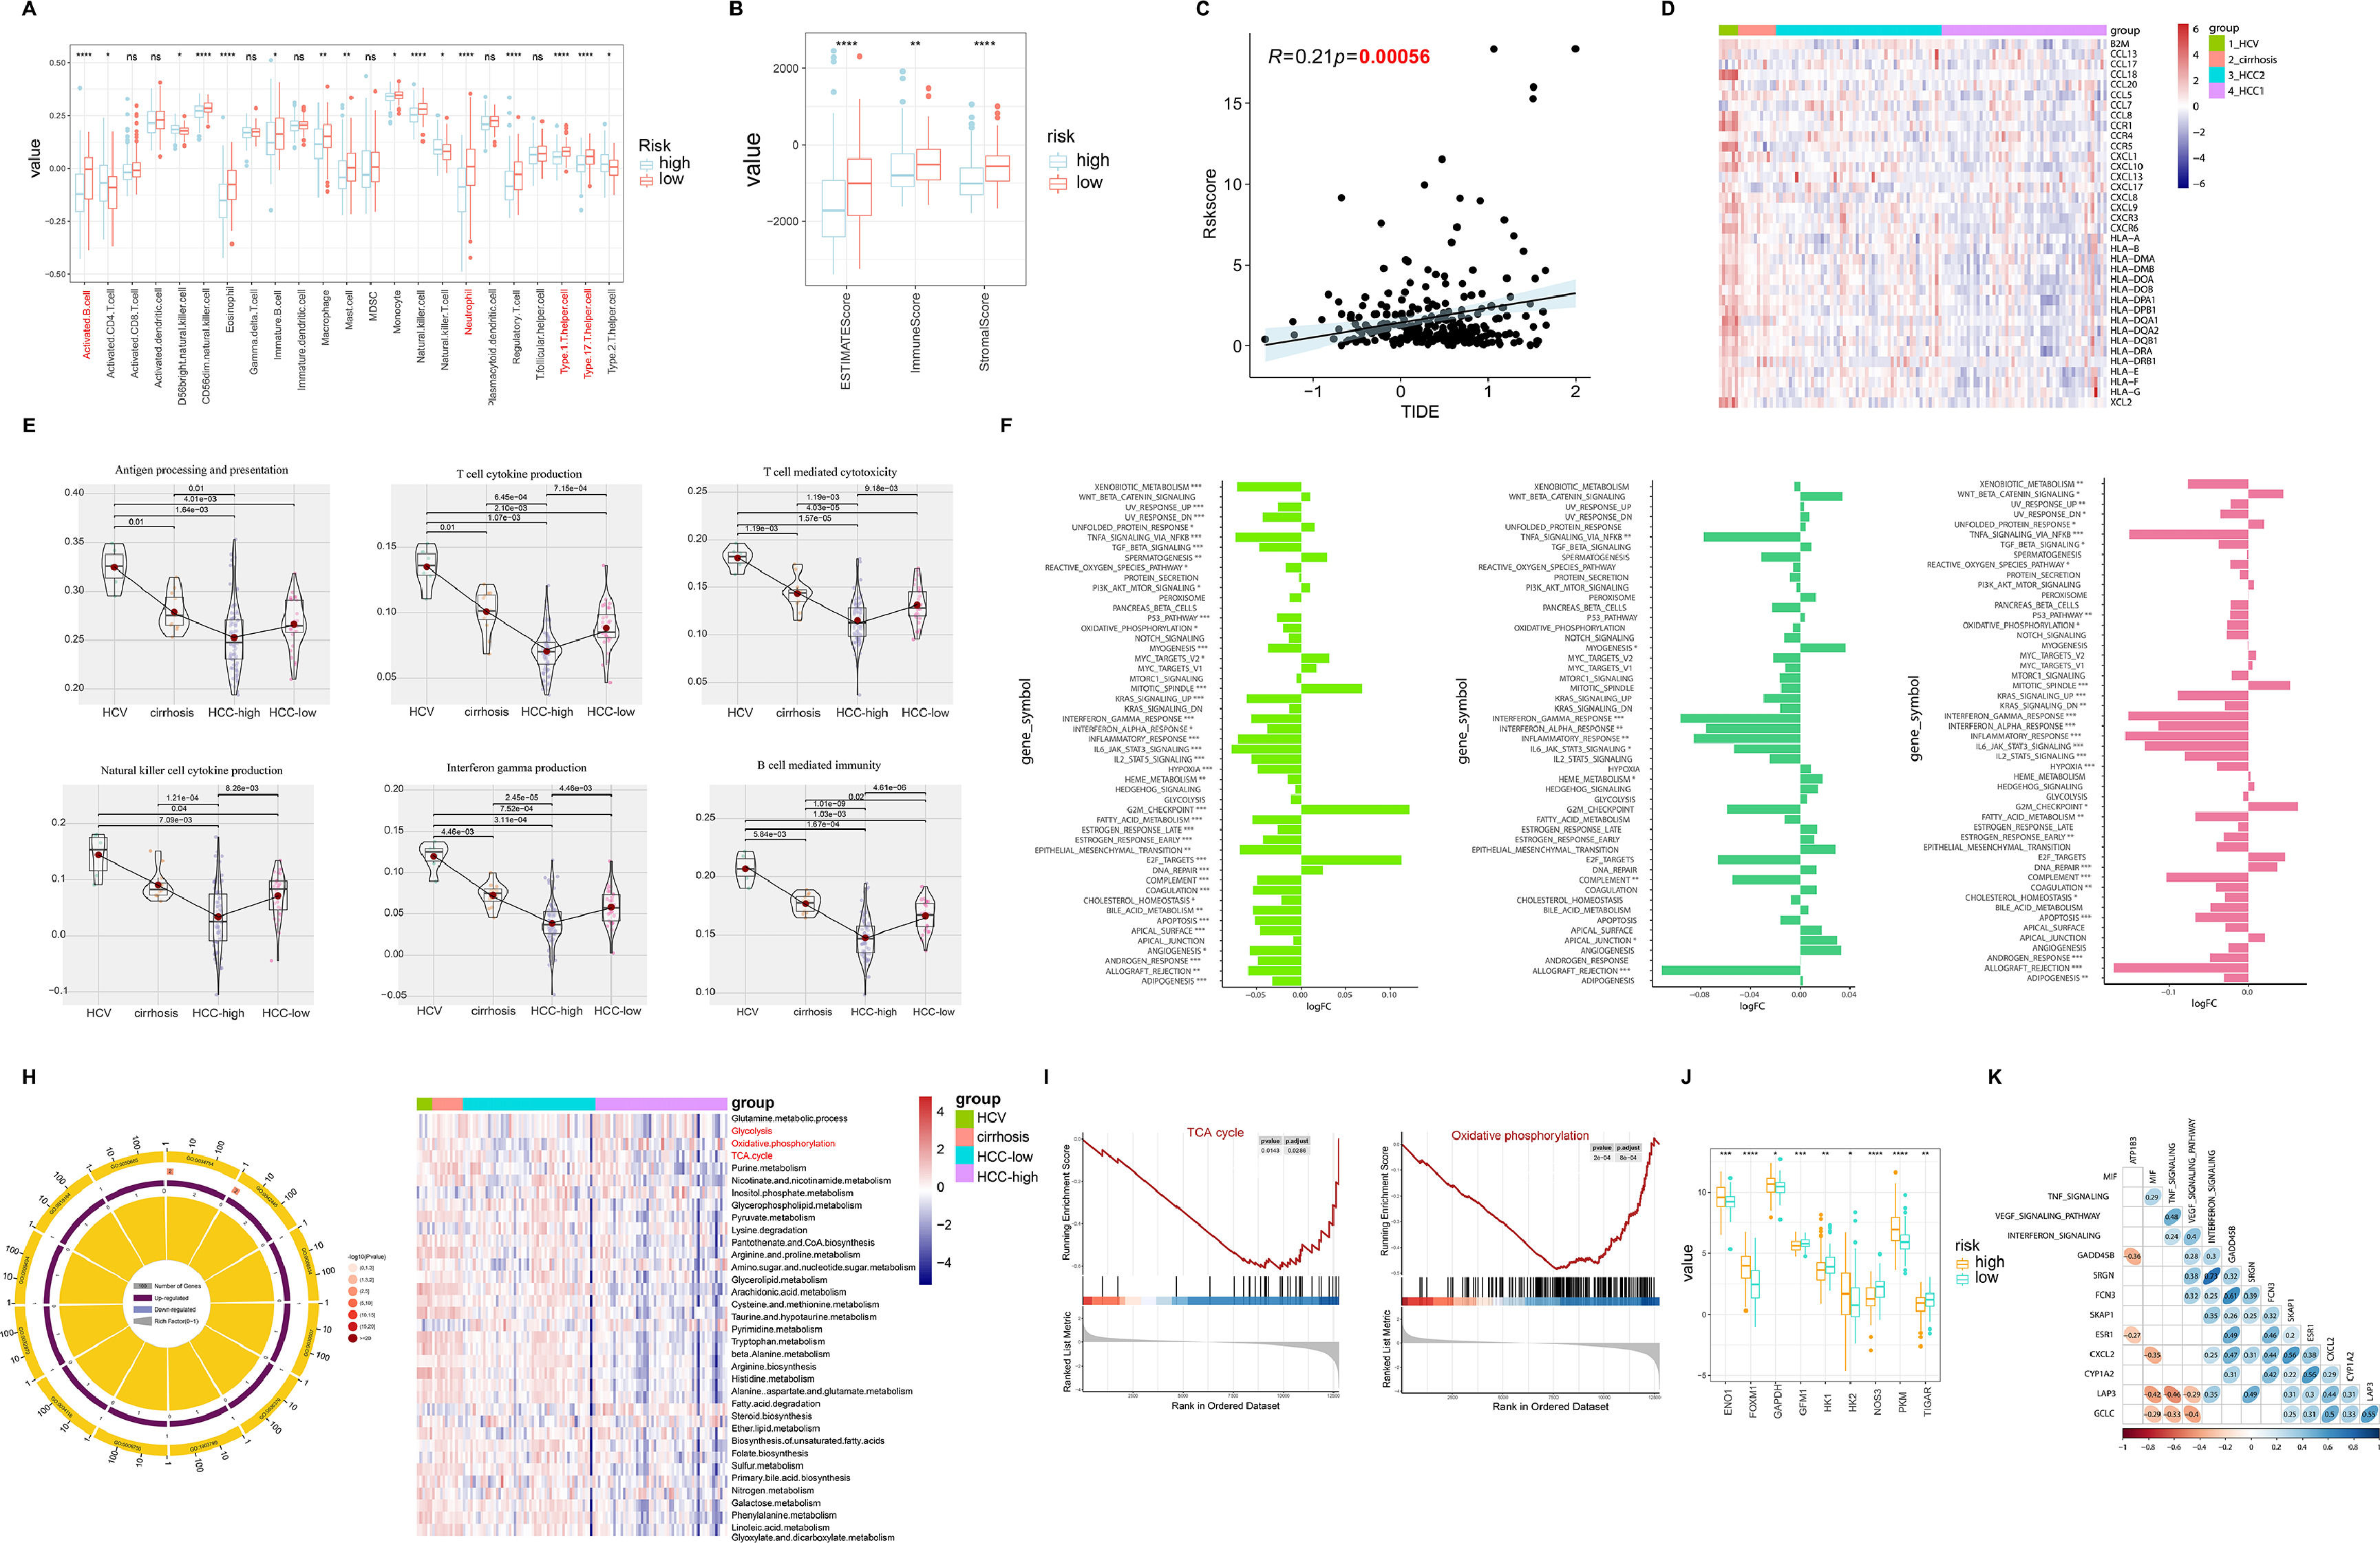
3.3Tumor microenvironment (TME) and molecular characteristics in hepatitis-cirrhosis-hepatocellular carcinoma patientsIn various tumor types, the tumor microenvironment is typically composed of different immune cell populations and exhibits varying levels of infiltration, which holds significant prognostic value for cancer prediction and patient outcomes [21]. In order to investigate the impact of immune cell infiltration on HCC patients, an analysis of immune cell infiltration was carried out in both high-risk and low-risk groups of HCC. The results indicated a marked increase in immune cell infiltration in the low-risk group compared to the high-risk group, with similar patterns seen in the EATMATE score. Notably, the low-risk group specimens also displayed higher stromal cell scores and lower tumor purity (Fig. 3A-B). Tumor Immune Dysfunction and Exclusion (TIDE) has been recognized as a prognostic factor for patient response to immunotherapy, with elevated TIDE scores signaling a higher chance of immune escape and reduced effectiveness of immune checkpoint inhibitors (ICIs) [22]. Our findings unveiled a significant positive association between risk scores and TIDE, implying that patients in the high-risk group may have lower sensitivity to ICIs, aligning with previous research on the prognosis of high-risk versus low-risk groups (Fig. 3C). Regarding the exploration of the correlation between chemokines and different diseases, we observed significant positive correlations between HCV and most chemokines, while the trend was opposite in HCC-high group (Fig. 3D). Furthermore, the expression of immune-related pathways was either upregulated or downregulated with disease progression (Fig. 3E). Further differential analysis of the pathways between hepatitis, liver cirrhosis, and liver cancer revealed significant differences not only in immune-related pathways but also in metabolism-related pathways during the progression of liver diseases, including xenobiotic metabolism, heme metabolism, fatty acid metabolism, and bile acid metabolism (Fig. 3F). Through GO pathway enrichment analysis, we further explored the correlation between metabolism pathway and the three diseases. The results indicated similarities in the correlation between HCV, cirrhosis, and HCC-low with pathways. Conversely, the HCC-high group showed a significant negative correlation with pathways such as TCA cycle, glycolysis, oxidative phosphorylation, which was further validated by GSEA (Fig. 3G-H). Moreover, compared to the low-risk group, the high-risk group samples exhibited significant upregulation of target genes related to metabolism (Fig. 3I). Subsequently, by comparing the correlation between driver genes and immune pathways, we found a positive correlation between FCN3 and MIF, TNF signaling, VEGF signaling pathway, and interferon signaling, while no similar patterns were observed in other model genes (Fig. 3J).
 The correlation between high and low-risk groups in HCC and immune cells. (B) The ESTIMATE Score, immune Score, and stromal Score between high and low-risk groups. (C) The relationship between risk scores and TIDE. (D) Gene expression of human leukocyte antigen (HLA) stimulators among HCV, cirrhosis, and HCC. (E) The relationship between immune pathways and the progression of liver diseases. (F) The relative pathway among HCV, cirrhosis, and HCC. (G) GO enrichment analysis reveals the relationship between liver diseases and pathways. (H) Enrichment plots for TCA cycles and oxidative phosphorylation that were related to HCC. (I) The relationship between metabolism-related genes and high/low risk. (J) The correlation heatmap between immune-related pathways and driver genes.")
Analysis of immune infiltration and pathway correlation in HCC. (A) The correlation between high and low-risk groups in HCC and immune cells. (B) The ESTIMATE Score, immune Score, and stromal Score between high and low-risk groups. (C) The relationship between risk scores and TIDE. (D) Gene expression of human leukocyte antigen (HLA) stimulators among HCV, cirrhosis, and HCC. (E) The relationship between immune pathways and the progression of liver diseases. (F) The relative pathway among HCV, cirrhosis, and HCC. (G) GO enrichment analysis reveals the relationship between liver diseases and pathways. (H) Enrichment plots for TCA cycles and oxidative phosphorylation that were related to HCC. (I) The relationship between metabolism-related genes and high/low risk. (J) The correlation heatmap between immune-related pathways and driver genes.
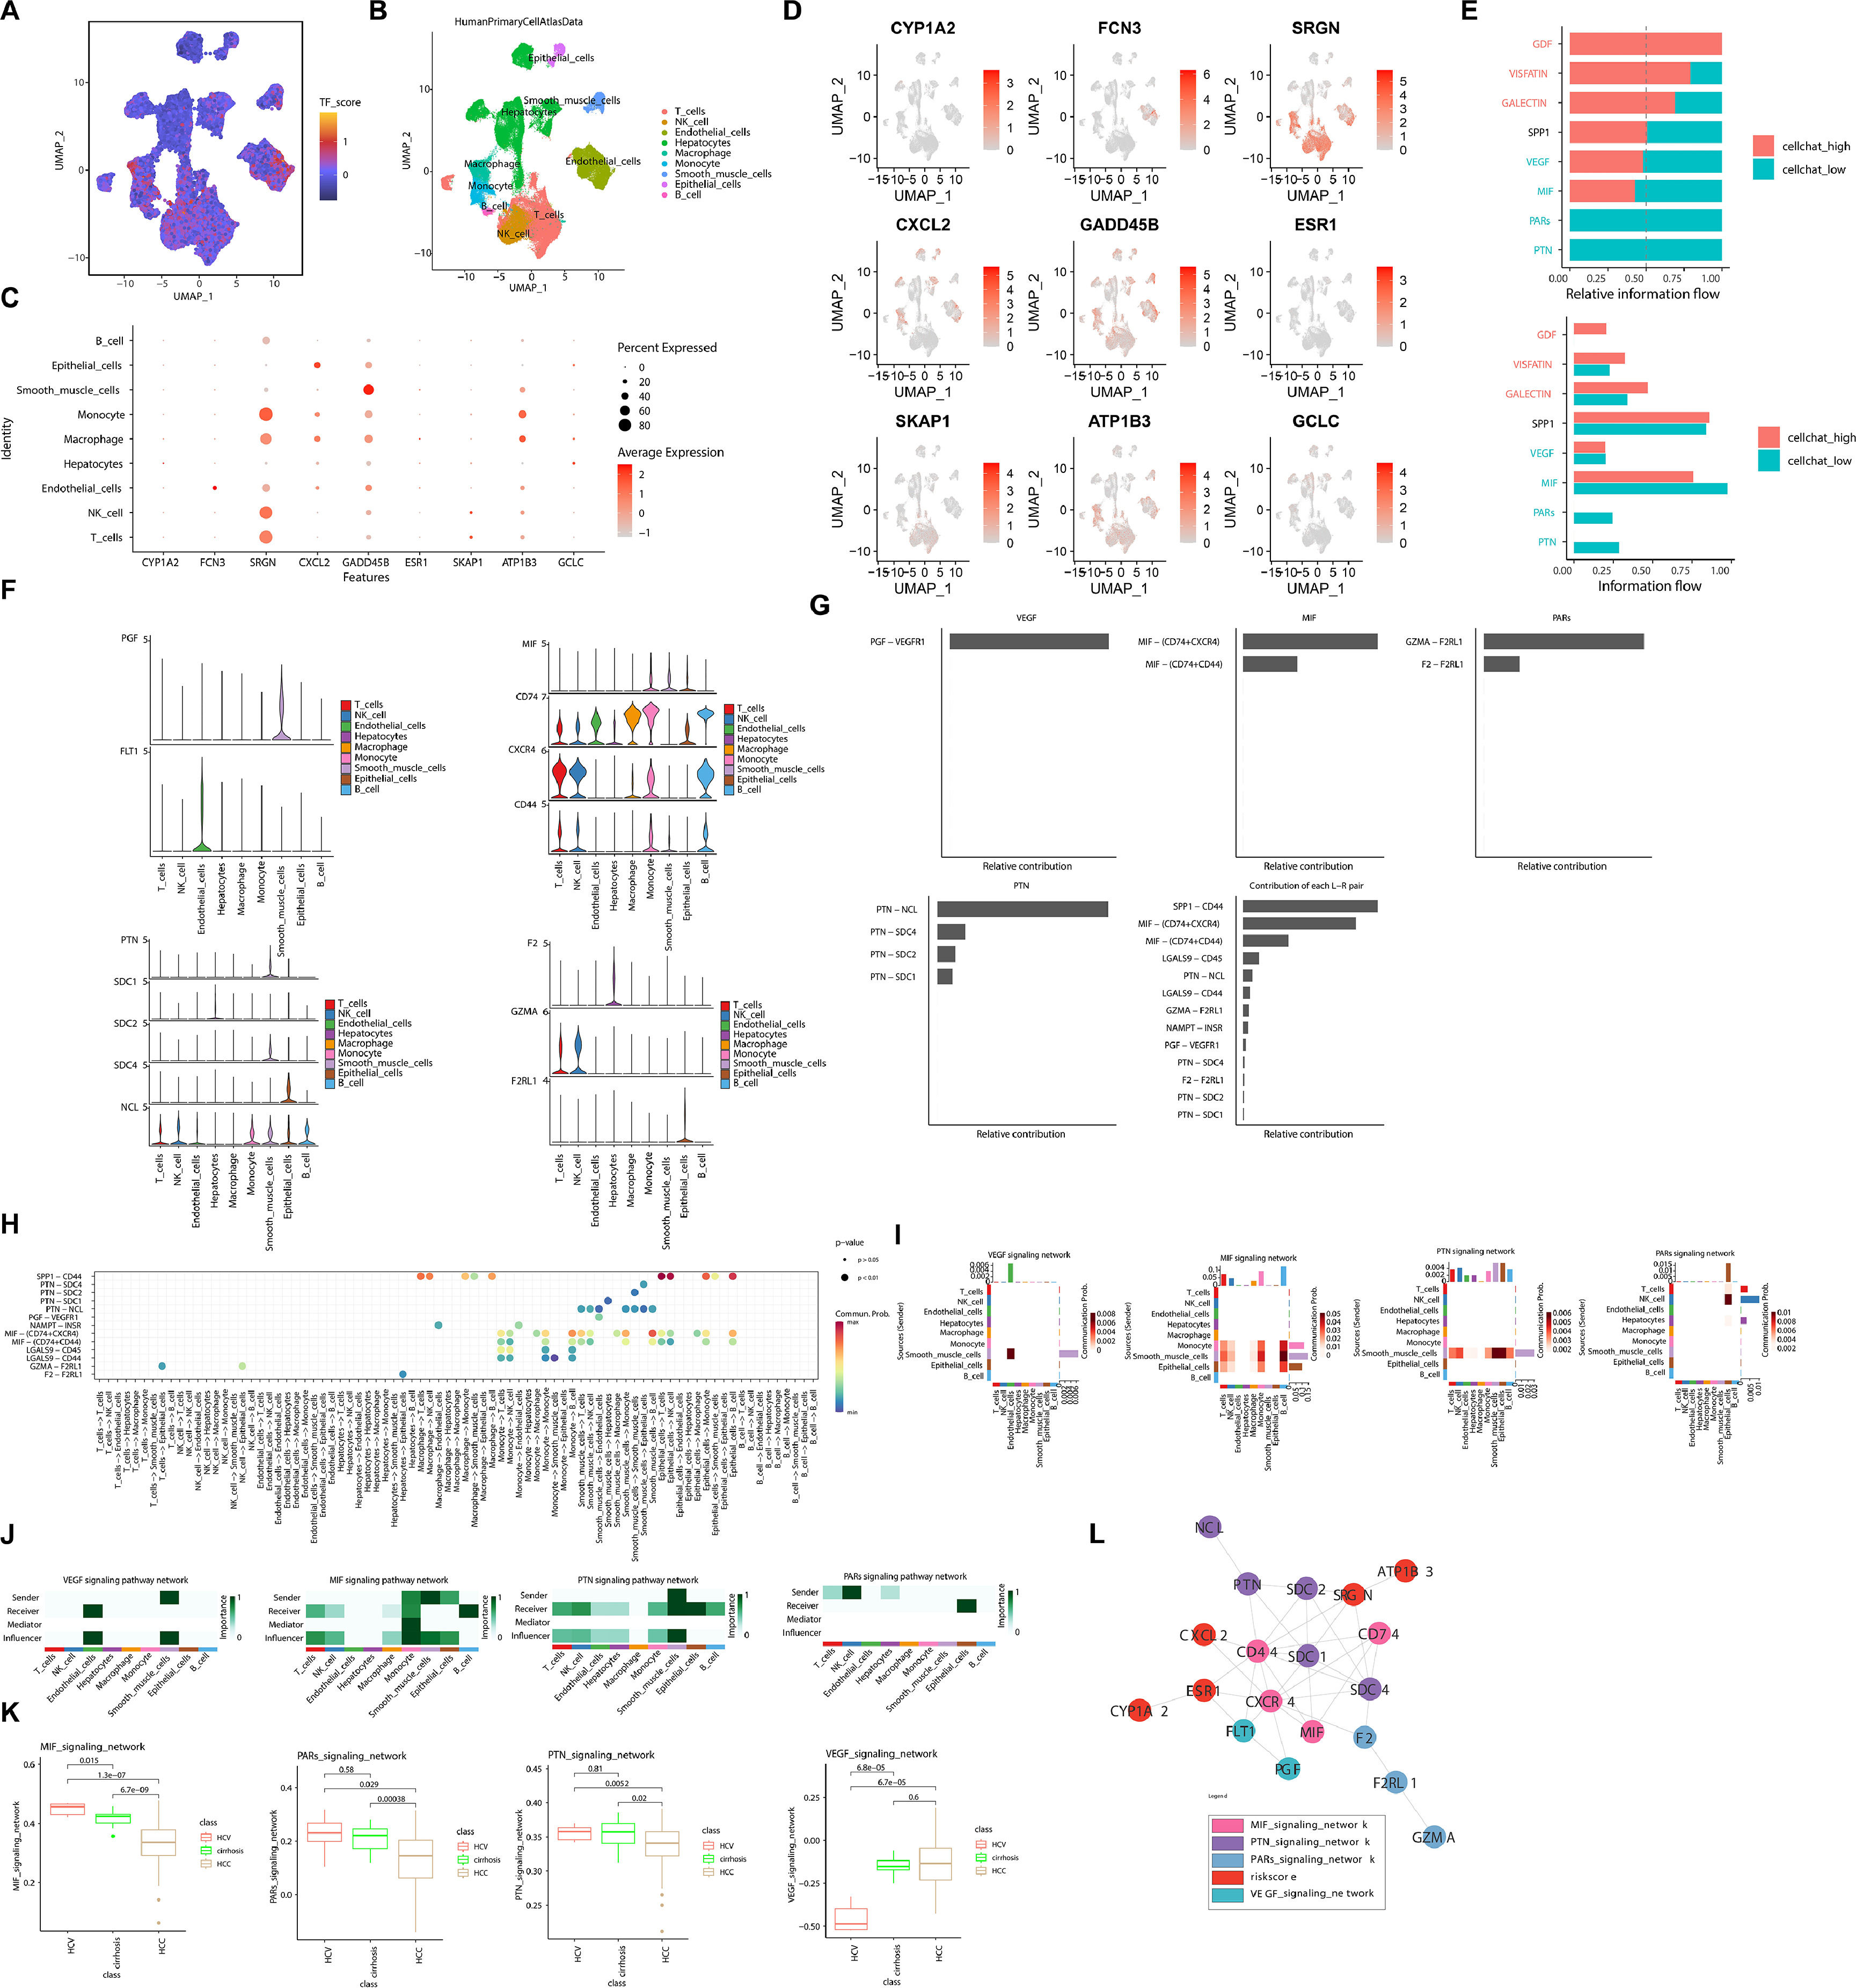
To explore cellular diversity in HCC patients, we obtained single-cell mRNA profiles from TCGA-HCC and performed clustering analysis. Based on the expression of marker genes, we annotated a total of 9 cell types, including T cells, NK cells, endothelial cells, hepatocytes, macrophages, monocytes, smooth muscle cell, epithelial cells, and B cells (Fig. 4A). Next, we analyzed the expression distribution of DGs across various cell types. The results revealed inconsistent expression levels of DGs across different cells, with SRGN showing significant expression in monocytes, macrophages, NK cells, and T cells (Fig. 4B-D). Comparative analysis of the pathways involved in these cell types showed that the cells with lower expression of model genes were predominantly enriched in the VEGF, MIF, PARS, and PIN pathways (Fig. 4E). Further analysis of the expression of pathway-related genes in different cell types revealed relatively higher expression of MIF pathway-related genes in these cell types (Fig. 4F). Additionally, we identified MIF-(CD74+CXCR4) as the most prominent ligand-receptor pair contributing to HCC within these pathways (Fig. 4G). Analyzing the interactions between cells within these pathways, we observed that smooth muscle cells primarily acted as sender, while B cells served as receiver in the MIF pathway (Fig. 4H-J). Similarly, analyzing the differential enrichment of these pathways in the three diseases, we found a continuous decline in the enrichment of the MIF pathway with disease progression (Fig. 4K). Furthermore, the PPI network results demonstrated that the risk factors ATP1B3, SRGN, CXCL2, ESR1, and CYP1A2 interacted through different pathways, thereby playing a role in the progression of HCC (Fig. 4L). Taken together, these results demonstrate the pathways involved by driver genes during the development of HCC, potentially serving as key mechanisms driving HCC progression.
 The t-SNE plot displayed the composition of different cell subtypes in HCC. (B) The dynamics of risk score in 9 main cell types are represented in the t-SNE plot. (C) The expression levels of driver genes in different cell types vary. (D) The distribution of driver gene expression varies across different cell types. (E) Different intensity ratios of signal pathway in high- and low-risk groups in HCC. (F) Expression levels of pathway-associated genes in different cell types. (G) Contribution ratios of intercellular communication pairs in HCC samples. (H) Global view of intercellular communication among different cell types. (I) Heatmap of different cellular pathways. (J) Roles played by different cells in different pathways. (K) Enrichment of pathway genes in HCV, cirrhosis, HCC. (L) PPI network graph of risk model genes and pathway genes.")
Single-cell sequencing analysis revealed the signaling pathways and molecular features associated with driver genes. (A) The t-SNE plot displayed the composition of different cell subtypes in HCC. (B) The dynamics of risk score in 9 main cell types are represented in the t-SNE plot. (C) The expression levels of driver genes in different cell types vary. (D) The distribution of driver gene expression varies across different cell types. (E) Different intensity ratios of signal pathway in high- and low-risk groups in HCC. (F) Expression levels of pathway-associated genes in different cell types. (G) Contribution ratios of intercellular communication pairs in HCC samples. (H) Global view of intercellular communication among different cell types. (I) Heatmap of different cellular pathways. (J) Roles played by different cells in different pathways. (K) Enrichment of pathway genes in HCV, cirrhosis, HCC. (L) PPI network graph of risk model genes and pathway genes.
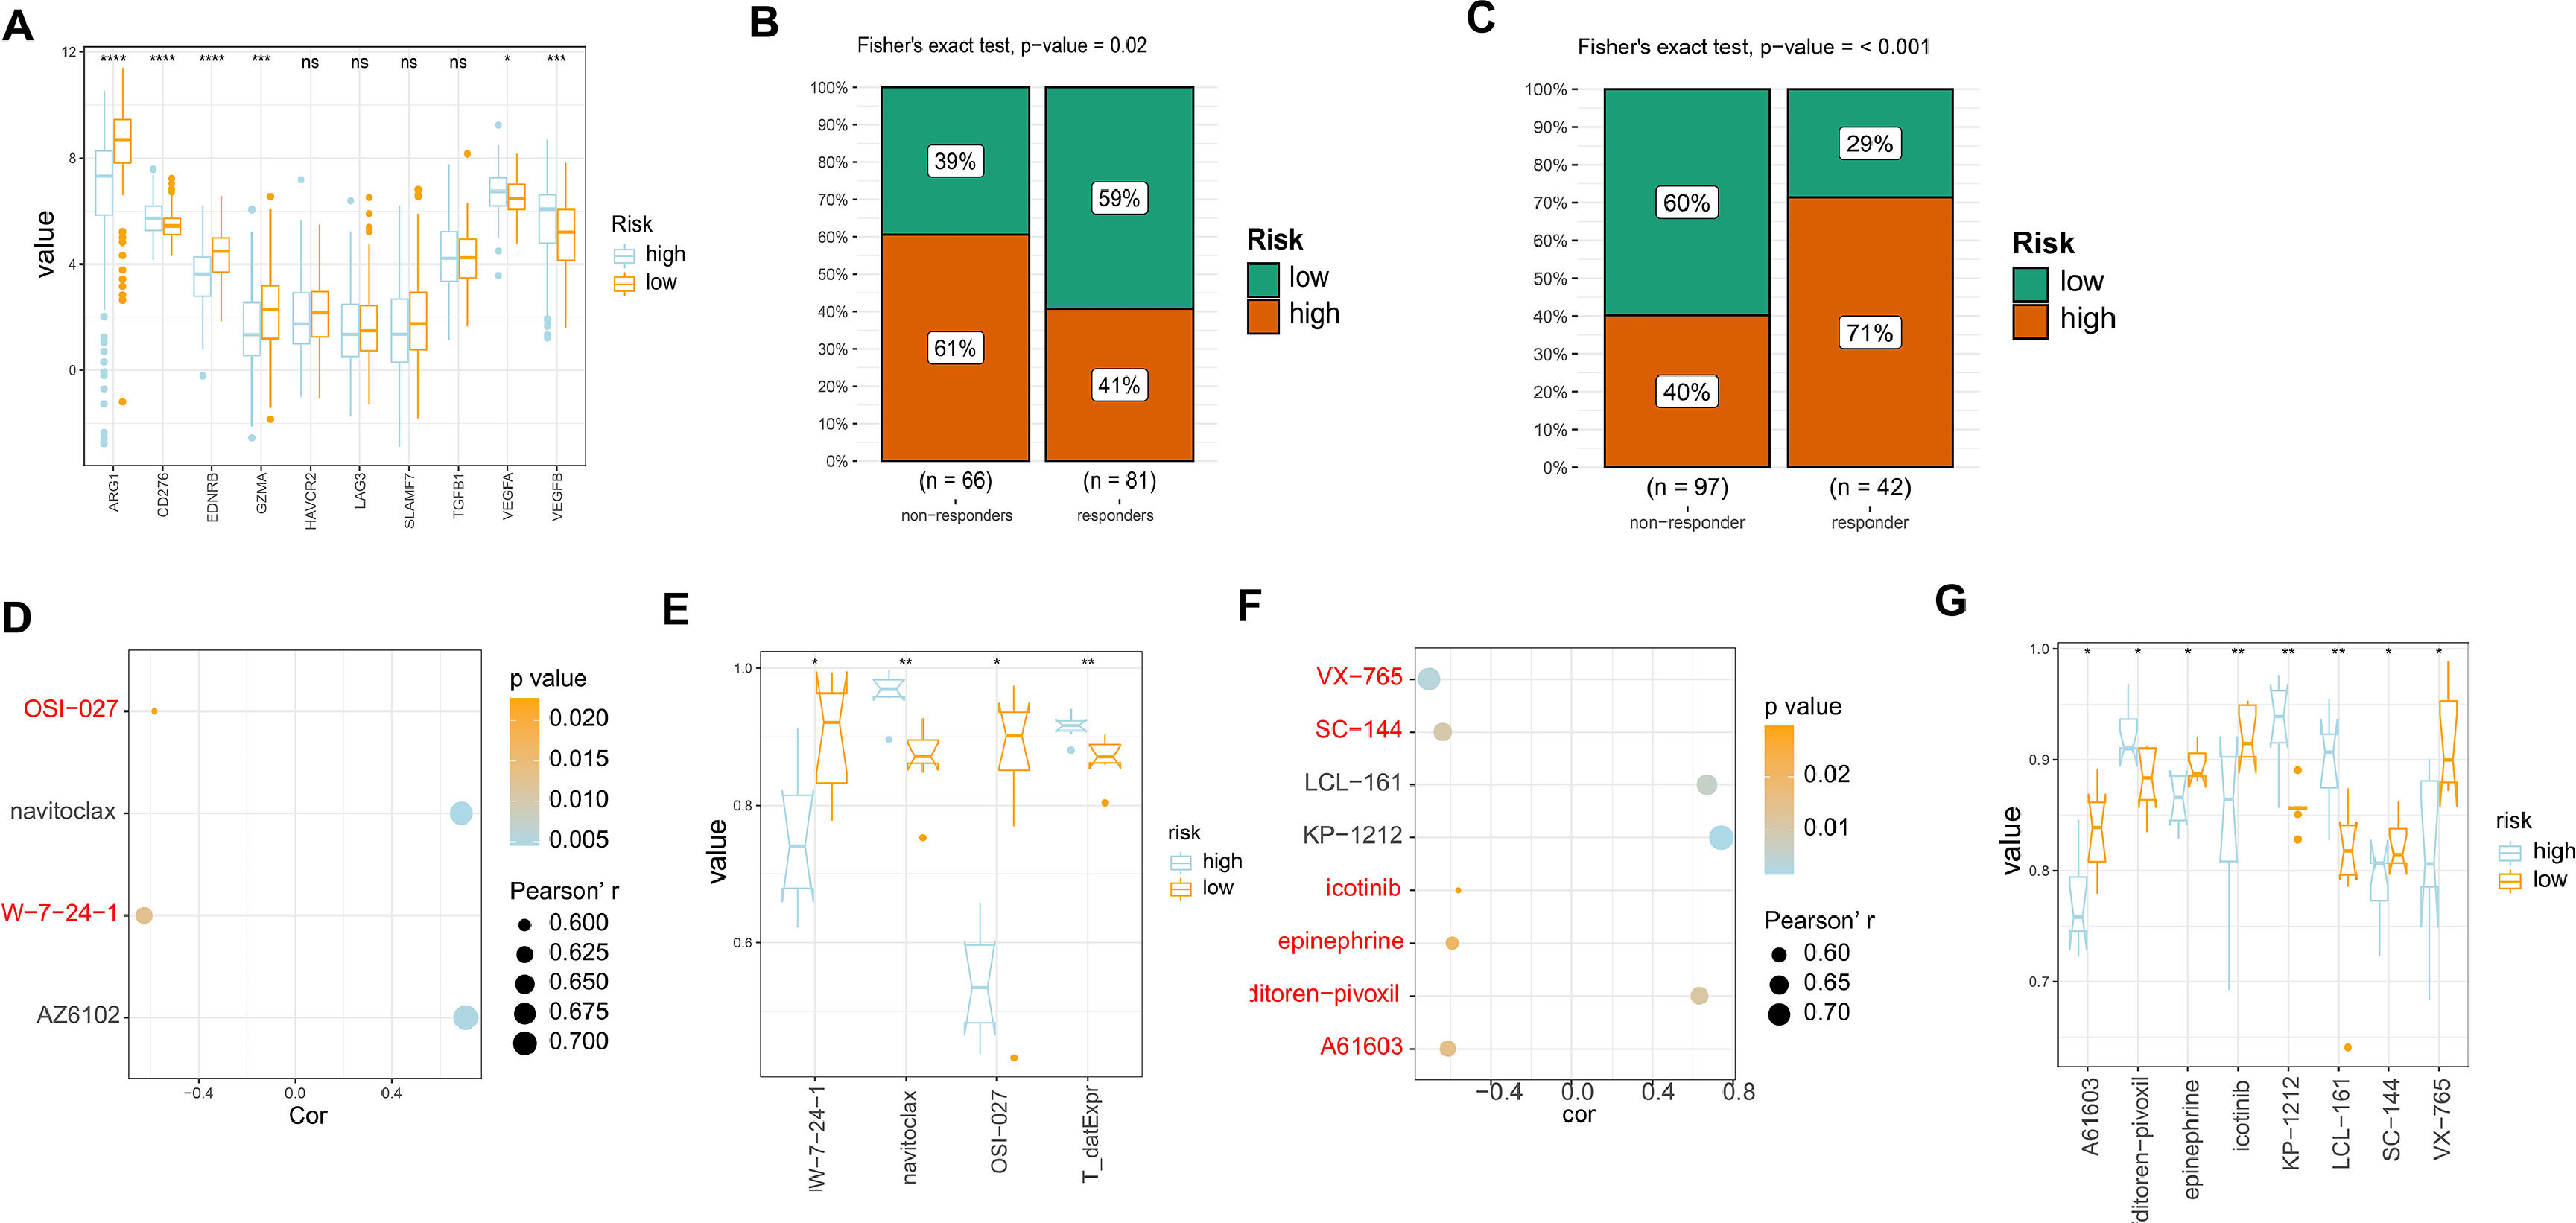
In order to evaluate the responsiveness of HCC patients to different drugs, we examined the expression of drug targets in both high and low-risk models. Our results indicated that there were no significant differences in the expression of most drug targets between the two groups. However, we did observe increased expression of ARG1, EDNRB, and GZMA in the low-risk group samples compared to the high-risk group. This suggests that patients in the low-risk group may have better responses to drugs that target these specific drug targets (Fig. 5A). Subsequently, we evaluated the response of our established risk model to TACE, sorafenib-based treatment, and radiotherapy using the GSE104580 and GSE109211 datasets. The findings indicated that patients categorized as low-risk exhibited increased sensitivity to TACE therapy, while those classified as high-risk displayed heightened sensitivity to sorafenib-based treatment (Fig. 5B-C). Additionally, an exploration into the correlation and variations in the area under the ROC curve (AUC) for GDSC medications associated with liver cancer's high and low-risk models was conducted. The outcomes revealed that two closely related medications (JW-7-24-1 and OSI-027) exhibited elevated AUC values in the low-risk group as opposed to the high-risk group (Fig. 5D-E). Likewise, an examination of closely associated PRISM2 medications in the high and low-risk liver cancer models showed that those in the low-risk group displayed heightened AUC values, including VX-765, SC-144, icotinib, epinephrine, and A61603. This indicates a potentially better prognosis for patients in the low-risk category when treated with these medications (Fig. 5F-G). Therefore, for patients with different risk profiles, targeting specific drug targets for treatment may yield better therapeutic outcomes.
 The expression levels of different drug targets in the high and low-risk models. (B) Comparison of the therapeutic effects of TACE treatment between the high and low-risk groups using GSE104580. (C) Comparison of the therapeutic effects of sorafenib treatment between the high and low-risk groups using GSE0109211. (D) Comparison of drug correlations related to high and low-risk groups in GDSC. (E) Comparison of drug differences related to high and low-risk groups in GDSC. (F) (D) Comparison of drug correlations related to high and low-risk groups in PRISM2. (G) Comparison of drug differences related to high and low-risk groups in PRISM2.")
Analysis of drug sensitivity in high/low risk of HCC. (A) The expression levels of different drug targets in the high and low-risk models. (B) Comparison of the therapeutic effects of TACE treatment between the high and low-risk groups using GSE104580. (C) Comparison of the therapeutic effects of sorafenib treatment between the high and low-risk groups using GSE0109211. (D) Comparison of drug correlations related to high and low-risk groups in GDSC. (E) Comparison of drug differences related to high and low-risk groups in GDSC. (F) (D) Comparison of drug correlations related to high and low-risk groups in PRISM2. (G) Comparison of drug differences related to high and low-risk groups in PRISM2.
When the liver is exposed to continuous stimuli such as hepatitis B/hepatitis C viruses, alcohol, aflatoxins, and others, it leads to disruption of tissue homeostasis and immune system, resulting in pathological inflammation and eventually giving rise to liver cirrhosis, fibrosis, and even cancer. HCC represents a typical inflammatory cancer where a series of cytokines and chemokines are involved in its initiation and progression, enhancing tumor immunogenicity and evading host immune surveillance. Currently, clinical screening for liver cancer primarily relies on CT scans, MRI, and the expression levels of certain biomarkers such as alpha-fetoprotein (AFP) and des-γ-carboxy prothrombin. Typically, an AFP value greater than 500 ng/mL indicates the presence of hepatocellular carcinoma, but a negative AFP result does not necessarily rule out the possibility of having liver cancer. These biomarkers and related diagnostic methods have their limitations. Furthermore, despite significant advances in the treatment of hepatocellular carcinoma, the prognosis for patients remains poor due to high recurrence rates. Therefore, we try to utilize computer algorithms, bioinformatics, and other technologies to identify key driving factors during the progression from hepatitis to liver cirrhosis to hepatocellular carcinoma. Our objective is to establish relevant prognostic models to accurately determine the disease stage and intervene accordingly, thereby increasing patient survival rates and improving their quality of life.
In this study, by integrating the analysis of data from hepatitis, liver cirrhosis, and hepatocellular carcinoma, we identified 10 driver genes associated with prognosis during the progression of liver diseases. Interestingly, the mRNA expression levels of these genes gradually decreased with disease progression, suggesting that their low expression may be a key factor in the progression of liver diseases. To further investigate the reasons for the expression changes of DGs, the mutation status was analyzed by ‘maftools’ package. The results showed that the overall mutation frequency of these DGs was not significant, and some genes did not exhibit any mutations. Therefore, mutations may not be the primary cause of the low expression of these genes in hepatocellular carcinoma. DNA methylation, as one of the most abundant epigenetic modifications, plays a crucial role in growth, development, and cellular biology [23]. Research has shown that aberrant methylation can silence the expression of tumor suppressor genes and promote the initiation and progression of tumors, making it a potential biomarker for the diagnosis and prognosis of various cancers.[24-27].Recent findings indicate that epigenetic processes, such as DNA methylation, are vital for controlling gene expression in cancerous cells [28]. Our investigation revealed a substantial inverse relationship between DNA methylation and mRNA levels of the majority of Differentiated Genes (DGs), potentially influencing the progression of HCC.
Furthermore, we conducted multivariable Cox analysis on the samples and classified them into high and low-risk groups based on the median. Interestingly, we found that Hazard Ratio (HR) of most DGs is less than 1. The HR is a commonly used statistical measure in survival analysis, employed to compare the relative differences in risk of an event occurring between two or more study groups [29-31]. The HR serves as a statistical indicator of comparative risk, where an HR less than 1 signifies that high expression of the relevant gene significantly reduces the incidence of events such as disease relapse, worsening, or death [32]. We observed that the low-risk group not only exhibited significant overexpression of these DGs but also demonstrated better prognosis, indicating that high expression of DGs contributes to an improved patient survival period. The ROC curve confirmed the accuracy and effectiveness of the model we constructed, with T stage and risk score remaining independent prognostic factors. Additionally, enrichment analysis of the pathways involved in the progression of liver diseases revealed that, apart from conventional immune-related pathways, metabolism-related pathways also play a crucial role, including xenobiotic metabolism, heme metabolism, fatty acid metabolism, and bile acid metabolism. Studies have shown that the tumor microenvironment in HCC involves dysregulation of various metabolic processes, with aberrantly activated oncogenic signaling pathways resulting from lipid imbalance being considered crucial in the development and progression of HCC [33-35]. In patients with chronic non-communicable liver diseases, there is a higher probability of developing HCC, with non-esterified fatty acid-enriched diseases likely playing a key role in the progression from non-alcoholic steatohepatitis to HCC [36,37]. A recent study discovered widespread upregulation of genes associated with fatty acid biosynthesis in HCC samples compared to non-cancerous liver tissue [38,39]. Combined with our study, these evidences clarified that concomitant liver diseases can potentially facilitate tumor progression by influencing immune and metabolism-related pathways.
Moreover, we performed additional analysis on single-cell RNA sequencing data obtained from liver cancer samples to explore the signaling pathways by which these driver genes exert their effects and the intercellular interaction patterns. Our results revealed that these driver genes were not fully expressed in all nine annotated cell types in HCC. Specifically, SRGN exhibited significant expression in monocytes, macrophages, NK cells, and T cells. Moreover, crucial signaling pathways in HCC progression included VEGF, MIF, PARs, and PIN, with a gradual downregulation of MIF signaling pathway expression as the disease progressed. This suggests that MIF may play a pivotal role as a key signaling pathway in the progression of liver diseases. Additionally, we analyzed the relationship between the high/low-risk models and drug sensitivity. By comparing the expression levels of drug targets in the high and low-risk models and assessing the response to drug treatments, we found that patients in the high-risk group exhibited a favorable response to sorafenib, while those in the low-risk group demonstrated better treatment outcomes with TACE. In conclusion, our identified driver genes involved in the progression of liver diseases may promote cancer progression through the MIF signaling pathway. Tailoring treatment strategies based on the risk characteristics of individual patients can optimize tumor management, improve prognosis, and enhance patients' quality of life.
Exploring the critical driver genes in the complex pathogenic progression from hepatitis to liver cirrhosis and ultimately HCC is not only vital for deepening our understanding of the evolutionary mechanisms underpinning liver diseases, but it also harbors immense clinical translation value and practical significance. By systematically screening genes intimately tied to disease advancement, this study strives to unravel the fundamental genetic and molecular mechanisms propelling the sequential transformation across these pathologic stages. This meticulous endeavor enriches the scientific community's capacity to delineate a detailed molecular blueprint of disease progression, thereby uncovering potential therapeutic intervention points. Furthermore, the construction of predictive models based on these driver genes furnishes a personalized risk assessment tool for patients afflicted with hepatitis resulting from viral infections. Through the scrutiny of specific gene expression patterns in these individuals, the model enables a forward-looking identification of those at heightened risk for rapid progression towards liver cirrhosis or hepatocarcinoma. Early detection not only prompts more vigilant monitoring and preventive measures on the part of the patients but also arms clinicians with a foundation for devising more tailored therapeutic strategies. Of paramount importance, the identified driver genes hold promise as targets for the development of novel therapeutic agents or biomarkers. Targeted interventions along pathways governed by these genes pave the way for more individualized and efficacious treatment modalities, potentially enhancing therapeutic outcomes and even halting disease malignancy. Accurate forecasting of disease progression risk permits a judicious allocation of medical resources, prioritizing the most vulnerable patients and thereby enhancing the overall efficiency of healthcare systems. Thus, this research endeavors not merely to elucidate the intricate pathways of disease but to pave a path toward precision medicine, improved patient outcomes, and optimized health resource management.
Nonetheless, despite the substantial significance of research that initiates with hepatitis to identify driver genes and construct predictive models, inherent limitations persist: Firstly, the progression from hepatitis to liver cirrhosis or hepatocarcinoma is subject to a myriad of influences, encompassing genetic predisposition, variations in viral infection types (e.g., hepatitis B and C), lifestyle habits, and environmental factors. Current studies may grapple with incorporating all such variables comprehensively, constraining the generalizability of resultant models. Disparities may emerge among geographically diverse populations, ethnicities, and viral subtypes, thereby underlining the challenge. Secondly, while certain genetic markers have been linked to disease progression, their specificity and sensitivity as predictive indicators warrant further validation. The possibility of false-positive or false-negative results—especially regarding nuanced variations across different stages of the disease—casts a shadow over model accuracy. Thirdly, the integrity of research findings is heavily dependent on data quality and the representativeness of samples utilized. Non-uniformity in sample sourcing, processing methodologies, coupled with the constraints imposed by limited sample sizes, can potentially introduce bias, distort analytical outcomes, and undermine the robustness of derived models.
Given the global distribution of hepatitis viruses, a surge in international collaborative projects is anticipated, alongside the development of cross-regional and cross-ethnic big data sharing platforms. This trend fosters a deeper understanding of genetic disparities and environmental interactions among diverse populations, propelling concerted efforts in hepatitis prevention and control worldwide. In the imminent future, advancements and integration of high-throughput sequencing, single-cell sequencing technologies, and artificial intelligence algorithms will facilitate a more nuanced dissection of the molecular pathways underlying hepatitis progression. This refined understanding will permit the discovery of an expanded repertoire of genetic biomarkers intricately affiliated with disease advancement, thereby augmenting the precision and personalization of predictive models. The unveiling of driver genes charts a course for the validation of new therapeutic targets and drug development ventures, particularly in the realm of cutting-edge immunotherapies and gene editing techniques, inaugurating a new era in treating hepatitis and its subsequent complications. With accelerated translation of research into practical applications and the reduction in associated costs, genetically tailored individualized healthcare strategies are poised to gain broader implementation in hepatitis therapy and surveillance. Such personalized approaches will bestow upon patients’ preventive measure, diagnostic procedures, and therapeutic regimes meticulously customized to their unique genomic profiles.
5ConclusionsIn summary, our study has identified ten driver genes that play crucial roles in the progression of hepatitis-cirrhosis-hepatocellular carcinoma. And the risk model constructed based on these driver genes enables accurate prognosis assessment of HCC patients. Importantly, the risk model allows for the prediction of patients' drug sensitivity, facilitating the adjustment of treatment strategies and further enhancing the effectiveness of tumor therapy, ultimately improving patient survival.
Availability of data and materialsAll datasets generated for this study are included in the manuscript.
FundingNot applicable.
Authors’ contributionsZXJ wrote the manuscript and searched the relevant literature. CXY critically reviewed the manuscript. Both authors have read and approved the final version of the manuscript.
Not applicable.


