To study the correlation between the sensitivity threshold values of the different points assessed by the Humphrey Visual Field Analyzer (24-2 Swedish interactive threshold algorithm [SITA] standard strategy) in glaucoma patients.
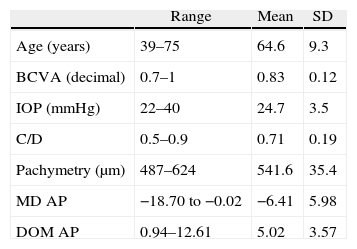
Subjects, material and methodsProspective cross-sectorial study. One-hundred and four eyes of 104 glaucoma patients, defined by the appearance of the optic nerve head, were evaluated. Retinal threshold sensitivity points of standard automated perimetry (SA) with SITA Standard 24-2 program were obtained. The upper and the lower hemifields were studied separately. Pearson correlation coefficients were calculated between the mean threshold sensitivity value at each point of the visual hemifield and the rest of the threshold points in the same hemifield.
ResultsPerimetric correlation maps between retinal threshold sensitivity values in the same hemifield were obtained. Most of the points showed moderate to high correlations (r≥0.65. p<0.001) with neighboring points and distant points in the same hemifield.
ConclusionsThere is a functional relationship between neighboring and distant points in Humphrey Visual Field Analyzer (SITA Standard 24-2) in glaucoma patients. This correlation is related to the anatomical arrangement of ganglion cell axons. This fact enables perimetric patterns of glaucoma defects to be obtained.
Estudiar la interrelación entre los 52 valores de sensibilidad retiniana obtenidos en la perimetría automatizada convencional (PA) tipo Humphrey con la estrategia Swedish interactive threshold algorithm (SITA) estándar 24-2 en pacientes con glaucoma.
Sujetos, material y métodosEstudio prospectivo transversal en el que se incluyeron 104 ojos de 104 pacientes glaucomatosos diagnosticados por la apariencia de la cabeza del nervio óptico. Se recogió el valor de sensibilidad umbral de cada uno de los puntos de la PA SITA Standard 24-2, considerando cada hemicampo por separado. Se aplicó la prueba de Kolmogorov-Smirnov para demostrar la distribución normal de las variables, y se calcularon los coeficientes de correlación de Pearson entre los valores umbral de cada punto con todos los demás puntos del mismo hemicampo.
ResultadosSe obtuvieron mapas de correlación perimétrica entre valores umbral de un mismo hemicampo. La mayoría de los puntos evaluados mostraron correlaciones significativas (r≥0,65; p<0,001) entre puntos vecinos, así como entre puntos distantes dentro del mismo hemicampo.
ConclusionesExiste una relación de dependencia funcional entre puntos vecinos y distantes en la PA de pacientes con glaucoma, en correspondencia con la distribución de los axones de las células ganglionares, que permite la obtención de patrones perimétricos del glaucoma.


