


La contaminación atmosférica se ha considerado como uno de los desafíos ambientales más importantes a causa de su impacto directo en los ecosistemas y la salud humana. Se monitorearon los cambios temporales en la composición de 20 muestras de agua de lluvia en la región árida de Karachi, Pakistán, durante el monzón del suroeste de 2009, para evaluar de forma indirecta la calidad del aire. El objetivo del estudio fue identificar los niveles de la contaminación atmosférica y su posible componente antropogénico. Se analizaron los iones de metales con el fin de predecir riesgos para la salud. Se encontró que las muestras de lluvia fueron alcalinas (pH 5.55-7.55) debido a la presencia de partículas ricas en calcio y magnesio. Las lluvias continuas en días consecutivos mostraron un descenso notable en los niveles de contaminación, en tanto que la estación seca los potenció. Se observaron correlaciones importantes del total de sólidos disueltos con K+, Na+, Ca2+, Mg2+ y Cl−, así como una correlación relativamente débil del total de partículas suspendidas con los metales, lo que sugiere la presencia de otras partículas suspendidas en el aire. Se utilizaron análisis de componentes principales y de medias para predecir fuentes antropogénicas de contaminación. Este estudio será útil para definir la planeación estratégica y formular políticas orientadas a controlar los niveles de contaminación atmosférica en la ciudad.
Air pollution has been considered one of the most important environmental challenges because of its direct effect on ecosystems and human health. Temporal changes in the composition of 20 samples of rainwater in the arid region of Karachi, Pakistan during the southwest monsoon of 2009 have been monitored to carry out the indirect assessment of air quality. The study has been fulfilled with the aim of identifying the level of air pollution, and the relative contribution of possible anthropogenic activities. Metal ions were analyzed to predict health risks. Rain samples were found to be alkaline (pH 5.55-7.55) due to the influence of calcium and magnesium rich particles. Continuous rains in consecutive days showed a remarkable decline in air pollution while the dry season boosted up the level of pollution. Strong correlations of total dissolved solids with K+, Na+, Ca2+, Mg2+, and Cl− were observed. A relatively weak correlation of total suspended particles with metals showed the possibility of some other particulate matters being suspended in the air. Principal component analysis and analysis of means were used to predict the anthropogenic source of pollution. This study will be helpful to formulate strategic planning and policies for controlling the level of air pollution in the city.
Pollution monitoring through the estimation of air pollutants in wet deposition has increased during the last decades (Zapletal et al., 2007; Holder, 2004). Fog in the metropolitan area of Karachi occurs during the winter season (November to March). The southwest monsoon arises during the summer from June to September throughout Pakistan, excluding the regions of western Balochistan, Chitral, Gilgit-Baltistan, and the Federally Administered Tribal Areas. Monsoon rains bring a much-awaited relief from the scorching summer heat. These monsoon rains are quite heavy by nature and can cause significant flooding.
The monsoon regime dominates the climate of Pakistan. Karachi is the biggest and largest industrial city of the country, heavily populated with 18 million inhabitants in an area of 3527km2 and an elevation of 8 m. It has an arid climate with a low average precipitation level (approximately 250 mm per annum), most of which occurs during July-August or in September as a late monsoon season. Located on the coast, pollutants are pushed towards the shore during the north-east (NE) monsoon and inland during the south-west (SW) monsoon (Ghauri and Mirza, 1994). Depending upon the nature of air pollutants, rainwater may be acid or alkaline. Industries and vehicles emit a large amount of NOx and SO2, which are responsible for acid rain. Acid rain refects the emission of acidic gases as the result of anthropogenic activities (Ham et al., 2010). NOx and SO2 are transformed to HNO3 and H2SO4 when they interact with water in the atmosphere. The acids combine with moisture in the air and fall to the earth as acid rain or snow. Conversely, dust particles may contain a significant amount of basic cations which neutralize the acidity of rainwater. The composition of rainwater plays an important role in attracting pollutants from the atmosphere. Particulate matter plays an important role in attracting metal pollutants (Mohiuddin et al., 2010). The scavenged metals can deposit to the air up to a distance of 100km from their source. Therefore, the estimation of anions in acidic rain and cations in alkaline rain is of great importance for source identification of air pollution in rainwater.
Considering the importance of rainwater chemistry, the present study has been carried out with the aim of identifying the variations in the amount of ionic species during one monsoon season (comprising 13 events) and the contribution of possible anthropogenic activities in the studied areas. The data obtained in this study significantly contribute to the limited knowledge of temporal variations of rainwater quality in Karachi, in order to understand its use as an alternative to drinking water, especially in areas of short domestic water supply. The study can also increase the awareness of common people towards an important environmental issue. Data are compared by means of statistical analysis with similar works carried out at various regions of the world.
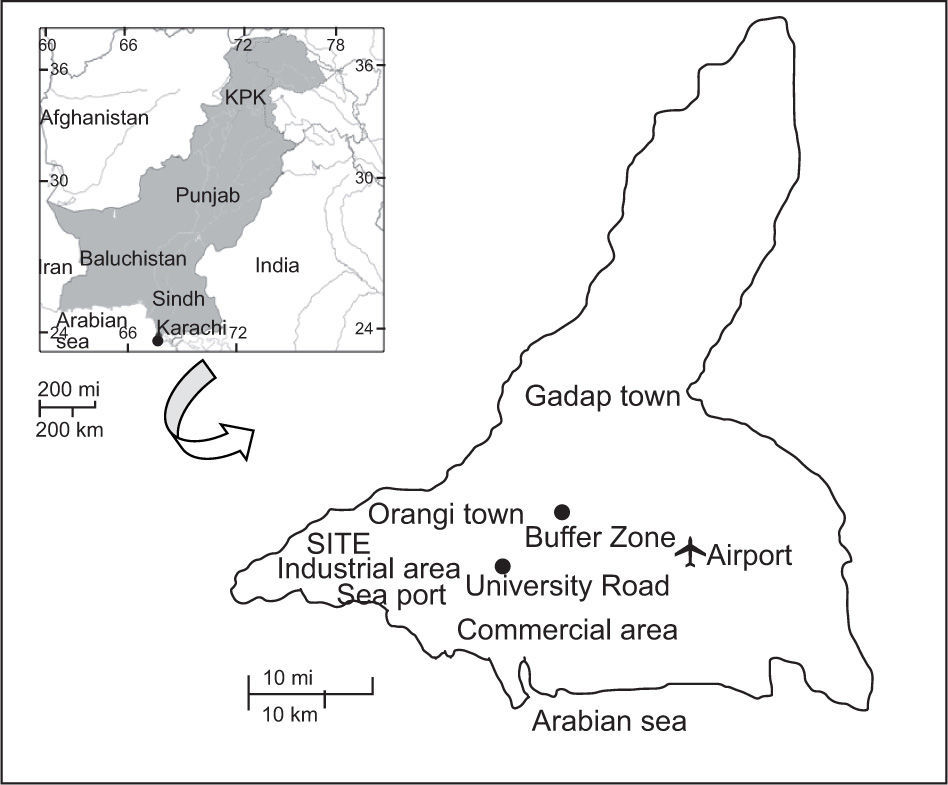
2Materials and methods2.1Sampling sitesKarachi is located in southern Pakistan (24° 48' N, 66° 59’ E) at the coast of the Arabian Sea (Indian Ocean); as a result, it has a relatively mild arid climate. Being the industrial hub of the country, most industries (including textiles, chemicals and fertilizers, food processing, building materials, petroleum refining, and ship repairing) are located in this region. According to a report of air quality management in Karachi, NOx and SO2 levels range from 10 to 43.70 and 7.90 to 21.90 µg/m3, respectively (Institutional Analysis of Air Quality Management in Urban Pakistan, 2009). Moreover, the city is rapidly affected by the increase in industrialization, energy consumption, dust emitted from vast construction activities and dry sand storms. For these reasons, significant deterioration on air quality has occurred, causing accumulation of pollutants on trees, land, and air. These pollutants reach ground through precipitation (Wahid et al., 2001) and were subjected to analysis for the assessment.
The Pakistan Meteorological Department recorded pre-monsoon activity in Karachi on June 23 and 25, 2009 due to the formation of a weak tropical depression in the Arabian Sea. As a result of this depression, the storm caused monsoon rainfall on June 26. It was a light shower with gusty winds (11km/h) in the coastal area. The next heavy shower was witnessed from July 18 in Karachi. It was the second highest precipitation in the history of Karachi (245mm in four hours), and caused severe flooding in the city. This record-breaking rainfall in Karachi developed first as a tropical depression in the Bay of Bengal and moved in a west-north-west direction; it hit Karachi after crossing Madhya Pradesh and Rajasthan, in India. The second monsoon system developed over the northwest Bay of Bengal; then it intensified into a tropical depression and moved in the same direction as the previous one. After crossing the southern part of Rajasthan it moved towards Karachi, where it dissipated. This system caused moderate isolated rain (18mm) on July 20 with strong winds in Karachi. Twenty samples of rainwater were collected from the two residential areas of the city: nine from the University Road (UR) and 11 from the Buffer Zone (BZ) during the 2009 SW monsoon season (June to July). Figure 1 shows the location of the sampling sites.

The UR sampling site is located 15km from the center of the city (24° 56' 18.79" N, 67° 7' 13.02" E). Vehicular traffic and domestic heating appear to be the most important local emission sources. The BZ site (24° 57' 24" N, 67° 3' 48" E) is located 7km from the center, adjacent to cement worka and the hilly area of Orangi town. During 2008-2009, a number of construction activities have been carried out in this area by the government of the Karachi district. Other specific pollution sources were vehicular traffic and domestic heating.
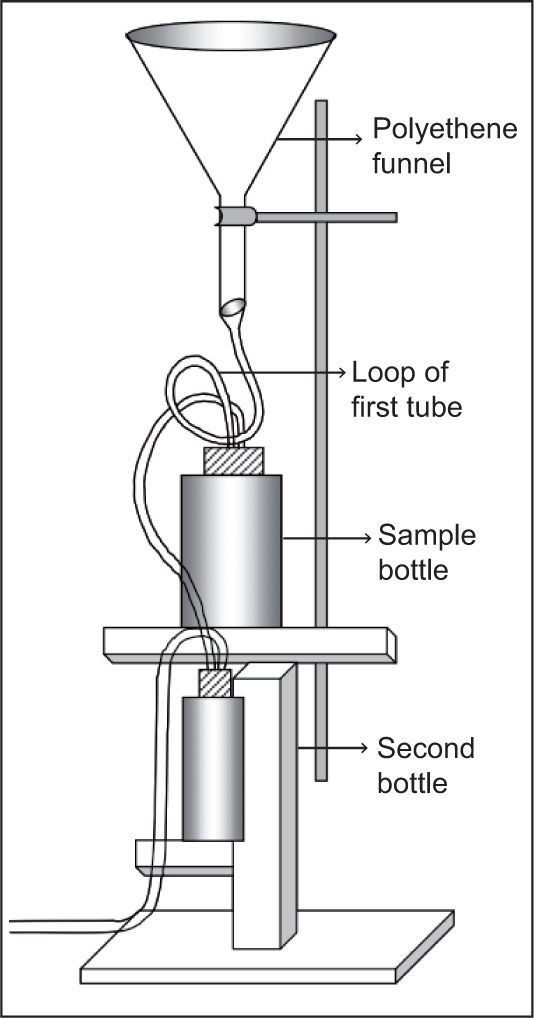
Sampling was carried out in a total deposition sampler (Fig. 2) mounted approximately 3 m above the ground level, away from surface soil and any specific contamination source (Hameed et al., 2006).

Rainwater falls into a polyethene funnel and fills the sample bottle of 500ml through a tube. The overflow of the sample bottle falls into a second bottle, which is already filled with water. A tube is connected to the second bottle for pouring out superfluous water to the ground. The second bottle provides humid air in the tube and eliminates the risk of sample evaporation from the bottle. The loop of the first tube is helpful to maintain the original ion concentration by trapping water and preventing evaporation.
Precipitation samples were collected during the first few minutes of each event, when the highest concentration of pollutants is present (Tuncel et al., 1994; Dupre et al., 2006). In case of continuous rain, consecutive samples of the same event were collected every 6 h. The samples were analyzed for alkalinity, pH and conductivity within 24-48 h. The rest of the samples were stored at 4 °C to minimize physico-chemical changes. The analysis was completed within one week of sample collection.
2.2MethodsDifferent analytical techniques were used to determine the composition of precipitation. A pH meter (Orion 520 A) was used to measure the pH of rain samples. Sodium (Na), potassium (K), calcium (Ca) and magnesium (Mg) were quantified using the atomic absorption spectrophotometer PE-2380. The Orion 960 Autochemistry system was used to measure chloride (Cl−) in the samples. NH4+, NO3−, SO42−, and alkalinity were measured in accordance with the standard methods for examination of water and waste water APHA, AWWA and WEF, 1992). The detection limits of measured pH and ions are shown in Table I. Total dissolved solids (TDS) and conductivity were measured with a Jenway 4320 conductivity meter. Total suspended particles (TSP) were measured by filtering 100ml of rainwater through a pre-weighed high-efficiency glass-microfiber filter (Whatman GF/F) that was dried to constant weight at 60 °C. The calculation was made using the following equation:
where A is the final dried weight of the filter in g, B is the initial weight of the filter in g and C is the volume of water filtered measured in liters. The concentration of HCO3− was estimated from the theoretical relationship described by Kulshrestha et al. (2003):

Chemometric measurements were performed using the statistical software Minitab version 14.
2.3Quality controlTo ensure the accuracy and reproducibility of data we used analytical grade reagents, as well as class “A” volumetric glassware. The standards for atomic absorption spectrophotometry were those of May & Baker, Ltd., England. Standard reference materials Spectroquant CombiCheck 30 and 40 (Darmstadt, Germany) were used as quality control samples.
3Results and discussion3.1Chemical compositionThe chemical composition of UR and BZ rain samples are summarized in Tables II and III. Rainwater pH has been considered the most important parameter to predict the nature of anthropogenic activities.
Chemical composition of rainwater samples.
| Date | Amount of rain (mm) | Sampling time (LT) | Alkalinity (mg/L) | Conductivity (µS/cm) | TDS (mg/L) | TSP (mg/L) | pH | |||||
|---|---|---|---|---|---|---|---|---|---|---|---|---|
| UR | BZ | UR | BZ | UR | BZ | UR | BZ | UR | BZ | |||
| 26-Jun | 2.5 | 16:05 | 46 | 86 | 303.0 | 238.0 | 182.3 | 142.6 | 40 | 86 | 6.10 | 6.74 |
| 18-Jul | 2.5 | 5:55 | 32 | 24 | 97.8 | 200.0 | 58.7 | 120.0 | 8 | 24 | 5.74 | 7.23 |
| 18-Jul | 11:30 | 18 | – | 22.2 | – | 13.3 | – | 4 | – | 5.55 | – | |
| 18-Jul | 17:55 | 10 | – | 4.3 | – | 2.6 | – | 0 | – | 5.93 | – | |
| 19-Jul | 2.5 | 12:30 | 26 | 48 | 43.6 | 45.3 | 25.8 | 27.2 | 64 | 48 | 5.82 | 6.71 |
| 19-Jul | 18:40 | 24 | 24 | 68.1 | 42.5 | 40.9 | 25.5 | 8 | 24 | 5.82 | 6.94 | |
| 22-Jul | 2.4 | 7:55 | 32 | 110 | 102.1 | 866.0 | 61.3 | 520.0 | 80 | 110 | 5.70 | 8.09 |
| 22-Jul | 14:30 | 48 | 50 | 54.7 | 241.0 | 32.8 | 144.6 | 0 | 50 | 5.58 | 7.40 | |
| 23-Jul | 2.4 | 8:25 | 36 | 52 | 95.8 | 146.8 | 57.5 | 88.1 | 32 | 52 | 6.08 | 7.54 |
| 24-Jul | 2.4 | 12:30 | – | 64 | – | 218.0 | – | 131.0 | – | 64 | – | 7.55 |
| 30-Jul | 2.2 | 6:25 | – | 24 | – | 30.6 | – | 18.4 | – | 24 | – | 6.87 |
| 30-Jul | 21:20 | – | 32 | – | 51.8 | – | 31.1 | – | 32 | – | 7.20 | |
| 31-Jul | 2.2 | 12:50 | – | 24 | – | 23.0 | – | 13.8 | – | 24 | – | 6.52 |
Chemical composition of rainwater samples (mg/L).
| Date UR | HCO3− | K | Na | Ca | Mg | Cl− | NO3 | SO42− | NH4+ | ||||||||||
|---|---|---|---|---|---|---|---|---|---|---|---|---|---|---|---|---|---|---|---|
| UR | BZ | UR | BZ | UR | BZ | UR | BZ | UR | BZ | UR | BZ | UR | BZ | UR | BZ | UR | BZ | ||
| 26-Jun | 11.22 | 48.98 | 2.40 | 2.50 | 1.07 | 1.17 | 20.1 | 28.4 | 5.20 | 1.34 | 77.60 | 40.30 | 10.86 | 2.92 | 6.28 | 6.80 | 0.73 | 1.09 | |
| 18-Jul | 4.89 | 151.36 | 1.81 | 1.50 | 0.94 | 2.00 | 7.3 | 15.6 | 0.94 | 1.48 | 14.10 | 49.10 | 0.37 | 0.81 | 5.48 | 6.00 | 0.44 | 0.76 | |
| 18-Jul | 3.16 | – | 0.26 | – | 0.17 | – | 0.8 | – | 0.17 | – | 0.02 | – | BDL | – | 5.08 | – | 0.40 | – | |
| 18-Jul | 7.58 | – | 0.20 | – | BDL | – | 0.3 | – | 0.07 | – | BDL | – | BDL | – | 5.05 | – | BDL | – | |
| 19-M | 5.89 | 45.71 | 0.20 | 0.10 | 0.36 | 0.29 | 1.8 | 1.6 | 0.50 | 0.27 | 4.37 | 5.03 | 0.80 | 1.21 | 5.14 | 5.13 | 0.45 | ||
| 19-M | 5.89 | 77.62 | 0.38 | 0.10 | 0.67 | 0.28 | 4.0 | 1 8 | 0.58 | 0.29 | 15.90 | 5.86 | 10.07 | 0.59 | 5.28 | 5.14 | 0.52 | ||
| 22-M | 4.47 | 1096.48 | 1.20 | 9.70 | 1.22 | 20.00 | 5.5 | 32.6 | 1.13 | 20.00 | 17.80 | 214.10 | 0.52 | 0.22 | 5.37 | 7.06 | 0.83 | 1.08 | |
| 22-M | 3.39 | 223.87 | 0.70 | BDL | 0.3 | 3.00 | 4.1 | 19.2 | 0.44 | 2.12 | 5.06 | 59.00 | 1.01 | BDL | 5.28 | 6.22 | 0.64 | 0.61 | |
| 23-Jul | 10.72 | 309.03 | 0.70 | 1.50 | 0.81 | 1.04 | 7.7 | 150 | 0.84 | 0.80 | 17.58 | 29.70 | 0.70 | 2.05 | 5.51 | 5.96 | 0.41 | 0.59 | |
| 24-Jul | – | 316.23 | – | 1.80 | – | 2.00 | – | 24.6 | – | 1.54 | – | 52.90 | – | 1.79 | – | 6.56 | – | 0.52 | |
| 30-Jul | – | 66.07 | – | 0.40 | – | 0.22 | – | 2.2 | – | 0.26 | – | 3.34 | – | 0.76 | – | 5.17 | – | 0.56 | |
| 30-Jul | – | 141.25 | – | 0.20 | – | 0.18 | – | 4.9 | – | 0.26 | – | 6.45 | – | 0.91 | – | 5.03 | – | BDL | |
| 31-Jul | – | 29.51 | – | 0.10 | – | 0.14 | – | 0.6 | – | 0.14 | – | 20.00 | – | 0.31 | – | 5.07 | – | 0.45 | |
| WHO (2006) | Max desirable | 300 | 100 | 50 | 75 | 30 | 250 | 50 | 250 | – | |||||||||
| drinking water standard | Max permissible | 600 | 250 | 200 | 200 | 150 | 600 | 50 | 600 | – | |||||||||
BDL: below detection limit. WHO: World Health Organization.
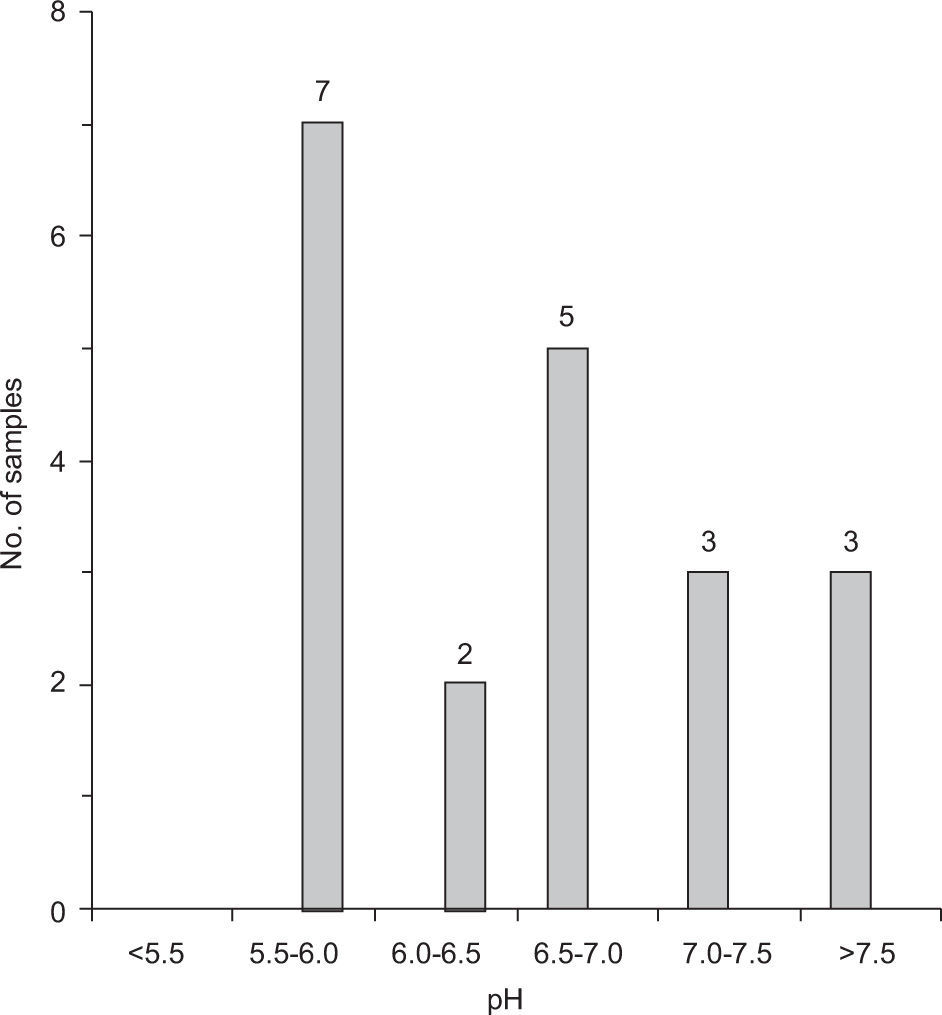
The pH value generally assumed as neutral for rainwater is 5.6. It is the pH of cloud water at equilibrium with atmospheric CO2 (Wang and Han, 2011). The majority of samples showed a pH substantially higher than the neutral value. It was ranged from 5.55-6.10 with a mean value of 5.81 for UR and 6.52-8.09 with a mean value of 7.16 for BZ samples.
Figure 3 shows the sample distribution for pH at both sampling stations. Out of nine rain events at UR, only two were observed in a neutral range, which occurred after continuous rain. At BZ, pH was persistently alkaline (>5.6) in all events. Alkaline pH suggested that the influence of anthropogenic sources due to acidic gases is minor and the effect of particulate matters of alkaline nature like dust particles is dominant. This showed similarity to data obtained from some Indian sites, Lucknow (Khare et al., 2004), Gopalpura, Agra (Satsangi et al.,1998), and Bhubaneswar (Das et al., 2005).

Alkalinity was measured as 10-48 and 24-110mg/L of CaCO3 for UR and BZ samples, respectively. The alkalinity of rainwater does not mean that rain has an acidic or alkaline nature; it measures the buffering capacity of the samples due to varying amounts of OH−, CO32−, and HCO3−. UR samples may be considered too clean with a mild buffering capacity (alkalinity < 50mg/L). The results are comparable with the study of Huo et al. (2011). BZ samples showed relatively higher alkalinity, especially at the starting of the first and second monsoon system. This observation is associated with high loading of abundant particulate matters (especially dust) in the atmosphere as a result of ongoing construction activities. It is important to note that the first and second monsoon systems caused rainfall with strong and gusty winds in Karachi. Therefore, wind also contributed to the transportation of fine dust from the mountains of Orangi town, a neighboring area of BZ. This assumption is supported by the amounts of TSP in rainstorms of BZ (Table II). Consequently, it was concluded that the air of BZ is significantly contaminated with base cations or alkaline aerosols which neutralized the acidity of rainwater before being deposited on the ground surface (Kulshrestha et al., 2003). Continuous rain events on July 18, 2009, settled down the alkaline aerosols onto the earth and dropped the alkalinity values of UR and BZ samples from 46-84 to 10-12mg/L, respectively. This resulted in values of alkalinity of rainwater comparable to those of fresh water (20-200mg/L).
The electrical conductivity of rainwater ranges from 4.32-303 µS cm−1 in UR samples and 23-866 µS cm−1 in BZ samples. Consecutive rains at UR (~200mm) made conductivity very close to deionized water (0.5-3.0 µS cm−1). The highest value of conductivity was observed on July 22 for a BZ sample. It is evident from Table III that the highest amounts of Cl−, HCO3−, Na+, K+, Ca2+, and Mg2+ were also observed in the same sample. Therefore, the highest conductivity was attributed to the strong contribution of dissolved salts of these ions.
The values of Cl− in water samples were within those defined by the World Health Organization in its guidelines for drinking-water quality (WHO, 2006). Versari et al. (2002) concluded that a Cl− con centration higher than 250mg/L is responsible for an unpleasant taste of water and represents a risk to human health. It is evident from Table III that only one sample collected on July 22 at BZ shows a value as high as 214mg/L Cl−. The possible sources of Cl− in rainwater are marine aerosols, and industrial or vehicular emission. A higher amount of Na in the same sample represents a high electrolyte (NaCl) concentration in rain due to marine aerosols.
SO42− ions were measured as 5.05-6.80 and 5.03-7.06mg/L in UR and BZ samples, respectively. These values are in good agreement with the data reported by Zapletal et al. (2007). NO3− was estimated as < 0.1-10.86 and < 0.1-2.92mg/L in UR and BZ samples. NH4+ ions were estimated up to 0.83 and 1.09mg/L in UR and BZ samples, respectively. The higher amount of NO3− and lower amount of NH4+ in UR samples shows the contribution of industrial activities in the region. High amounts of suspended particulate matter were found in BZ samples, which were rich in dust particles and Ca and Mg salts. TSP buffers the acidity of rain samples below the cloud scavenging process (Hameed et al., 2006). Since the effects of industrial activities and fossil fuel burning (alkaline pH) appeared to be insignificant in the studied areas, soil dust, construction materials, demolition debris, and sea salts were considered as the major natural and anthropogenic contributors to TSP (Wroble et al., 2000). It was observed that the amounts of particulates suspended in the air decreased after consecutive rains. This indicates that high rainfall washed off TSP and suppressed the lifting of dust particles; as a result, concentrations of Ca and Mg decreased.
Metal particulates play a major role in establishing the alkalinity and TDS of rain samples. The concentration of ions in rain samples of both stations followed the pattern HCO3− > Cl− > Ca2+ > K+ > Mg2+ > Na+, indicating that Ca2+ and HCO3− are the dominant cation and anion, respectively. Soil and roadside dust are the main anthropogenic sources of Ca and Mg, which pollute the air by convection processes, vehicle emissions or wind (Wang and Han, 2011). The results we obtained for metal ions are in good agreement with previous studies (Huang et al., 2008; Xu et al., 2009).
The values of Na, K, Ca, and Mg were found to be within the permissible levels of these elements in drinking water (WHO, 2006). The samples were also analyzed for trace metals. The concentrations of Cu, Fe, Pb, Cd, Ni, Cr, As, Hg and Zn were below the detection limits (2.0mg/L for As and Hg, and 0.1mg/L for the remaining metals). Based on the analysis of the samples and their chemical composition, it is suggested that rainwater of the studied areas may be used for drinking after continuous rain of about 200mm.
The relative magnitude of ionic species found in rain samples on the studied areas was compared with ionic species of different origins (Table IV). In all the studies (including the present one), Ca2+ shows the highest concentration due to crustal origin, except for the precipitation in Chembur and Dhaka (Khemani et al., 1994), where the dominance of Na+ and Cl− was attributed to the proximity of the ocean.
Comparison of the relative magnitude of ionic species with other sites
| Sites | Order of ionic species | Reference |
|---|---|---|
| Karachi, Pakistan | HCO3− > Cl− > Ca2+ > K+ > Mg2+ > Na+ > NH4+ | This study |
| Roorkee, India | Ca2+ > HCO3− > Cl− >Na+ >Mg2+ > K | Hameed et al., 2006 |
| Agra, India | Ca2+ > Cl− > Na+ > HCO3− > K+ > Mg2+ | Satsangi et al.,1998 |
| Hyderabad, India | Ca2+ > Cl−> Na+ > HCO3− > K+ > Mg2+ | Kulshrestha et al., 2003 |
| Chembur, India | Na+ > Cl− > Ca2+ > Mg2+ > K+ | Khemani et al., 1994 |
| Dhaka, Bangladesh | Na+, > Ca2+ > K+ > Mg2+ > Cl− | Hadi et al., 1999 |
| Riadh, Saudi Arabia | Ca2+ > Cl− >Na+ >HCO3− >K+ > Mg2+ | Alabdula’aly et al., 2000 |
| Monterrey, Mexico | Ca2+ > Na+ > Mg2+ > NH4+ > K+ > Cl− | Ramírez et al., 2010 |
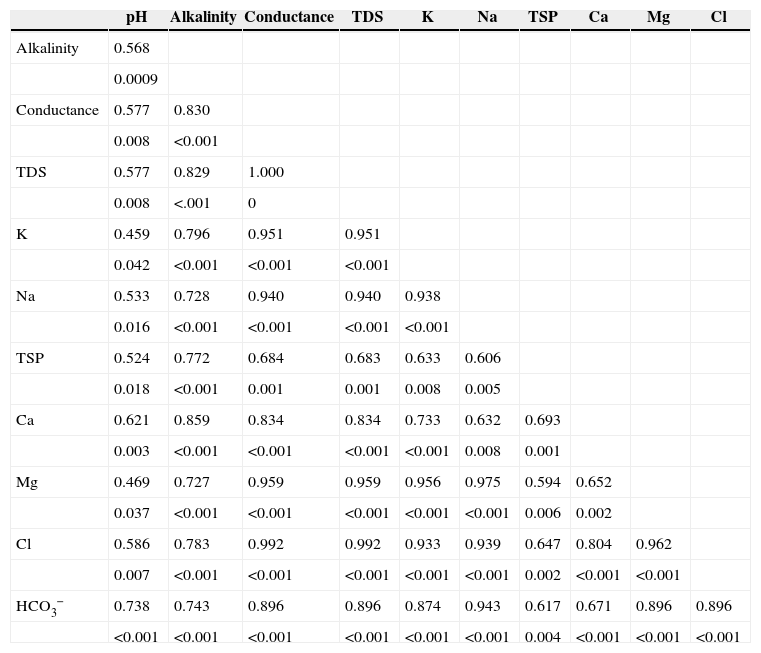
An excellent correlation was observed between TDS and Cl− with the determination coefficient r2=0.992, and p<0.001. Strong correlations of TDS were also observed with K (r2=0.951, p<0.001), Na (r2=0.940, p<0.001), Ca (r2=0.834, p<0.001) and Mg (r2 = 0.959, p<0.001) (Table V). This results indicate that rainwater mainly dissolves the chlorides of Na, K, Ca and Mg. A relatively weak correlation was observed between TSP and K (r2 = 0.633), Na (r2 = 0.606), Ca (r2 = 0.693) and Mg (r2 = 0.594), showing the possible presence of other particulate matters (dust, smoke, soot, etc.) in the atmospheric air. Alkalinity is strongly correlated with all parameters due to the high loading of particulate matter in the atmosphere, either in dissolved or suspended form. Inter-metal correlations were also estimated between K-Na (0.938), K-Mg (0.956), and Na-Mg (0.975).
Correlations matrix between different studied parameters (p-value is shown below the Pearson correlation coefficient value).
| pH | Alkalinity | Conductance | TDS | K | Na | TSP | Ca | Mg | Cl | |
|---|---|---|---|---|---|---|---|---|---|---|
| Alkalinity | 0.568 | |||||||||
| 0.0009 | ||||||||||
| Conductance | 0.577 | 0.830 | ||||||||
| 0.008 | <0.001 | |||||||||
| TDS | 0.577 | 0.829 | 1.000 | |||||||
| 0.008 | <.001 | 0 | ||||||||
| K | 0.459 | 0.796 | 0.951 | 0.951 | ||||||
| 0.042 | <0.001 | <0.001 | <0.001 | |||||||
| Na | 0.533 | 0.728 | 0.940 | 0.940 | 0.938 | |||||
| 0.016 | <0.001 | <0.001 | <0.001 | <0.001 | ||||||
| TSP | 0.524 | 0.772 | 0.684 | 0.683 | 0.633 | 0.606 | ||||
| 0.018 | <0.001 | 0.001 | 0.001 | 0.008 | 0.005 | |||||
| Ca | 0.621 | 0.859 | 0.834 | 0.834 | 0.733 | 0.632 | 0.693 | |||
| 0.003 | <0.001 | <0.001 | <0.001 | <0.001 | 0.008 | 0.001 | ||||
| Mg | 0.469 | 0.727 | 0.959 | 0.959 | 0.956 | 0.975 | 0.594 | 0.652 | ||
| 0.037 | <0.001 | <0.001 | <0.001 | <0.001 | <0.001 | 0.006 | 0.002 | |||
| Cl | 0.586 | 0.783 | 0.992 | 0.992 | 0.933 | 0.939 | 0.647 | 0.804 | 0.962 | |
| 0.007 | <0.001 | <0.001 | <0.001 | <0.001 | <0.001 | 0.002 | <0.001 | <0.001 | ||
| HCO3− | 0.738 | 0.743 | 0.896 | 0.896 | 0.874 | 0.943 | 0.617 | 0.671 | 0.896 | 0.896 |
| <0.001 | <0.001 | <0.001 | <0.001 | <0.001 | <0.001 | 0.004 | <0.001 | <0.001 | <0.001 |
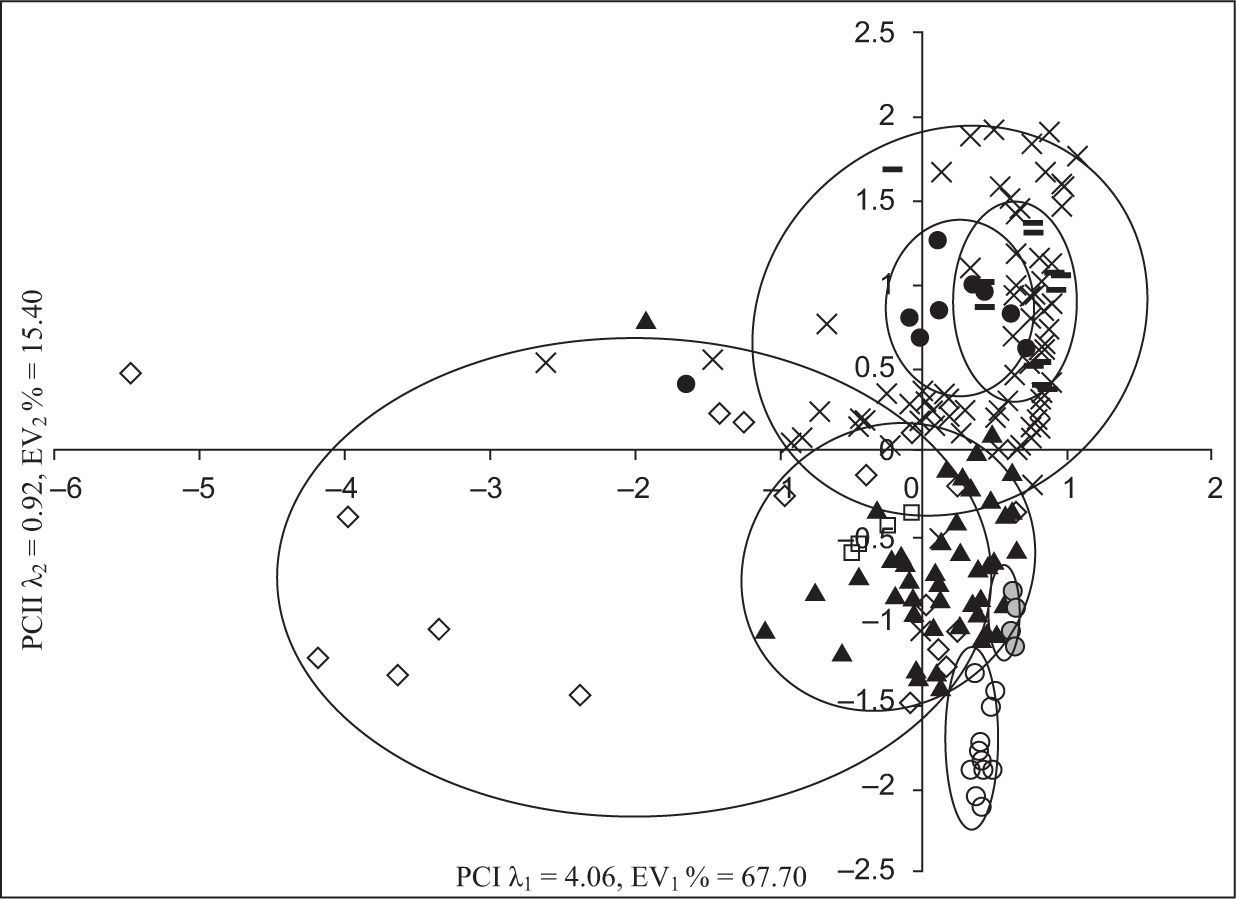
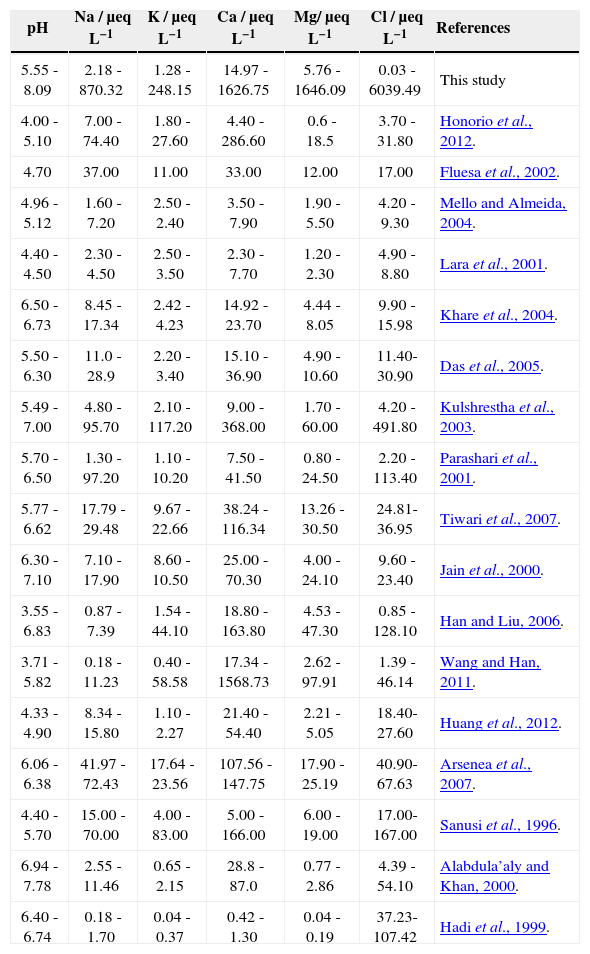
A principal component analysis (PCA) was applied to the chemical composition of studied samples and of those reported in some other regions of the world (Fig. 4). Table VI shows the values of the parameters on which the PCA was applied.
, ▲ India, □ Romania, ○ Saudi Arabia, — Brazil, × China, ● France, Bangladesh")
Parameters (from this study and reported for other regions of the world) on which principal component analysis was applied.
| pH | Na / μeq L−1 | K / μeq L−1 | Ca / μeq L−1 | Mg/ μeq L−1 | Cl / μeq L−1 | References |
|---|---|---|---|---|---|---|
| 5.55 - 8.09 | 2.18 - 870.32 | 1.28 - 248.15 | 14.97 -1626.75 | 5.76 - 1646.09 | 0.03 - 6039.49 | This study |
| 4.00 - 5.10 | 7.00 - 74.40 | 1.80 - 27.60 | 4.40 - 286.60 | 0.6 - 18.5 | 3.70 - 31.80 | Honorio et al., 2012. |
| 4.70 | 37.00 | 11.00 | 33.00 | 12.00 | 17.00 | Fluesa et al., 2002. |
| 4.96 - 5.12 | 1.60 - 7.20 | 2.50 - 2.40 | 3.50 - 7.90 | 1.90 - 5.50 | 4.20 - 9.30 | Mello and Almeida, 2004. |
| 4.40 - 4.50 | 2.30 - 4.50 | 2.50 - 3.50 | 2.30 - 7.70 | 1.20 - 2.30 | 4.90 - 8.80 | Lara et al., 2001. |
| 6.50 - 6.73 | 8.45 - 17.34 | 2.42 - 4.23 | 14.92 - 23.70 | 4.44 - 8.05 | 9.90 - 15.98 | Khare et al., 2004. |
| 5.50 - 6.30 | 11.0 - 28.9 | 2.20 - 3.40 | 15.10 - 36.90 | 4.90 - 10.60 | 11.40- 30.90 | Das et al., 2005. |
| 5.49 - 7.00 | 4.80 - 95.70 | 2.10 - 117.20 | 9.00 - 368.00 | 1.70 - 60.00 | 4.20 - 491.80 | Kulshrestha et al., 2003. |
| 5.70 - 6.50 | 1.30 - 97.20 | 1.10 - 10.20 | 7.50 - 41.50 | 0.80 - 24.50 | 2.20 - 113.40 | Parashari et al., 2001. |
| 5.77 - 6.62 | 17.79 - 29.48 | 9.67 - 22.66 | 38.24 - 116.34 | 13.26 - 30.50 | 24.81- 36.95 | Tiwari et al., 2007. |
| 6.30 - 7.10 | 7.10 - 17.90 | 8.60 - 10.50 | 25.00 - 70.30 | 4.00 - 24.10 | 9.60 - 23.40 | Jain et al., 2000. |
| 3.55 - 6.83 | 0.87 - 7.39 | 1.54 - 44.10 | 18.80 - 163.80 | 4.53 - 47.30 | 0.85 - 128.10 | Han and Liu, 2006. |
| 3.71 - 5.82 | 0.18 - 11.23 | 0.40 - 58.58 | 17.34 -1568.73 | 2.62 - 97.91 | 1.39 - 46.14 | Wang and Han, 2011. |
| 4.33 - 4.90 | 8.34 - 15.80 | 1.10 - 2.27 | 21.40 - 54.40 | 2.21 - 5.05 | 18.40- 27.60 | Huang et al., 2012. |
| 6.06 - 6.38 | 41.97 - 72.43 | 17.64 - 23.56 | 107.56 -147.75 | 17.90 - 25.19 | 40.90- 67.63 | Arsenea et al., 2007. |
| 4.40 - 5.70 | 15.00 - 70.00 | 4.00 - 83.00 | 5.00 - 166.00 | 6.00 - 19.00 | 17.00- 167.00 | Sanusi et al., 1996. |
| 6.94 - 7.78 | 2.55 - 11.46 | 0.65 - 2.15 | 28.8 - 87.0 | 0.77 - 2.86 | 4.39 - 54.10 | Alabdula’aly and Khan, 2000. |
| 6.40 - 6.74 | 0.18 - 1.70 | 0.04 - 0.37 | 0.42 - 1.30 | 0.04 - 0.19 | 37.23- 107.42 | Hadi et al., 1999. |
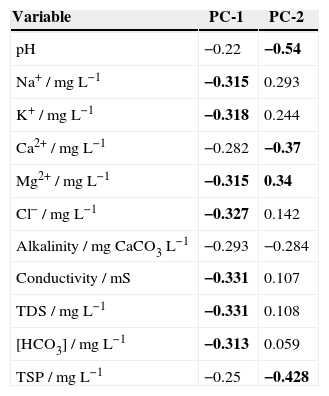
The numbers of significant principal components were selected on the basis of an eigenvalue > 1 (Kaiser, 1960). The first principal component (PC-1) explained 67.7% of the total variability, and was predominantly a function of Na+, K+, Mg2+, Cl−, conductivity, alkalinity, TDS and HCO3− (Table VII). The second component (PC-2) (15.40% of the variance) was a function of pH, alkalinity, Ca2+, Mg2+, and TSP.
Component matrix of compositional parameters (significant principal components are shown in bold characters).
| Variable | PC-1 | PC-2 |
|---|---|---|
| pH | −0.22 | −0.54 |
| Na+ / mg L−1 | −0.315 | 0.293 |
| K+ / mg L−1 | −0.318 | 0.244 |
| Ca2+ / mg L−1 | −0.282 | −0.37 |
| Mg2+ / mg L−1 | −0.315 | 0.34 |
| Cl− / mg L−1 | −0.327 | 0.142 |
| Alkalinity / mg CaCO3 L−1 | −0.293 | −0.284 |
| Conductivity / mS | −0.331 | 0.107 |
| TDS / mg L−1 | −0.331 | 0.108 |
| [HCO3] / mg L−1 | −0.313 | 0.059 |
| TSP / mg L−1 | −0.25 | −0.428 |
Samples of different regions of the world were grouped based on the chemical composition of rainwater (Fig. 4). The samples of different parts of China were similar in composition with each other and with samples from France and Brazil, also showing similarity in level and source of pollution.
The rain samples from Bangladesh matched with the precipitation samples from India. Some Pakistani samples (except those of highly polluted gales) also matched with data of India due to the same geological and climatic conditions.
Scattered separation is due to the variation in parameters during the same monsoon season. Saudi Arabia is grouped separately, showing a climatic difference as a result of different sources of pollution. Therefore, it is concluded that PCA is a good statistical tool for the source identification and level of air pollution in rainwater samples.
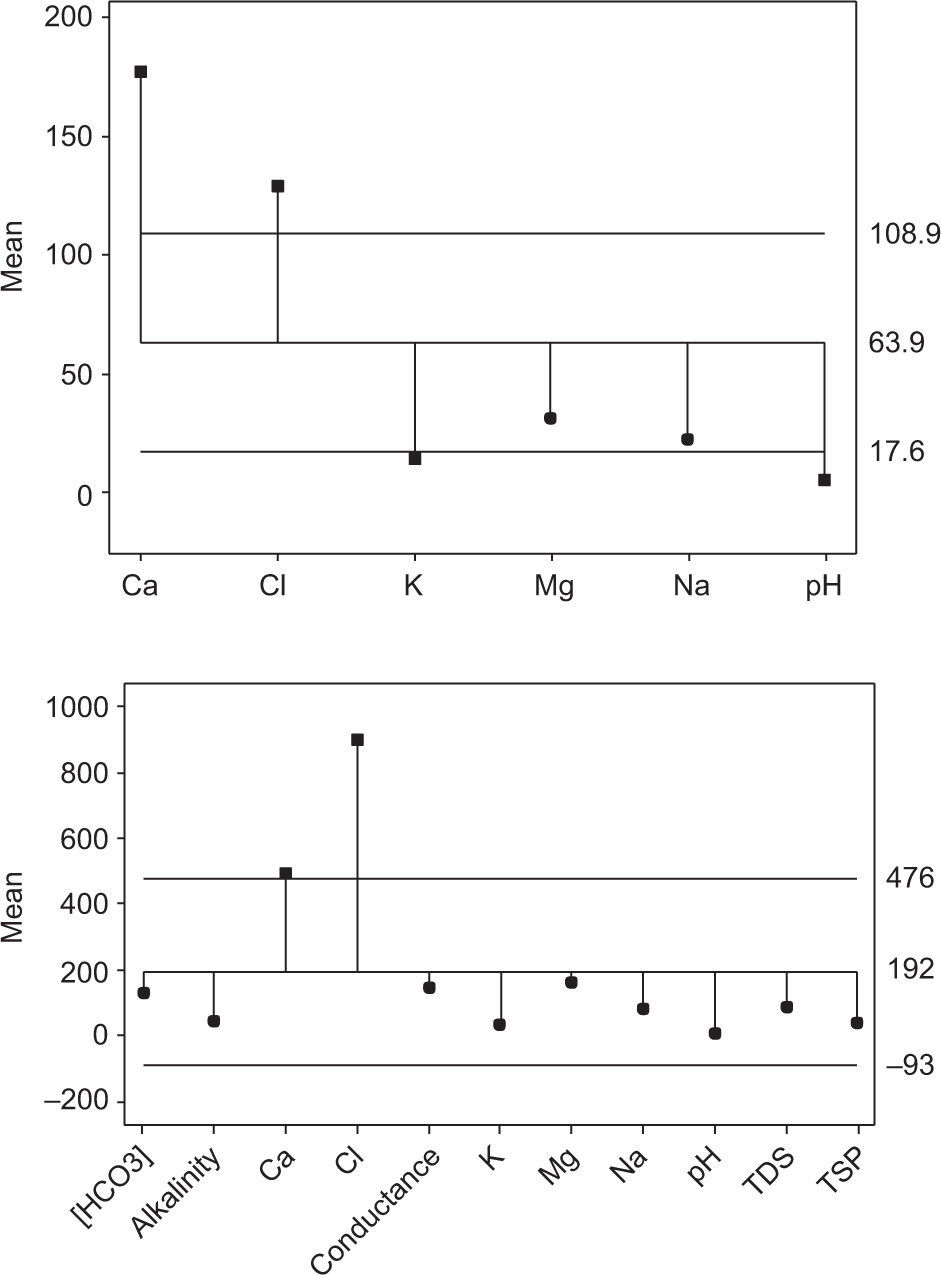
One-way normal analysis of means (ANOM) was applied to the data reported for this study and other regions of the world (Table VI). The patterns of Figures 5a and b are closely similar, showing that Ca2+ and Cl− are the most significant discriminating parameters accountable for variations in level and source of pollution (from natural or anthropogenic origin). No significant variation (p < 0.05) was observed in other properties of rain samples.
4Conclusions applied on (a) data of other arid and tropical regions of the world, and (b) the present study.")
The observed average of rainwater pH was 5.81 and 7.16 for UR and BZ samples, respectively. No acidic rain event was detected, which denotes limited influence of industrial activities. The high amounts of Ca2+ and TSP in BZ samples shows the dominancy of particulate matters of alkaline nature, like dust particles. Higher concentrations of pollutants in the first gale suggested that the dry season scavenges most of the pollutants from the atmosphere. Based on the results of the present study, it can be said that rainwater is safe for drinking, as none of the samples exceeded the maximum contaminant limits for drinking water. The Pakistan Environmental Protection Agency should enact laws for the proper handling of construction and demolition materials from open sites and promote initiatives for their strict implementation. The concerned authorities should monitor air pollution on a continuous basis considering rainwater as a potential indicator for environmental assessment.