


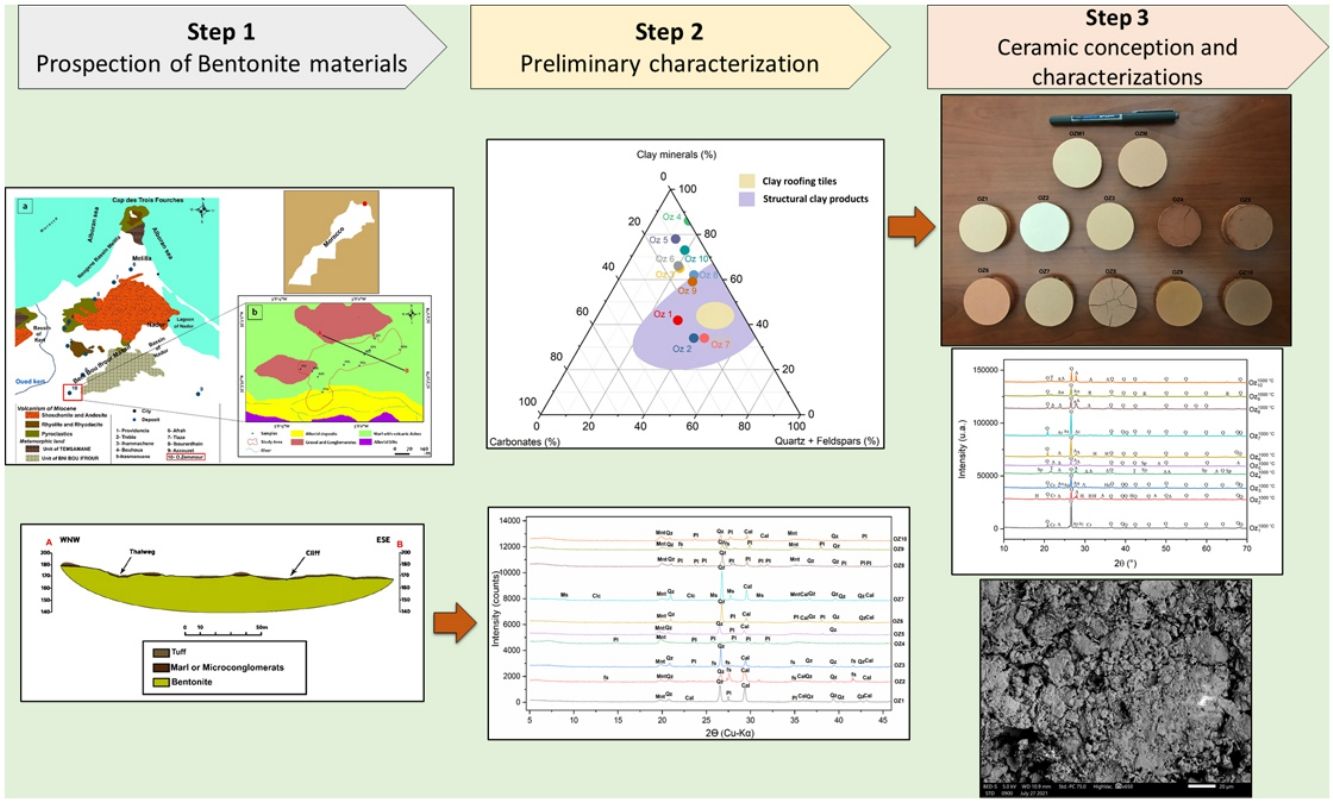

The Oued Zemmour deposit is associated to Neogene volcanism in the Kert basin, Nador area (Morocco), and thus one of the numerous bentonite occurrences in the Gourougou volcano's region. To assess their potential use, this article examines the Oued Zemmour bentonite deposit, helping with mineralogical, physicochemical, morphological, geotechnical analyses and ceramic performances. Mineralogical associations are essentially made of montmorillonite, K-feldspars and plagioclase, associated with lower quantities of calcite, dolomite and quartz. The main chemical composition in oxides is SiO2 and Al2O3. Geotechnical results show that the swelling index and Atterberg limits widely vary within the deposit, but all studied samples display high plastic and swelling qualities. The 10 representative bentonite samples of the area (Oz 1–Oz 10) were subjected to a ceramic technological assessment, and all samples have displayed good quality after dry pressing method and sintering at 1000°C without any defect or cracks (except for Oz 4, Oz 5, and Oz 8 samples). Therefore, two mixtures (Oz M and Oz M1) have been developed from the samples studied, using the same manufacturing protocol. The obtained ceramics were evaluated by studying their morphological structure and macroscopic aspect, as well as their bulk density, porosity, water absorption, shrinkage and tensile strength properties.
El depósito de Oued Zemmour está asociado al vulcanismo neógeno de la cuenca de Kert, en la zona de Nador (Marruecos), y es por tanto uno de los numerosos yacimientos de bentonita de la región del volcán Gourougou. Para evaluar su potencial de uso, este artículo examina el yacimiento de bentonita de Oued Zemmour, ayudándose de análisis mineralógicos, fisicoquímicos, morfológicos, geotécnicos y rendimientos cerámicos. Las asociaciones mineralógicas están constituidas esencialmente por montmorillonita, feldespatos-K y plagioclasa, asociados a cantidades menores de calcita, dolomita y cuarzo. La composición química principal en óxidos es SiO2 y Al2O3. Los resultados geotécnicos muestran que el índice de hinchamiento y los límites de Atterberg varían ampliamente dentro del yacimiento, pero todas las muestras estudiadas presentan altas cualidades plásticas y de hinchamiento. Las 10 muestras de bentonita representativas de la zona (Oz 1 - Oz 10) fueron sometidas a una evaluación tecnológica cerámica, y todas las muestras han mostrado una buena calidad tras el método de prensado en seco y la sinterización a 1000°C sin ningún defecto o grieta (excepto las muestras Oz 4, Oz 5 y Oz 8). Por lo tanto, se han desarrollado dos mezclas (Oz M y Oz M1) a partir de las muestras estudiadas, mediante el mismo protocolo de fabricación. Las cerámicas obtenidas se evaluaron mediante el estudio de su estructura morfológica y de su aspecto macroscópico, así como de sus propiedades de densidad aparente, porosidad, absorción de agua, contracción y resistencia a la tracción.

Through the years, clays, especially that of the smectites’ family, have been used in many industrial sectors (pharmacy, cosmetic, chemistry, civil engineering, etc.) [1–4]. Large tonnages of clay materials are used in the ceramic industry, like common bricks, building bricks, refractory products, pottery products, sandstones, sanitary articles and tiles [5–9].
Morocco is one of the largest producers and consumers of clay building materials (with a national production of approximately 45% for building materials) [10,11]. Especially the Rif area (Northern Morocco) is mostly filled with clays of the Neogene period [11–16]. Bentonites are part of these clays [17]. They are characterized by their geological formation mode, their chemical and mineralogical composition, their size distribution, their swelling and absorption rate, and their geotechnical and textural properties [18]. Thus, the knowledge and understanding of these physicochemical and geotechnical properties are important to target the most appropriate application [19].
Clay materials are used in the manufacturing process of ceramics. Ceramics is often a component of complex natural mixtures of minerals, whose grain size and physicochemical properties widely vary [20–24]. The finished ceramic product quality generally depends on several factors, which are mostly related to the nature of raw materials used and to their behavior during the different steps of the ceramic products manufacturing process.
The manufacturing principle of ceramic is based on the capacity of clay to form with water, in relevant proportions, a paste plastic enough to be modeled and fired in order to get hard and audible finished products with no deformation. Plastic raw materials, which strongly increase their volume in contact with water (clays and marls), generally of varied chemical and mineralogical natures, are used in fired clay in Morocco [25]. In this respect, several works have been carried out in the last few years to valorize clay and non-clay materials in the field of ceramics by dry pressing method and fast-firing. According to the obtained technological characteristics, the fired bodies could be used in the lining of industrial furnaces through their heat-resistant properties, or ceramic membranes for filtration of wastewater by their porous structures and chemical resistances, or also in building as construction materials due to their mechanical strength, etc. [4,10,26–35].
The main objective of this work is to characterize and value smectite clays from the Oued Zemmour deposit via mineralogical, physicochemical, morphological and lithological analyses to assess their production and treatment potential. The representative samples of the site will be investigated for a ceramic application and evaluated in terms of technological, mineralogical and morphological properties. Furthermore, developed mixtures from these samples will be selected to improve the quality of the obtained products.
Regional geological frameworkAfter tectonic, metamorphic and magmatic events, several sedimentary basins, generally of Mediterranean obedience, were formed in the Neogene period. The filling age of these sedimentary basins varies from one basin to another. Their individualization is the result of isostatic resetting caused by tables’ implementation and the still valid rapprochement of African and European continental plates, expressing in the form of an unhooking compression regime [36,37]. Indeed, all the Moroccan North-East region has been subject to intense seismic activity during Neogene and quaternary periods [38–41]. First events are explosive and underwater and progressively become aerial and effusive [42,43]. During the Messinian era, the South-East of Spain, North Morocco and Algeria formed a patchwork of basins separated by islands where lava, pyroclastic flows and ashes were deposited [44]. These basins isolated several types of coastal habitats: marine, lagoon or fluvio-lacustrine environments. In various places, pyroclastic flows and ashes have been changed in bentonite deposits. Kert's Neogene basin achieved a full sedimentary cycle reflecting an open environment, with normal salinity showing lateral intercalations of proximal volcanic products between marine marly facies. The first facies deposited in the Messinian basin are calcareous marls, sometimes interrupted by the arrival of pyrolytes or pyroclastic material coming from Gourougou's volcanism and its satellites [42,45].
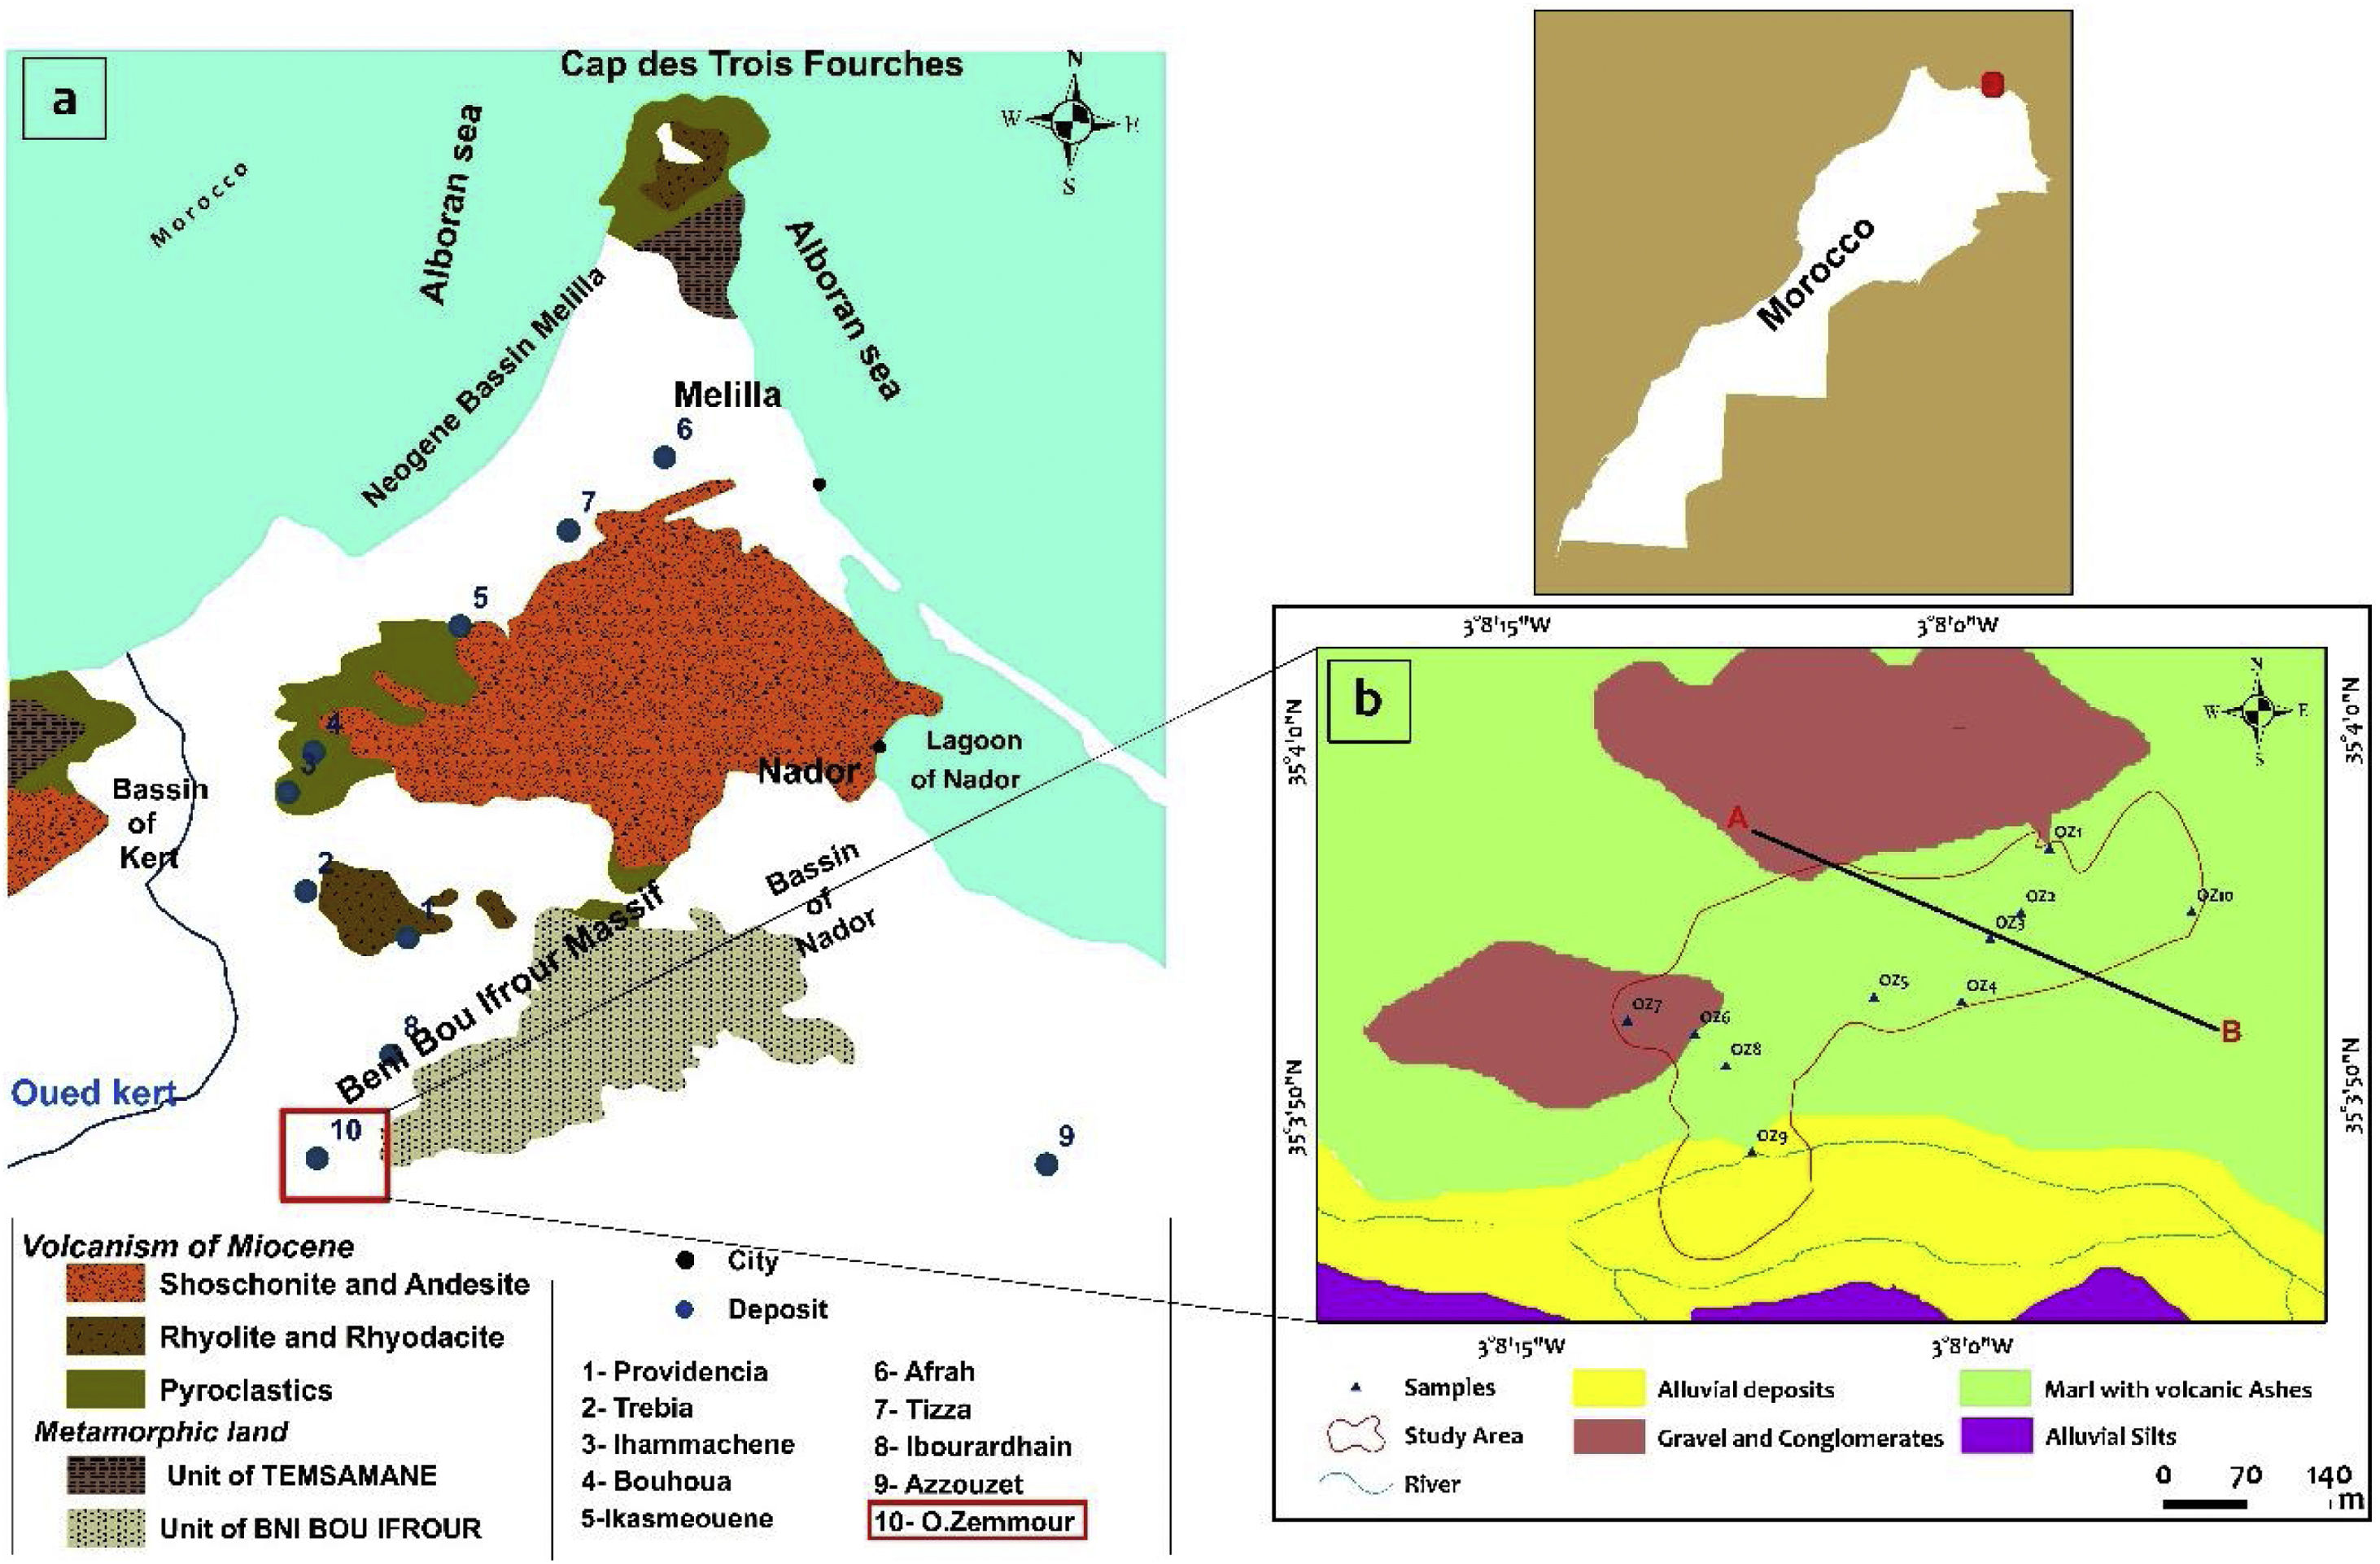
Bentonite deposits known in the Western Rif region are closely linked to volcanic structures of Melilla-Kert basins (Fig. 1) and are contained in marine sedimentary series of these Neogene basins or in “pouches”, on the volcanos’ periphery [46]. These deposits are the result of the alteration of volcanic ashes and pyroclastic breaches [47].
 Index map showing the geology and location of the main bentonite deposits in the Nador region (ONHYM, 2005). (b) Geological map extracted from the geological map of Zghenghen at 1/50,000 (modified) (Ministère de l’Energie et des Mines Direction de la Géologie Editions du Service Géologique du Maroc, Notes et Mémoires N°370 map published in 1996).")
(a) Index map showing the geology and location of the main bentonite deposits in the Nador region (ONHYM, 2005). (b) Geological map extracted from the geological map of Zghenghen at 1/50,000 (modified) (Ministère de l’Energie et des Mines Direction de la Géologie Editions du Service Géologique du Maroc, Notes et Mémoires N°370 map published in 1996).
The bentonite sampling has been done through the Oued Zemmour lodge (Fig. 1b). 10 bentonite samples have been collected from the surface of the bentonite layers located under tuff, Miocene blackish marls, and microconglomerates. According to geological field observations, these bentonite strata show slightly varying thicknesses averaging 13m. Realized surveys crossed through several tuff levels more or less bentonitized, alternatively with ash layers and the two bentonite layers observed on the surface.
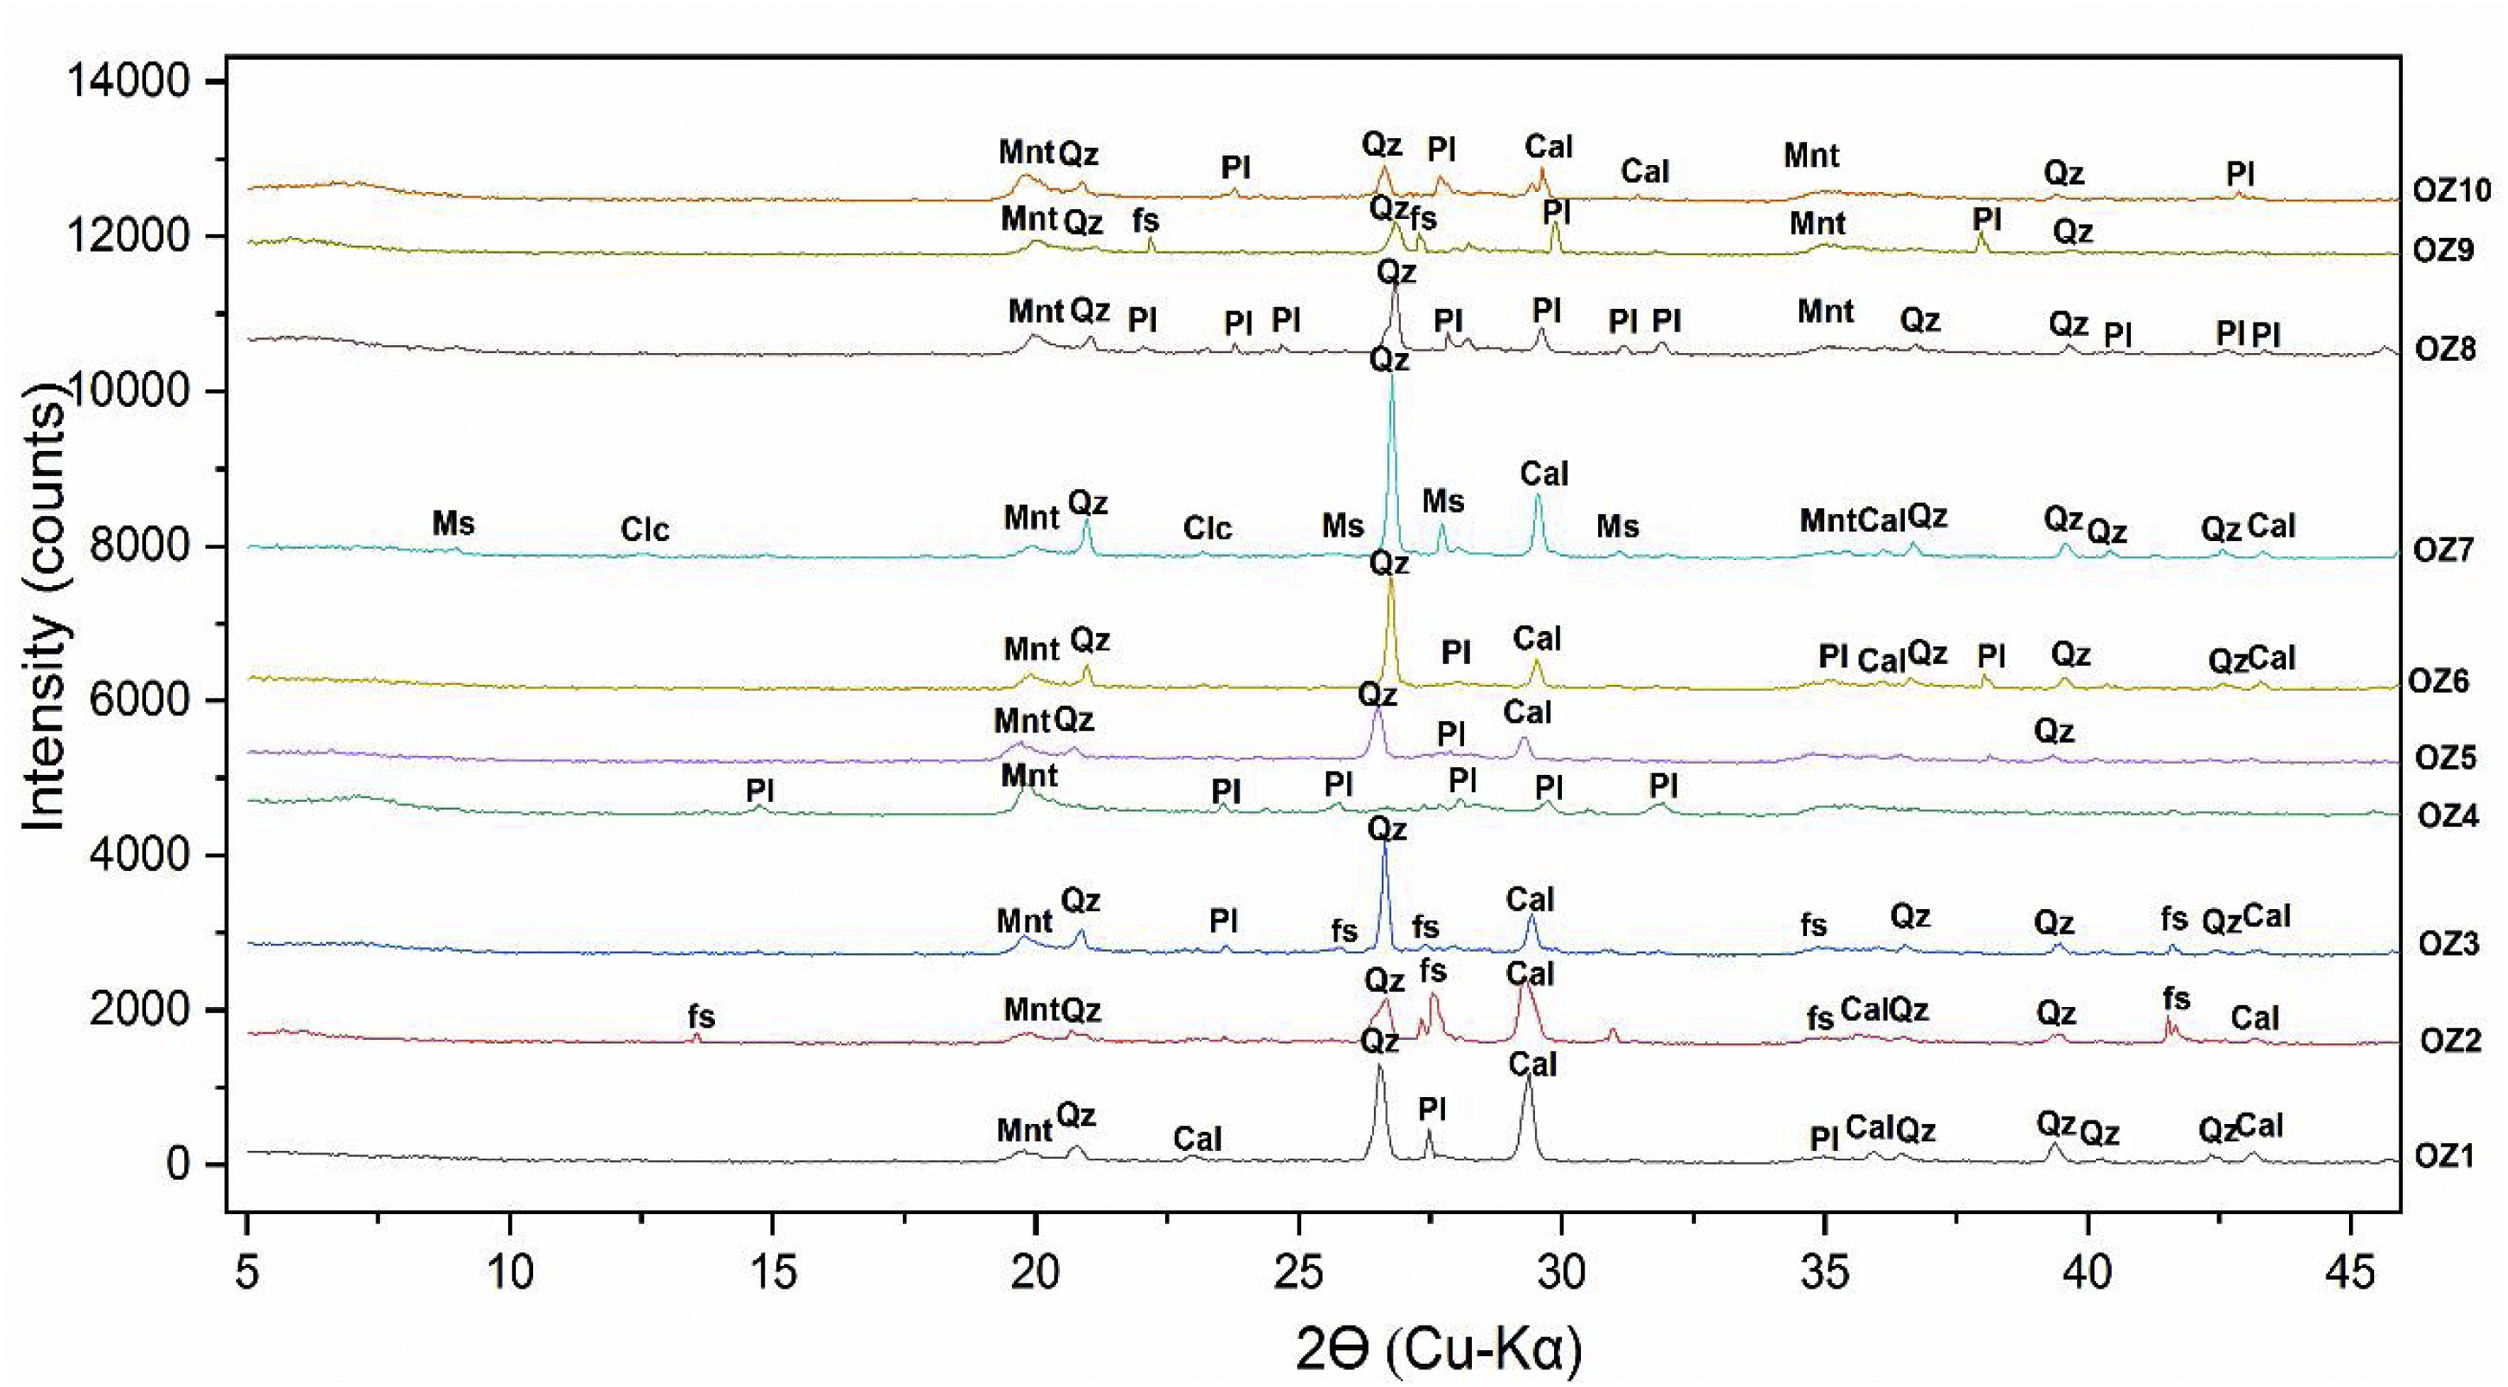
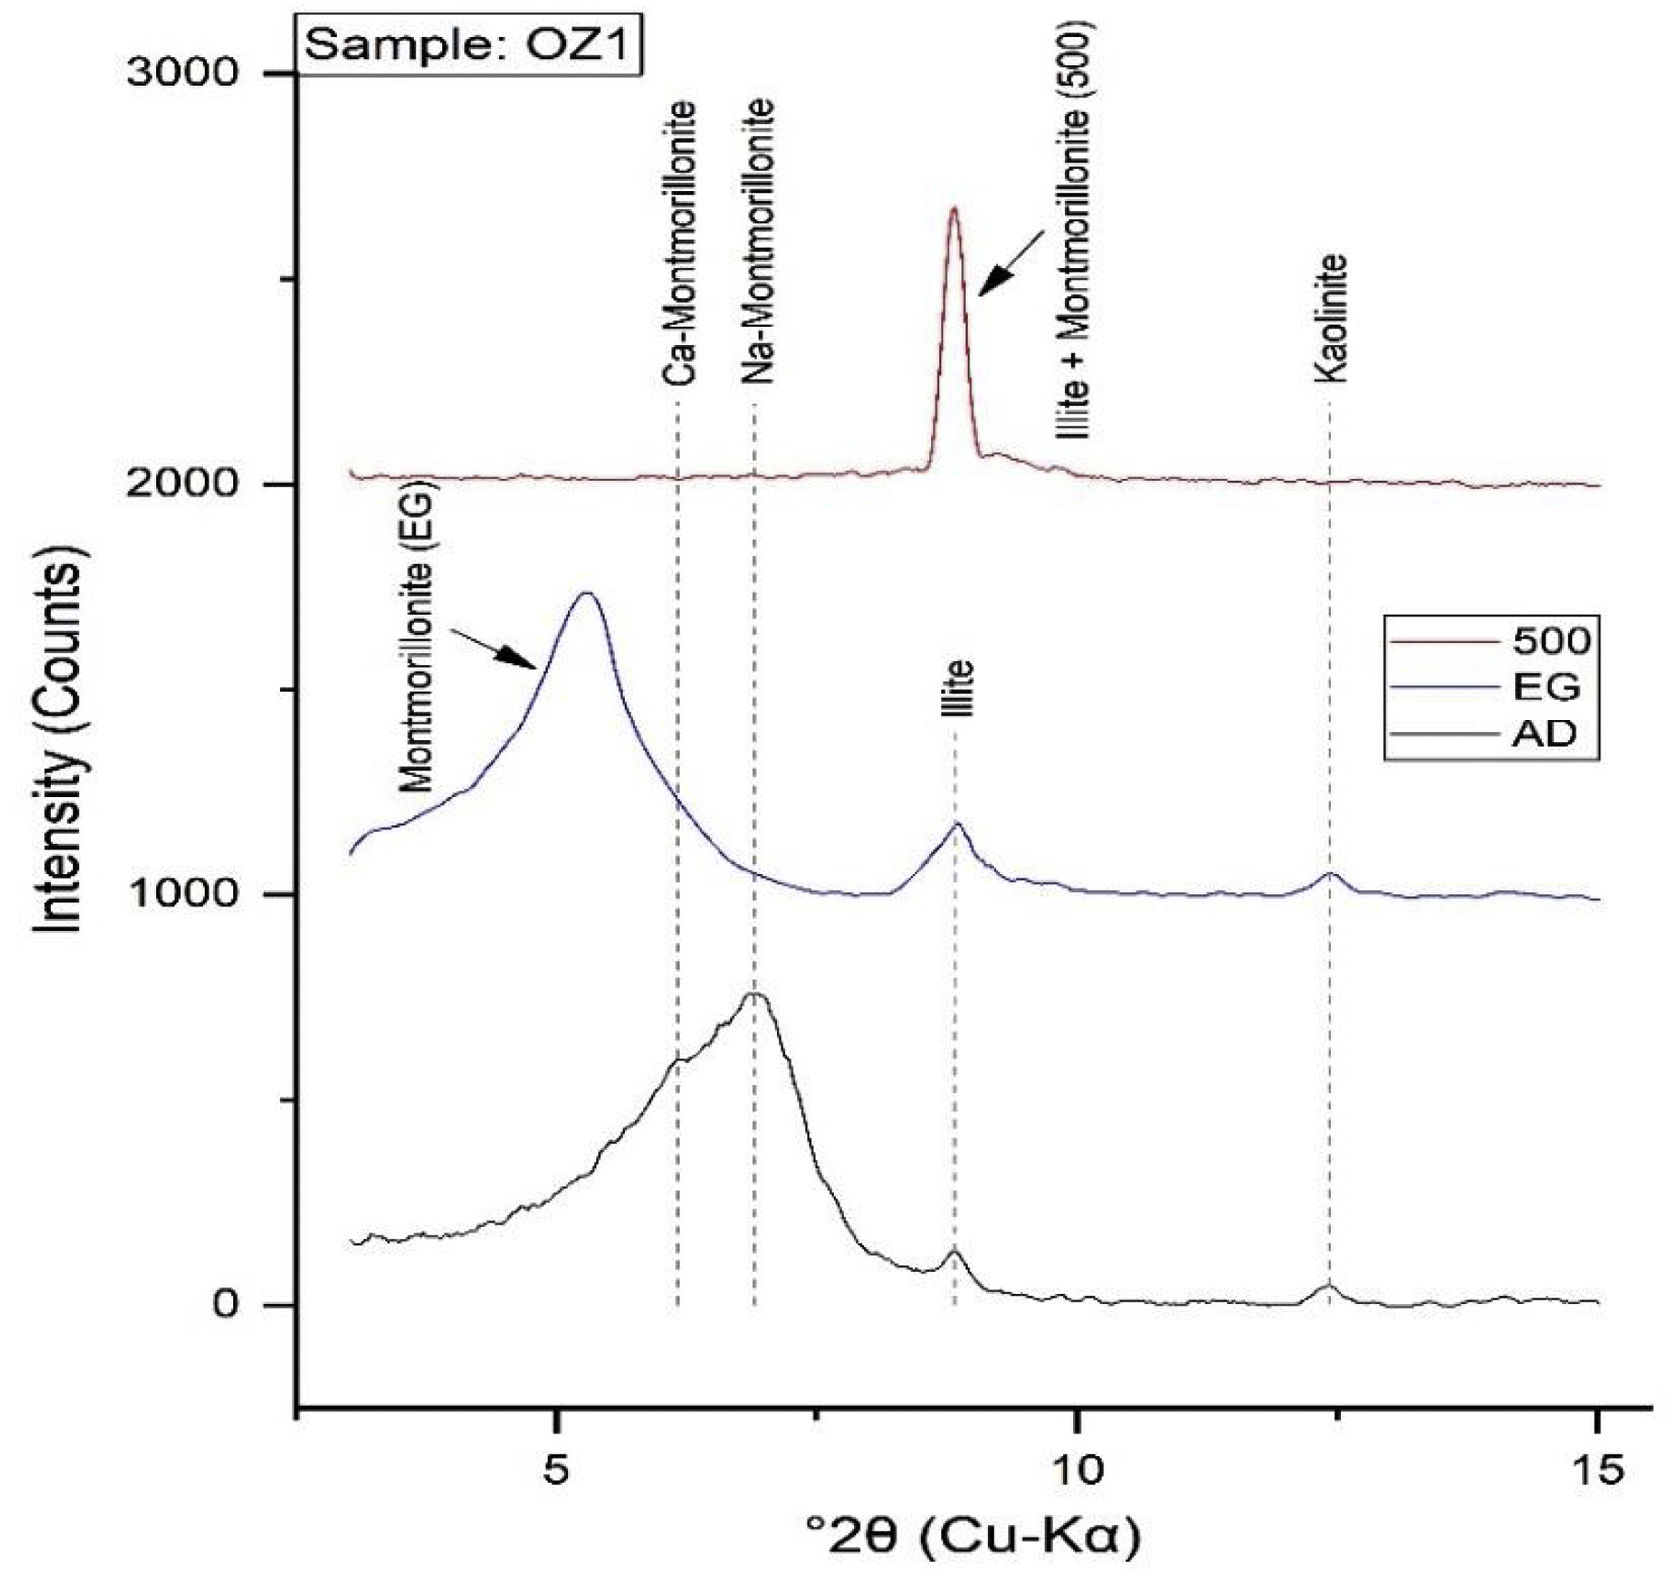
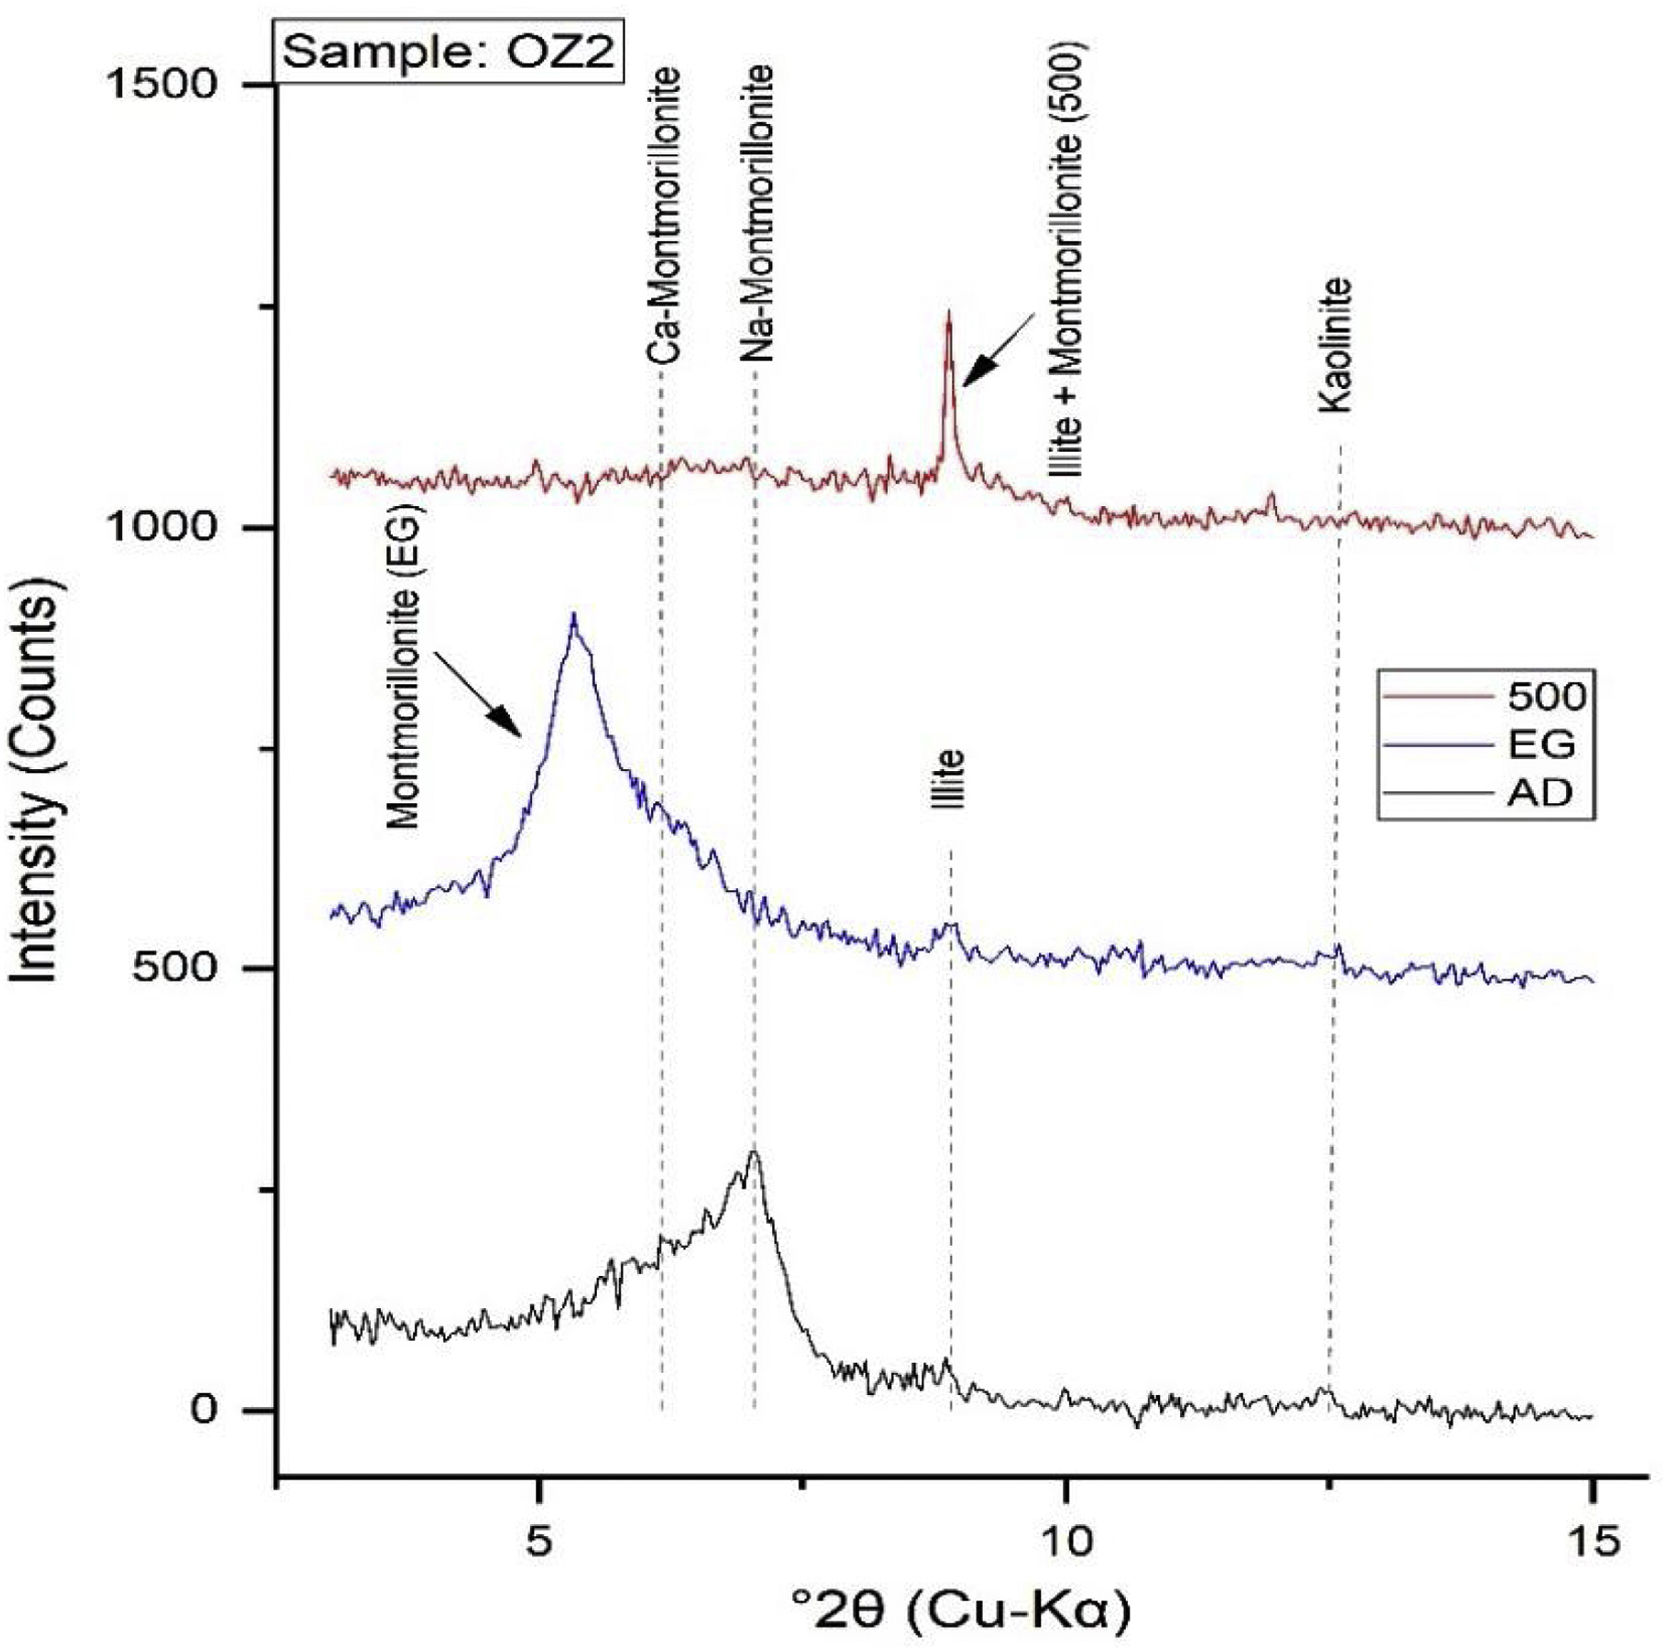
Mineralogical and chemical analysisThe mineralogical analysis has been achieved by using an XPERT-PRO diffractometer with Cu-Kα (λ=1.5418Å) radiation, under operating conditions of 40kV and 30mA, to identify the mineralogical phases of raw clay samples at RUMINEX Marrakech – Morocco (Fig. 2). XRD patterns on the <50μm fraction were recorded between 2° and 70° using a 0.02° step scan and 3s of step time. Additional XRD measurements were made on oriented aggregates [48] and data was recorded between 2° and 20° (2θ) using a 0.024° step scan and a step of 0.6s. These oriented aggregates underwent three successive treatments: air drying, glycolation and heating at 500°C for 4h to confirm the type of clay mineral phases before their bombardment with X-rays. The Greene-Kelley test modified by [49] has been used to distinguish between deficiencies in charge of the octahedral and tetrahedral negative layer in smectites. The test consists in saturating the clay fractions <2μm with a solution of 2M LiCl overnight. The Li-exchanged fractions were then rinsed with deionized water and oriented aggregates were prepared on glass slides. The XRD analyzes on the oriented clay fractions were carried out on the slide dried in air (N), heated to 300°C (H300, 2h) and finally the solvated glycerol (Gl) overnight. A reflection spacing d (001) of 9.6 to 10Å, is indicative of montmorillonite (octahedral negative layer charge), while a spacing of 16.7–17.7Å indicates beidellite (tetrahedral charge of the layer negative) (Figs. 3 and 4).

.")
.")
To limit any preferential orientation [50–52], full rocks powders are slowly pressed in sample holders. Full rocks have been prepared by crushing around 1g of dried bentonites, helping with a mortar. XRD diffractogram analysis has been achieved by using the X’Pert HighScore Plus software and the PDF-2 database. The semi-quantitative analysis of mineralogical phases was derived by multiplying the measured intensity of the specific reflection by specific correction factors for each mineral [50,51,53].
Chemical analyses have been achieved within the National Office of Hydrocarbons and Mines (ONHYM) in Rabat-Morocco. X-ray fluorescence spectrometry (XRF) has been used to analyze the major components. Samples’ powders have been well mixed with lithium borate (Li2B4O7), and then poured in a pastille, which will be pressed to get the form of a flattened pearl. Achieved results were given in percent of the mass of oxides. Samples were heated at 1000°C for 2h under oxidative conditions in order to get the Loss on Ignition (L.O.I).
Microstructural analysis was performed using scanning electron microscopy coupled with energy dispersive spectroscopy (SEM-EDS) to study the morphology, texture and composition of bentonite samples and the prepared ceramic bodies. The observations were made using scanning electron microscope type Jeol JSM 5600 LV from the regional center of analysis and characterization of the Faculty of Science and Technology of Settat in Morocco (CRAC-FSTS). The samples were previously passed through a step of carbon metallization to increase the conductivity on their surfaces to allow the acquisition of images of good quality.
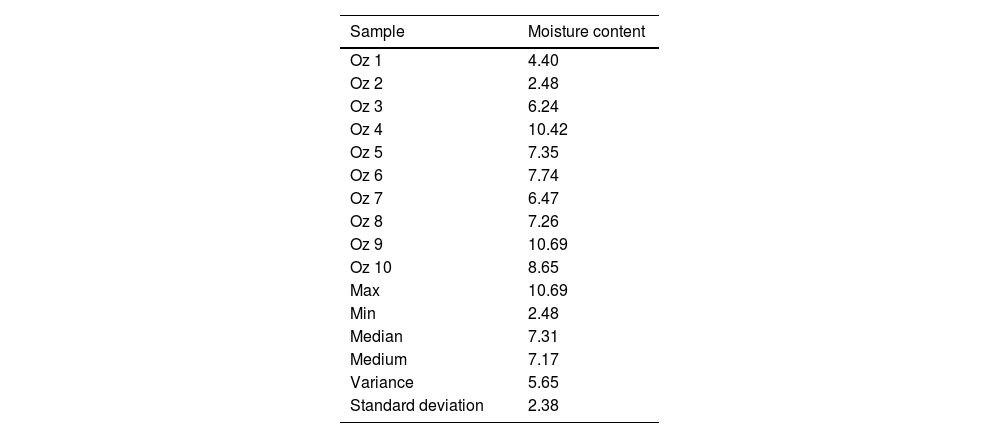
Secondly, the samples were previously prepared through a thermomechanical treatment and sieved to obtain a fine and dried powder less than 63μm. It should be noted that the sieving rejects of each sample were regrinded and sieved to an approximate rejection amount of 0. The initial moisture content of each sample (Table 1) was measured according to NF P 94-050 [54] by calculating the weight loss after drying the samples in an oven at 105°C for 24h using the following equation:
where W105 is the mass of the sample after drying at 105°C for 24h and Wi is its initial mass.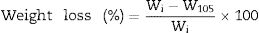
A mass of each prepared powder was then moistened to a limit of 4% and pressed into molds of 5cm×1.5cm (∅×h) using a hydraulic press of 30MPa. The compressed specimens were then dried at 105°C for 24h and heated in an electric furnace (Nabertherm GmbH, Germany). The firing program was set to a constant heating rate of 3°C/min with two main stages of 2h each (i.e., 600 and 1000°C). The sintered ceramics will be obtained after cooling down the furnace to room temperature.
Technological properties including water absorption, apparent density and porosity were measured according to the ASTM method [55]. Otherwise, shrinkage was studied into linear and volume form, this property was calculated using the following formula:
where X105 is the volume or diameter of the specimen after drying at 105°C and Xf is the volume or diameter of the specimen after firing at 1000°C [56]. Mechanical performance of ceramic bodies was measured with a diametric compressing test (Bresilien test) using 3R type: RP25 ATF apparatus. This kind of mechanical test is very important to specify the quality of obtained ceramics. It was carried out at room temperature and the ceramic was subjected to a uniaxial mechanical charge with a rate of 0.5mm/min until rupture [57]. It should be noted that all technological and mechanical measurements were tested on three specimens for each sample and the average values were taken.Physical, textural, and geotechnical analysis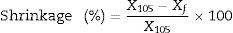
Physicochemical properties of the bentonite deposit (which generally represents calco-sodium bentonite) are improved with the use of sodium carbonate (lye) whose chemical formula is Na2CO3. This is lye that enables the substitution of Ca2+ cation by Na+. The bentonite is improved by going through this process to the extent that it becomes very blowing and absorbent.
To calculate the required percentage of Na2CO3 for a bentonite activation, the activation method with Na2CO3 has been used. In addition, the calculation of the lye percentage required to activate given bentonite, specific methods based on stoichiometric calculations of Ca and Mg reactions with Na2CO3 have been used [58].
The method of the Casagrande Cup NF P 94-051 [59] has been achieved at the Laboratory of Expertise Studies (L3E) in Essaouira to calculate Atterberg limits (liquid limit (LL)), plastic limit (PL) and plasticity index (PI).
The methylene blue quantity absorbed by the clay sample, according to the cation exchange capacity (CEC) was enabled to define the capacity of clay to adsorb cations of a solution, as well as the way this clay will react. Isomorphic substitutions in tetrahedral and octahedral sheets of the build-up of negative charges at the edges [60] caused the presence of permanent charges, and thanks to this last one, clay minerals are negatively charged.
The bentonite's cation exchange capacity (CEC), which represents the capacity of clay to retain cations to balance this negative charge, is determined by the hexamine cobalt method according to the NF X 31-130 French standard [61]. This modus operandi uses cobaltihexamine chloride. After having exchanged bentonite cations with Co (NH3)63+ ions, CEC estimates are based on the Co determination remaining in the solution. The CEC cation exchange capacity is made in the Waters, Soils and Plants Laboratory at the Mohamed V Polytechnical University.
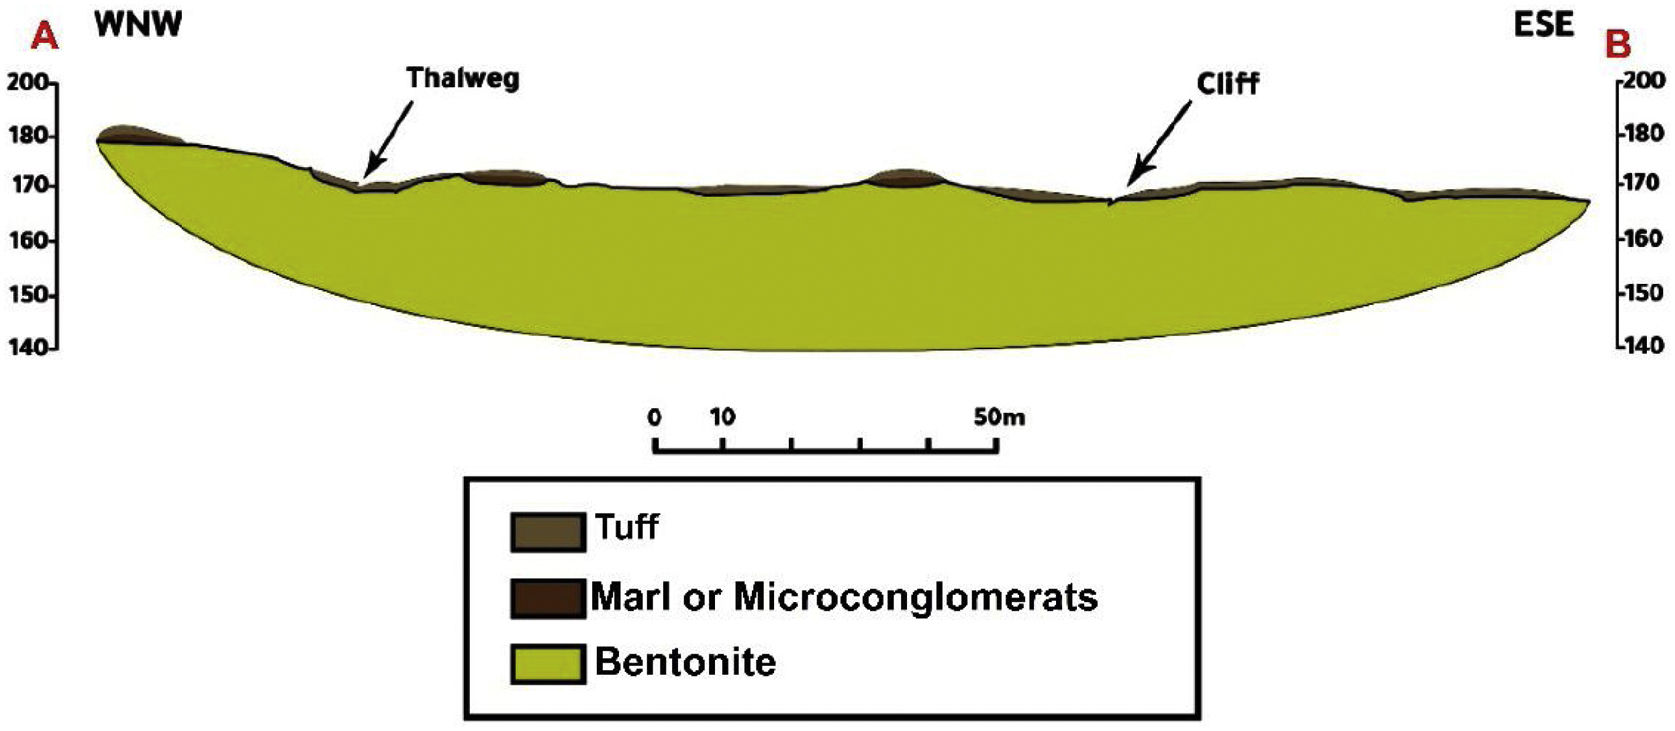
Section of the Oued Zemmour depositThe Oued Zemour bentonite deposit is located in the Kert basin (Fig. 1a). It is genetically related to Gourougou's volcanism of the Messinian age. This volcanism has a very complex geological structure [42,43]. Volcanic ashes recognized multiple petrographic facets, tuff and domes lava flows (Fig. 5).

The prospected sector in this survey is located from −3°7′52,016″ to −3°8′11,707″ in longitude and from 35°3′55,856″ to 35°3′52,463″ in latitude, on the Zghenghene's map sheet (1: 50,000), at 46km around north-west Nador. The access to the deposit is made through Nador-Ben Tayeb's asphalted road, then by following an 8km track leading to the Oued Zemour.
In order to identify and monitor the extent of the main geological units in the study area, a geological section was produced. The method used to produce the geological section includes the following steps respectively: determining of the boundaries of the area of interest. Drawing of an imaginary straight line (the cut line) through the entire area. Defining of the X and Y coordinates and the GPS elevation of all intersections of this line and the geological contests. Measuring of the thicknesses of the geological layers crossed if possible to calibrate the horizontal extension of the strata thicknesses. Drawing of the topographic profile using the data acquired by the GPS. Finally, drawing up the geological section, using the measurements taken of the thicknesses.
Indeed, the zone shows trachy-andesitic tuff and altered ash layers along 300m, following the E–W direction and by 30m wide according to the N–S direction. The bentonite is localized under tuff, Miocene blackish marls and microconglomerates. It is important to note that there are alternating levels of bentonitized thin facies and tuff just a little bentonitized (Fig. 5).
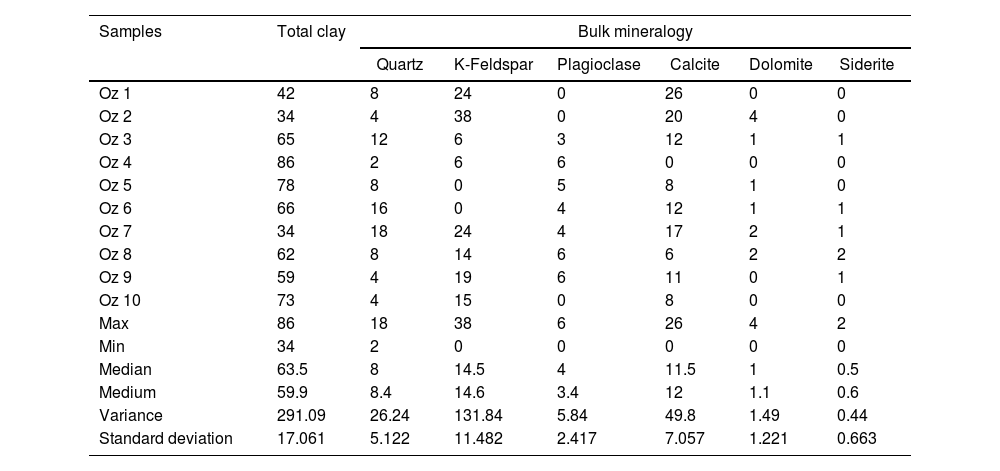
Results and discussionsMineralogical compositionThe mineralogical composition of the studied samples (Fig. 2) consists of quartz, calcite, montmorillonite and plagioclase (Table 2). Dolomite and siderite are occasionally present with low percentages.
Bulk mineralogy of the studied samples of the deposits of Oued Zemmour (%).
| Samples | Total clay | Bulk mineralogy | |||||
|---|---|---|---|---|---|---|---|
| Quartz | K-Feldspar | Plagioclase | Calcite | Dolomite | Siderite | ||
| Oz 1 | 42 | 8 | 24 | 0 | 26 | 0 | 0 |
| Oz 2 | 34 | 4 | 38 | 0 | 20 | 4 | 0 |
| Oz 3 | 65 | 12 | 6 | 3 | 12 | 1 | 1 |
| Oz 4 | 86 | 2 | 6 | 6 | 0 | 0 | 0 |
| Oz 5 | 78 | 8 | 0 | 5 | 8 | 1 | 0 |
| Oz 6 | 66 | 16 | 0 | 4 | 12 | 1 | 1 |
| Oz 7 | 34 | 18 | 24 | 4 | 17 | 2 | 1 |
| Oz 8 | 62 | 8 | 14 | 6 | 6 | 2 | 2 |
| Oz 9 | 59 | 4 | 19 | 6 | 11 | 0 | 1 |
| Oz 10 | 73 | 4 | 15 | 0 | 8 | 0 | 0 |
| Max | 86 | 18 | 38 | 6 | 26 | 4 | 2 |
| Min | 34 | 2 | 0 | 0 | 0 | 0 | 0 |
| Median | 63.5 | 8 | 14.5 | 4 | 11.5 | 1 | 0.5 |
| Medium | 59.9 | 8.4 | 14.6 | 3.4 | 12 | 1.1 | 0.6 |
| Variance | 291.09 | 26.24 | 131.84 | 5.84 | 49.8 | 1.49 | 0.44 |
| Standard deviation | 17.061 | 5.122 | 11.482 | 2.417 | 7.057 | 1.221 | 0.663 |
The studied bentonite samples show a similar mineralogical assemblage composed of quartz (Q) and feldspars (fs), along with calcite (Cal) and montmorillonite (Mnt) (except for Oz 4, Oz 8 and Oz 9), regardless of these samples’ localization. Mineral phases contents depend on the alteration degree and the source rock's nature [47].
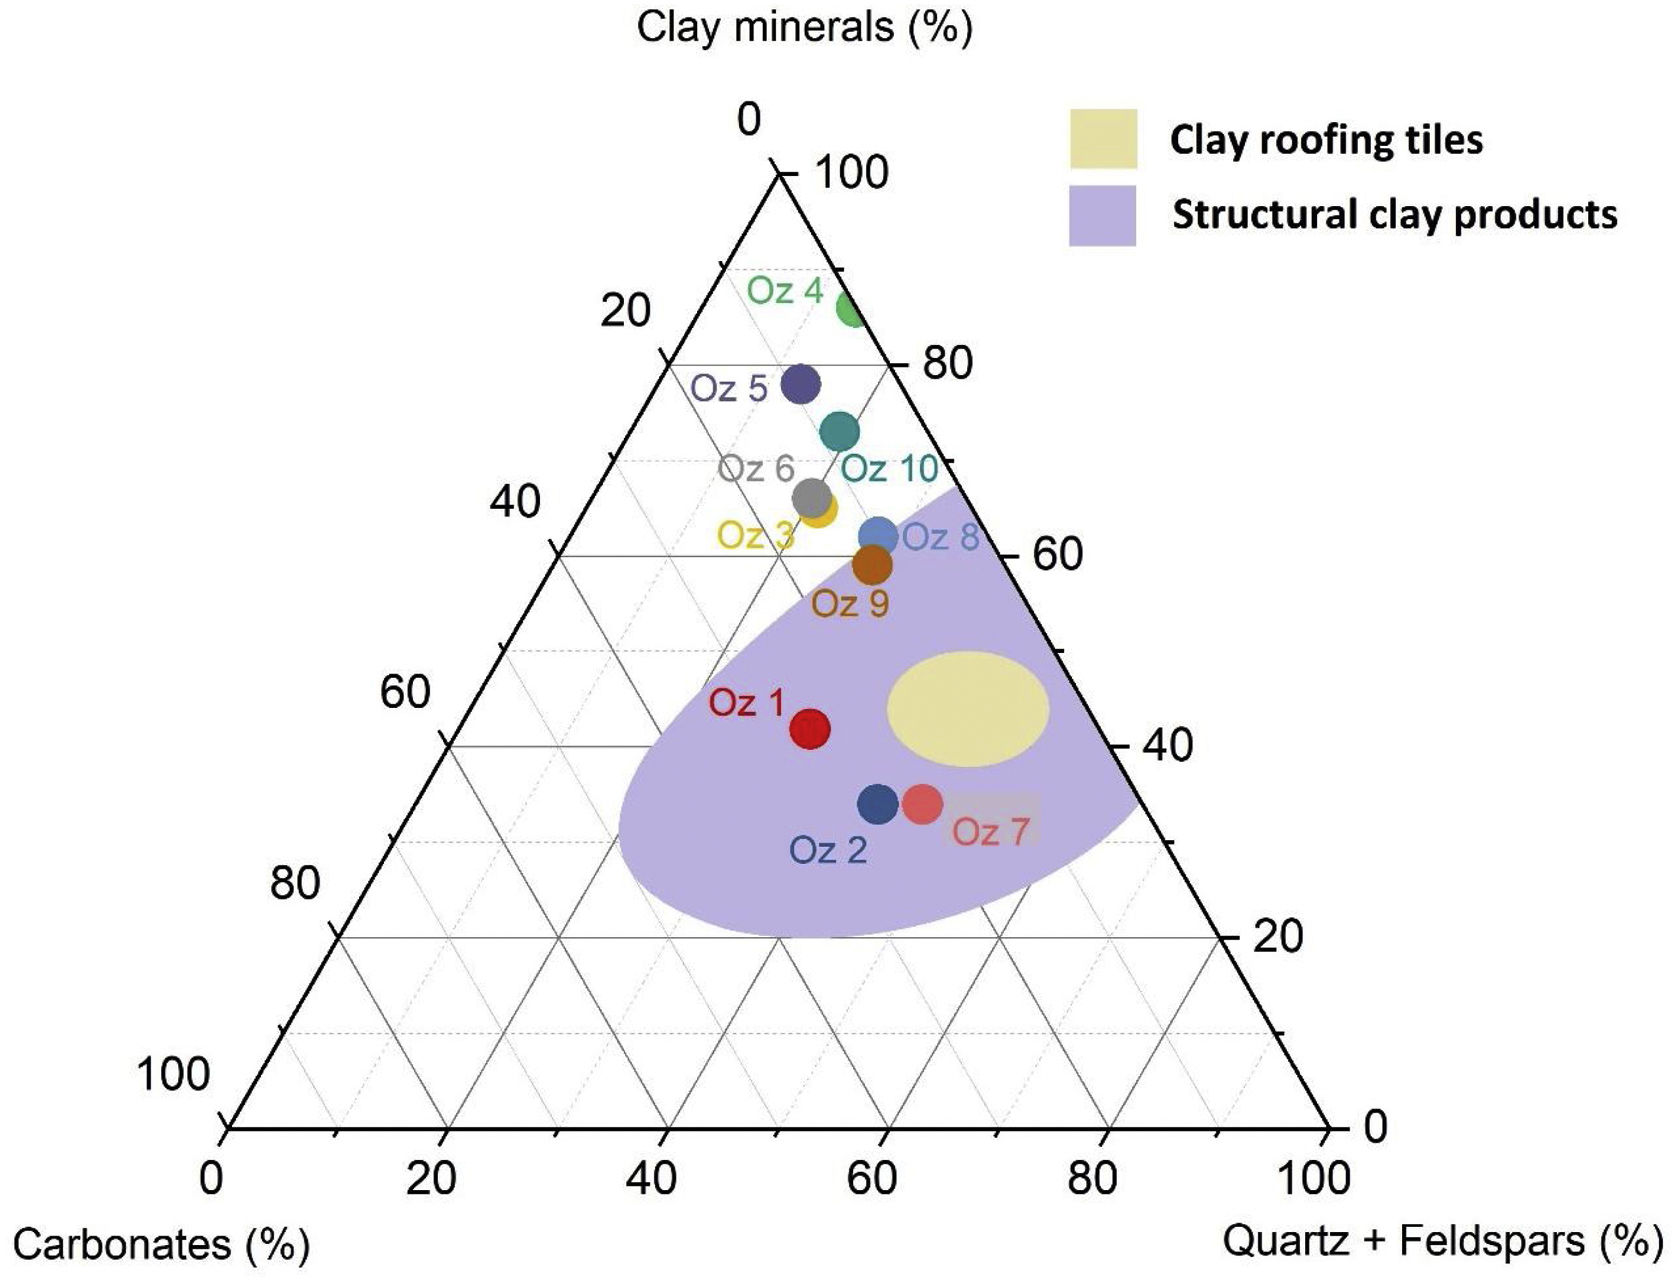
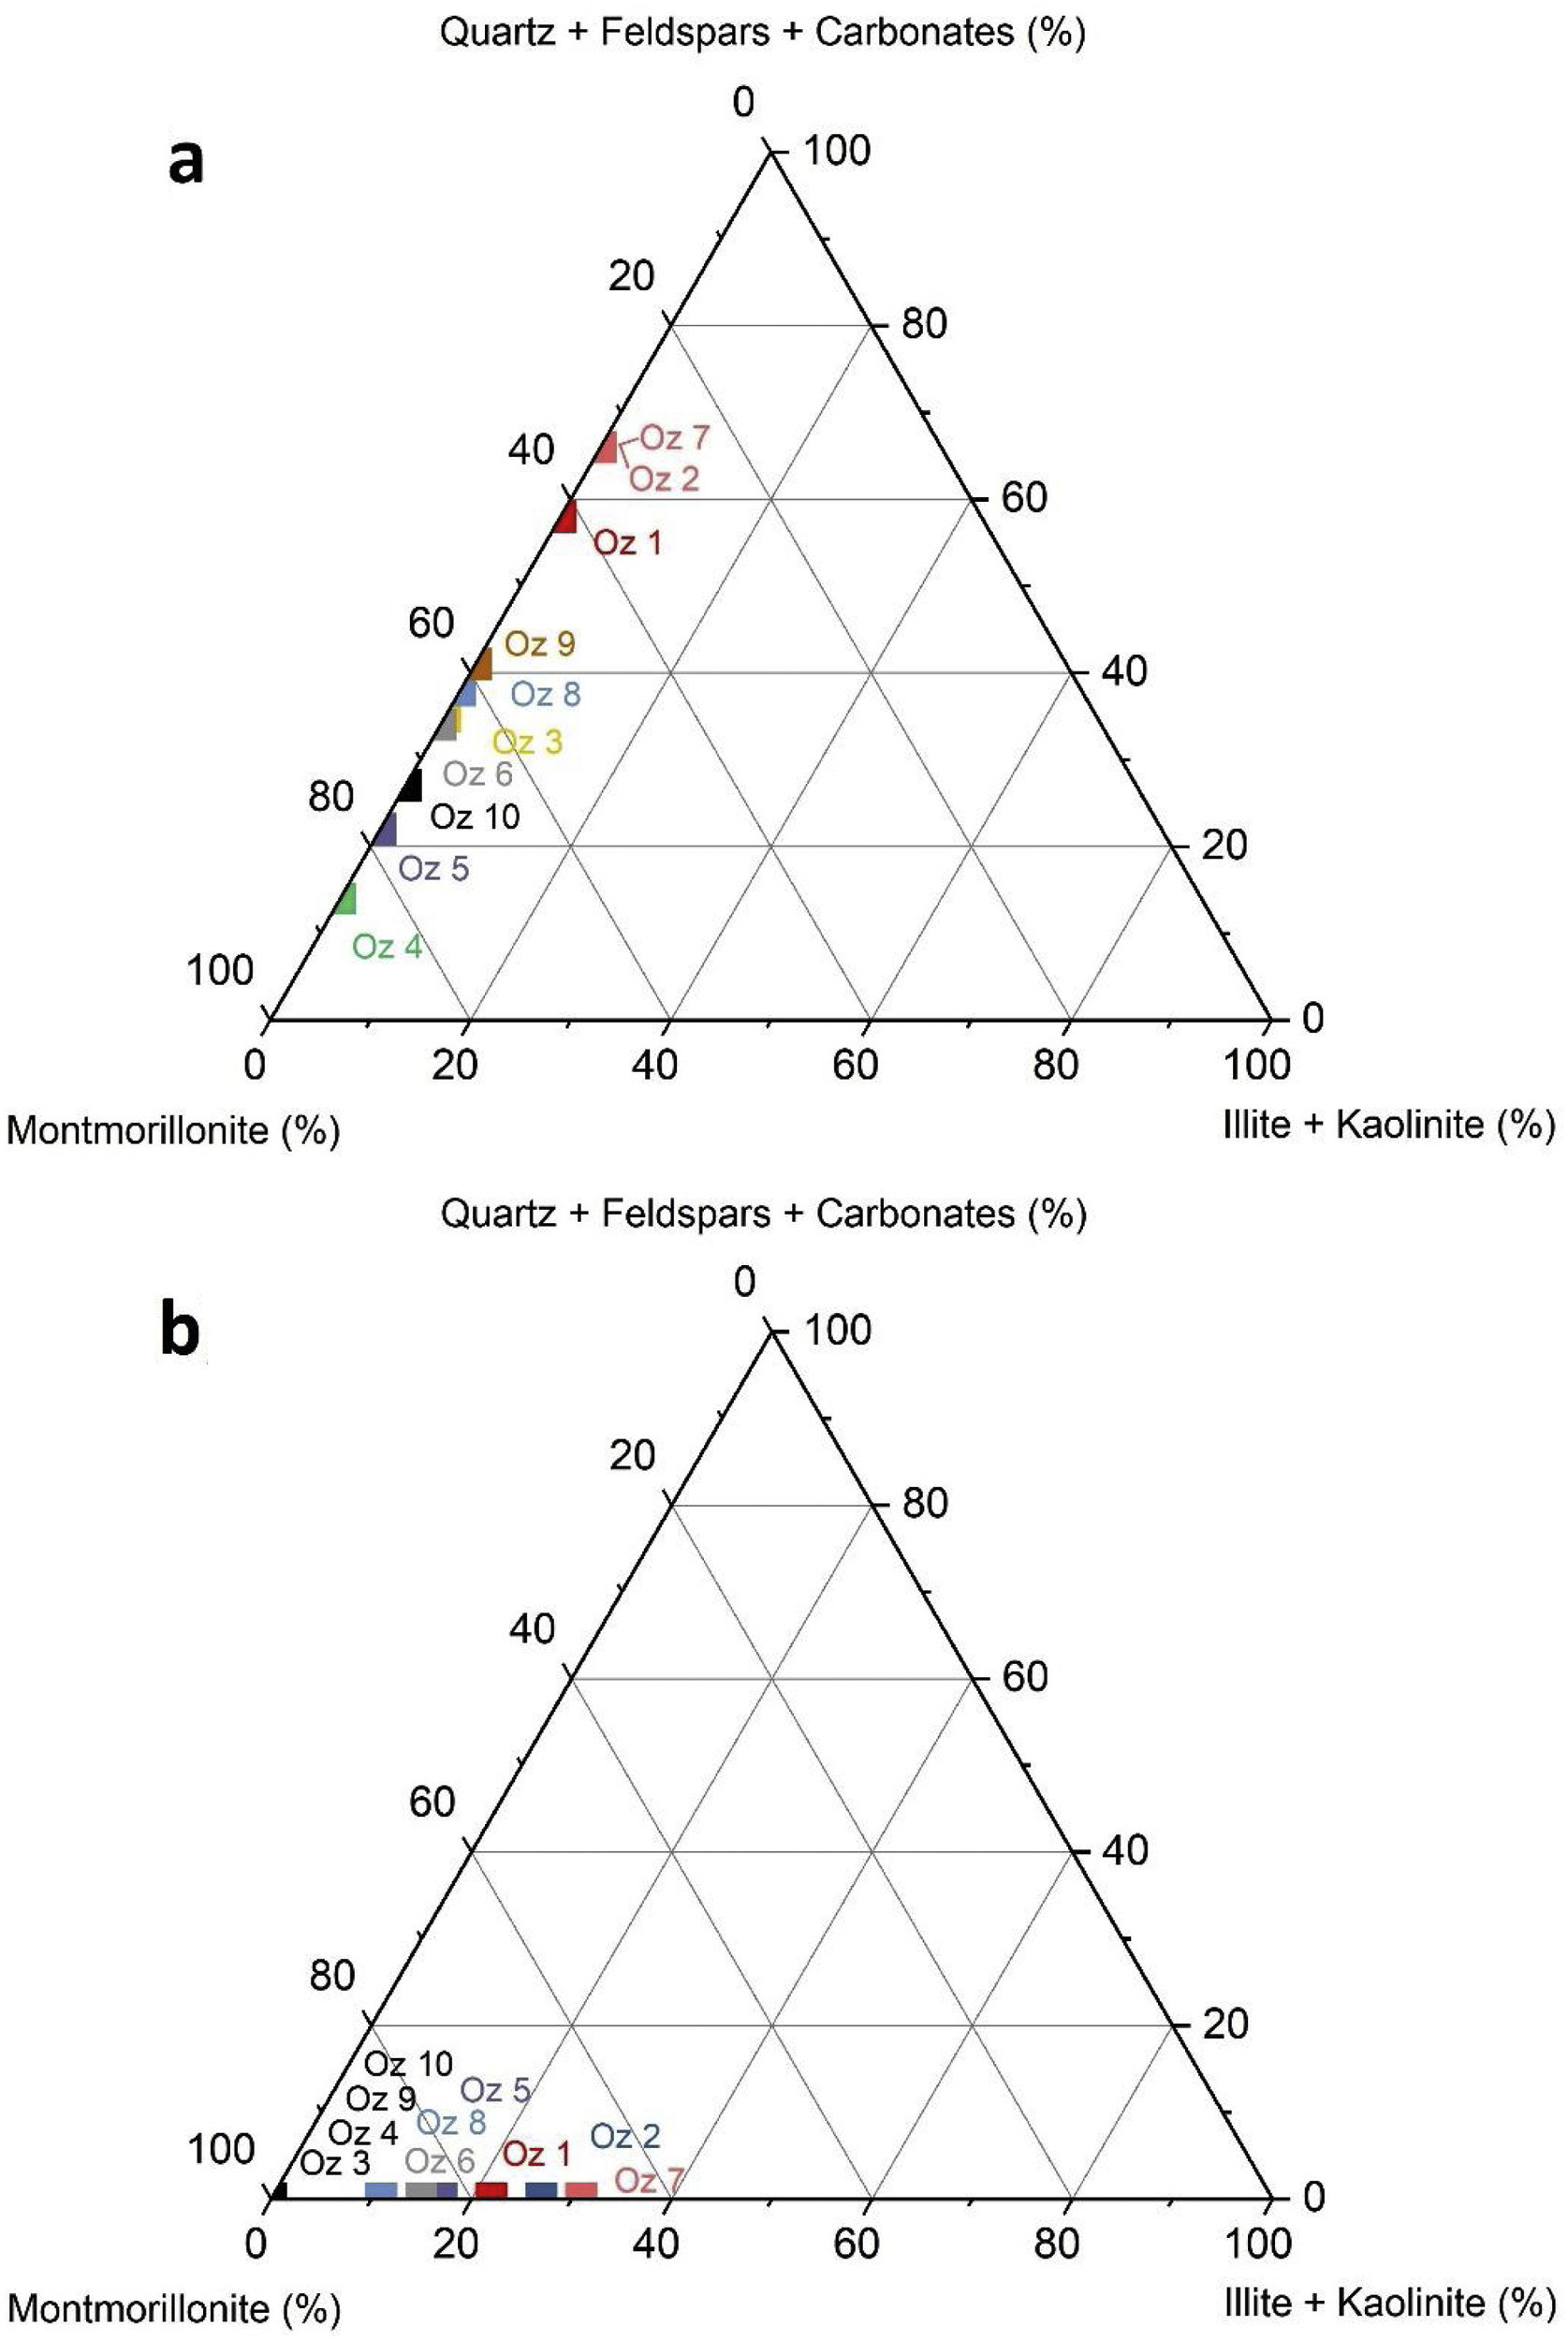
Fig. 6 demonstrates the amounts of clay minerals and non-clay minerals composing clay samples according to the Strazzera ternary diagram [20,31]. Oz 3-Oz 6, Oz 8-Oz 10 are very rich in clay minerals (≥60%). Otherwise, Oz 1 and Oz 2 are more carbonated, are rather quarzitic and contain high feldspars content especially in Oz 7 sample (Fig. 7). Making from the studied clays (Oz 1-Oz 2, Oz 7-Oz 9) the required characteristics to be employed as structural clay products according to Strazzera ternary diagram. Fig. 7 illustrates the mineralogical characteristics of the studied samples according to the clay and non-clay minerals composing each sample in bulk and purified state. The results indicate that all samples contain more than 68% of smectite and especially Oz 3, Oz 4, Oz 9, Oz 10 that are the most abundant in montmorillonite compared to Oz 1, Oz 2, and Oz 7 which are associated with 20–30% of Kaolinite and Illite (Table 3).

: Bulk clay samples and (b): purified clay samples.")
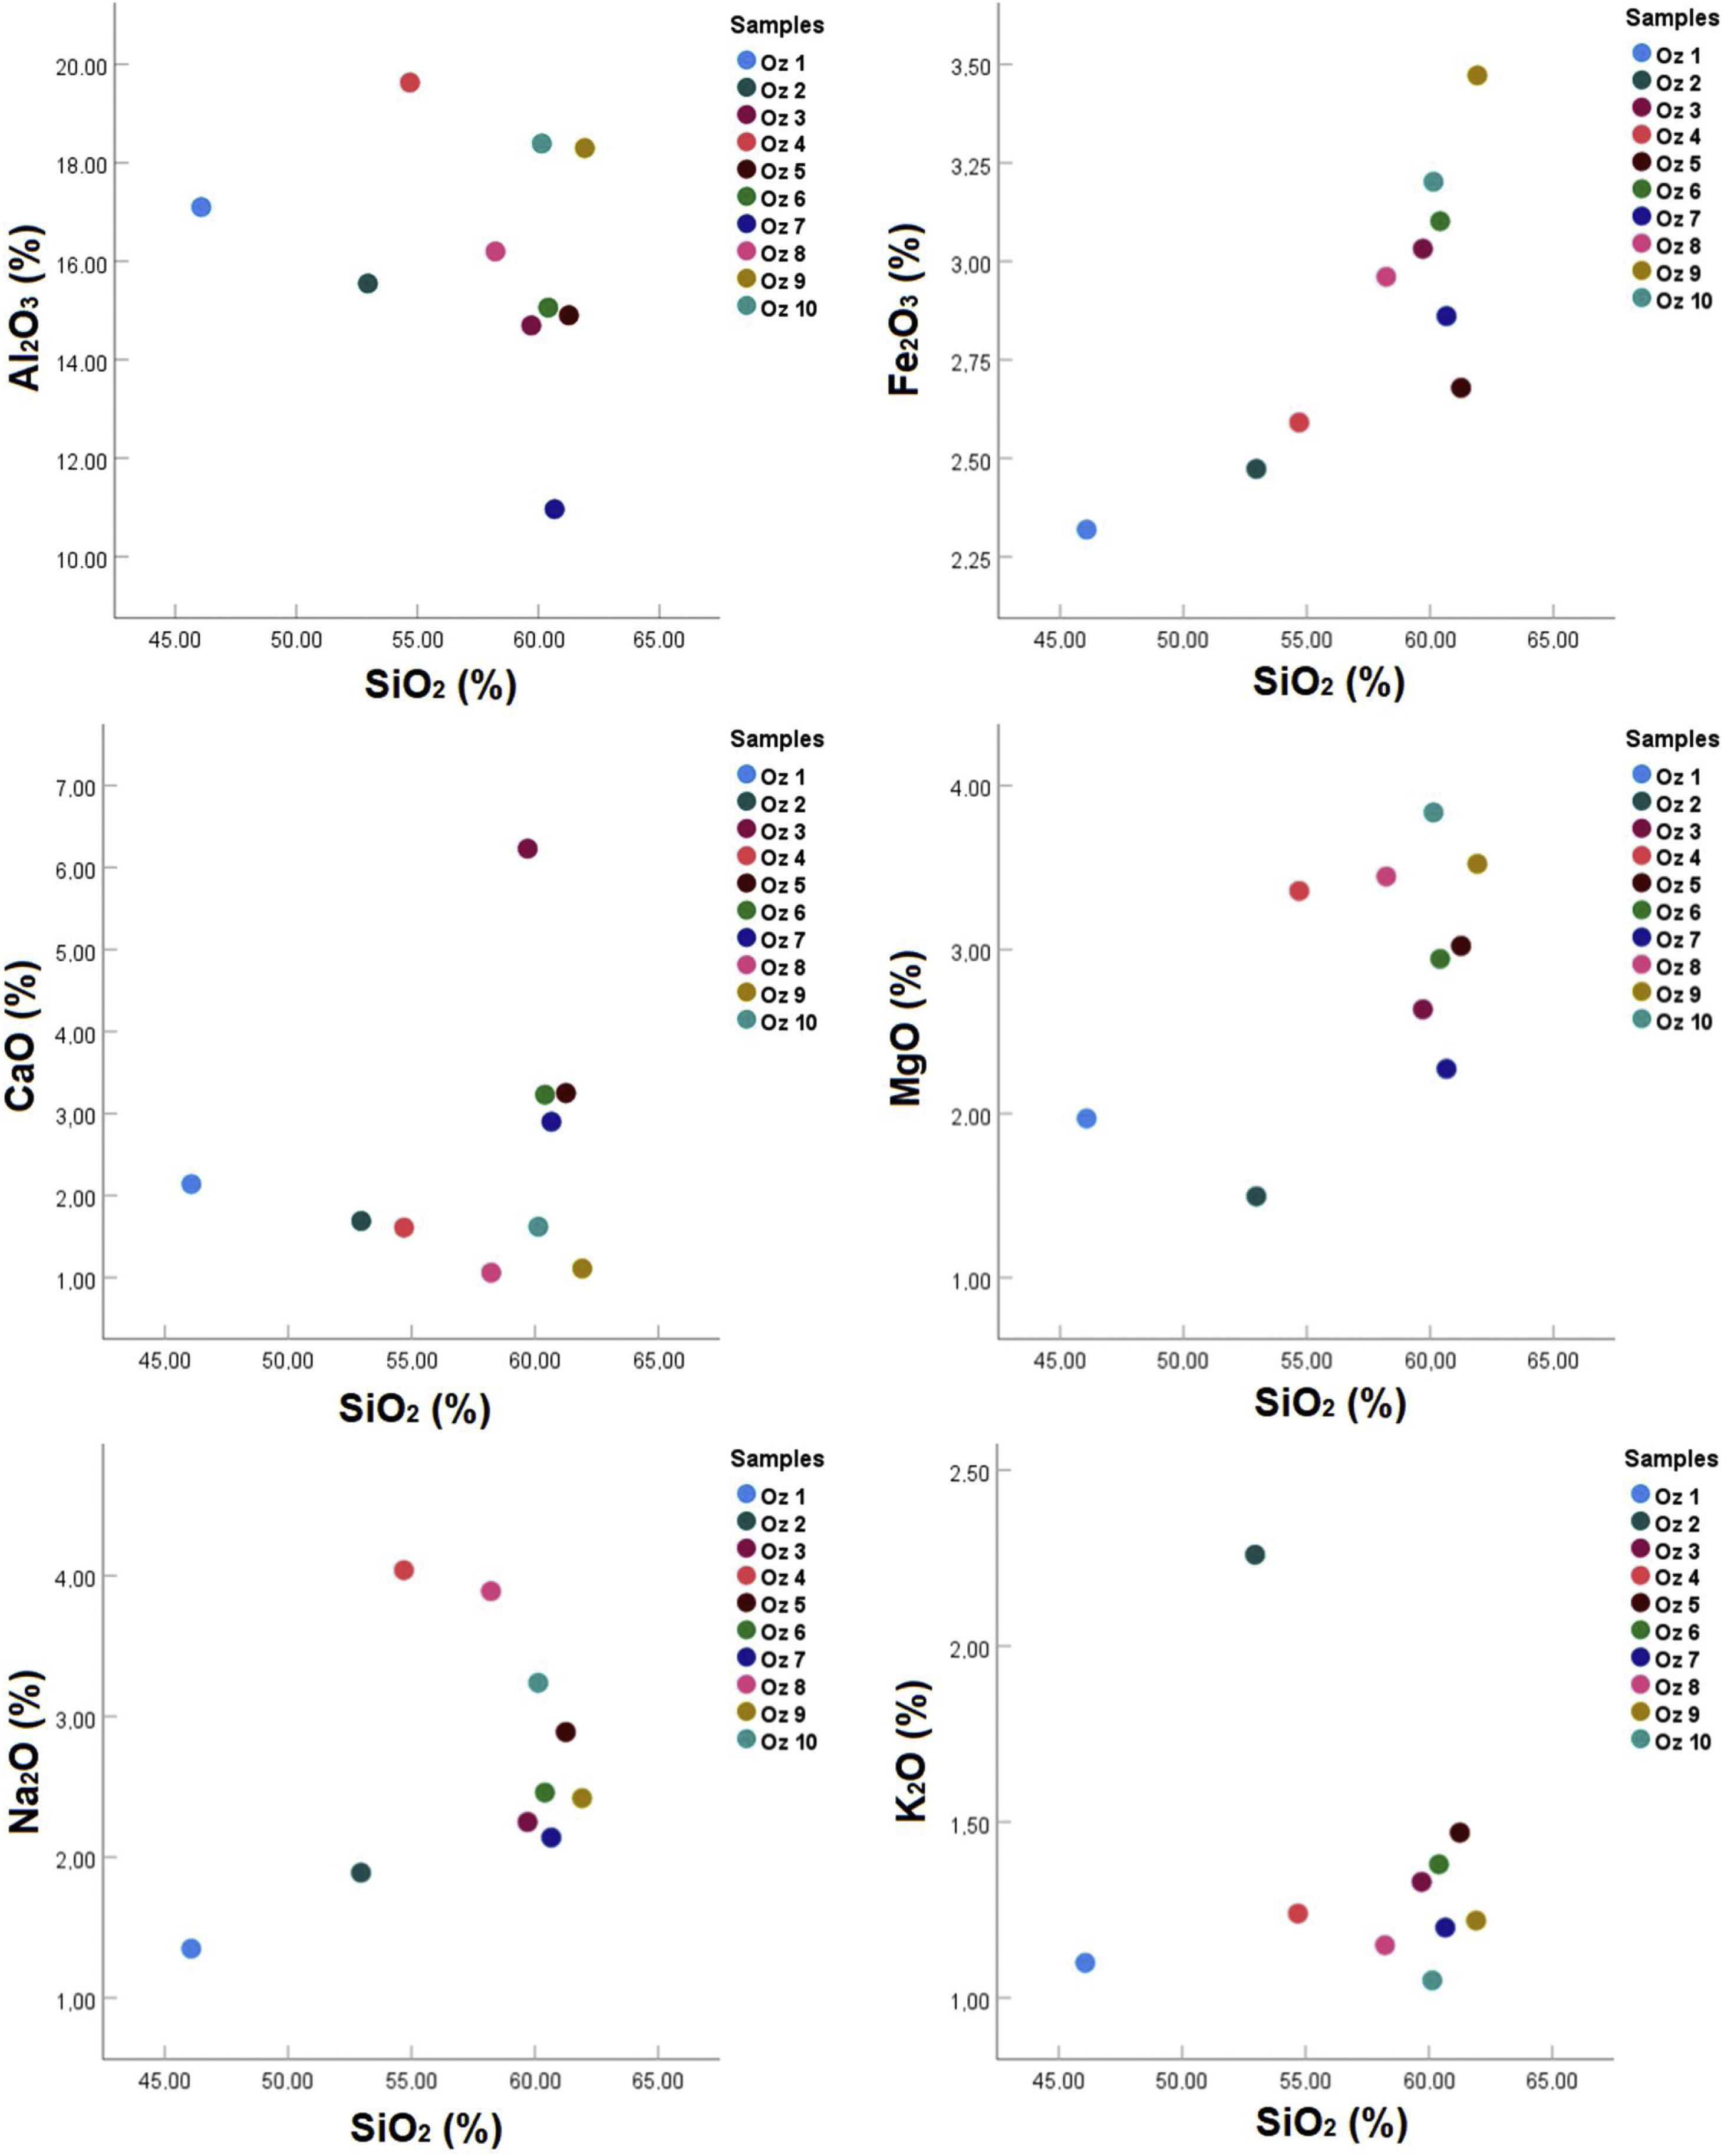
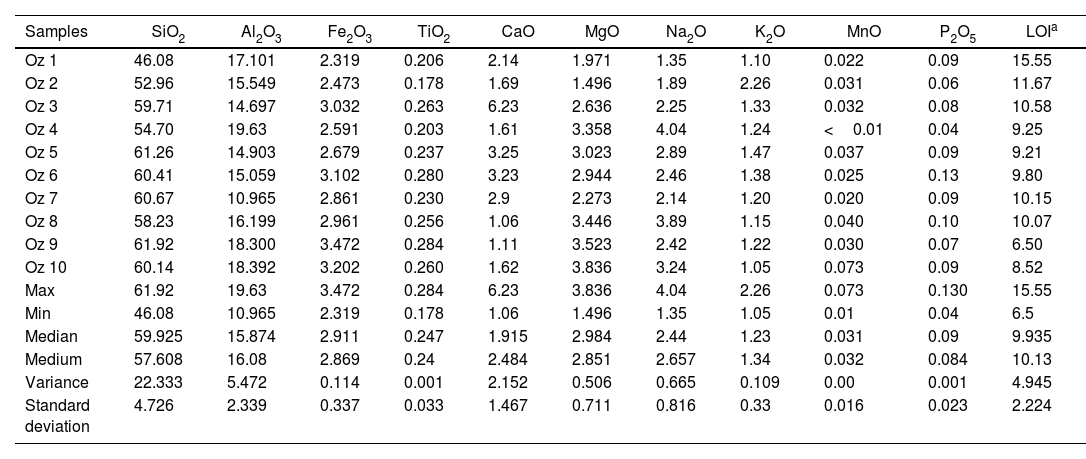
The chemical composition in weight content by XRF shows that the main oxides being present in all samples are SiO2 (46.08–61.92%) and Al2O3 (10.96–19.63%) because of their mineralogy, rich in smectite, feldspars and quartz. CaO (1.06–6.23%), Fe2O3 (2.319–2.472%), K2O (1.05–2.26%), MgO (1.496–3.836%), MnO (0.01–0.073%), Na2O (1.35–4.04%), P2O5 (0.04–0.13%), TiO2 (0.178–0.284%) display low percentages. The LOI values varied from 6.50% to 15.55% which is due to the presence of clay minerals and carbonates (Table 4).
Chemical composition of the clay samples from the Oued Zemmour deposits in weight (wt.%).
| Samples | SiO2 | Al2O3 | Fe2O3 | TiO2 | CaO | MgO | Na2O | K2O | MnO | P2O5 | LOIa |
|---|---|---|---|---|---|---|---|---|---|---|---|
| Oz 1 | 46.08 | 17.101 | 2.319 | 0.206 | 2.14 | 1.971 | 1.35 | 1.10 | 0.022 | 0.09 | 15.55 |
| Oz 2 | 52.96 | 15.549 | 2.473 | 0.178 | 1.69 | 1.496 | 1.89 | 2.26 | 0.031 | 0.06 | 11.67 |
| Oz 3 | 59.71 | 14.697 | 3.032 | 0.263 | 6.23 | 2.636 | 2.25 | 1.33 | 0.032 | 0.08 | 10.58 |
| Oz 4 | 54.70 | 19.63 | 2.591 | 0.203 | 1.61 | 3.358 | 4.04 | 1.24 | <0.01 | 0.04 | 9.25 |
| Oz 5 | 61.26 | 14.903 | 2.679 | 0.237 | 3.25 | 3.023 | 2.89 | 1.47 | 0.037 | 0.09 | 9.21 |
| Oz 6 | 60.41 | 15.059 | 3.102 | 0.280 | 3.23 | 2.944 | 2.46 | 1.38 | 0.025 | 0.13 | 9.80 |
| Oz 7 | 60.67 | 10.965 | 2.861 | 0.230 | 2.9 | 2.273 | 2.14 | 1.20 | 0.020 | 0.09 | 10.15 |
| Oz 8 | 58.23 | 16.199 | 2.961 | 0.256 | 1.06 | 3.446 | 3.89 | 1.15 | 0.040 | 0.10 | 10.07 |
| Oz 9 | 61.92 | 18.300 | 3.472 | 0.284 | 1.11 | 3.523 | 2.42 | 1.22 | 0.030 | 0.07 | 6.50 |
| Oz 10 | 60.14 | 18.392 | 3.202 | 0.260 | 1.62 | 3.836 | 3.24 | 1.05 | 0.073 | 0.09 | 8.52 |
| Max | 61.92 | 19.63 | 3.472 | 0.284 | 6.23 | 3.836 | 4.04 | 2.26 | 0.073 | 0.130 | 15.55 |
| Min | 46.08 | 10.965 | 2.319 | 0.178 | 1.06 | 1.496 | 1.35 | 1.05 | 0.01 | 0.04 | 6.5 |
| Median | 59.925 | 15.874 | 2.911 | 0.247 | 1.915 | 2.984 | 2.44 | 1.23 | 0.031 | 0.09 | 9.935 |
| Medium | 57.608 | 16.08 | 2.869 | 0.24 | 2.484 | 2.851 | 2.657 | 1.34 | 0.032 | 0.084 | 10.13 |
| Variance | 22.333 | 5.472 | 0.114 | 0.001 | 2.152 | 0.506 | 0.665 | 0.109 | 0.00 | 0.001 | 4.945 |
| Standard deviation | 4.726 | 2.339 | 0.337 | 0.033 | 1.467 | 0.711 | 0.816 | 0.33 | 0.016 | 0.023 | 2.224 |
Correlation diagrams have been adopted based on the major oxides, depending on the SiO2 percentage to see oxides distribution in studied samples and to make the comparison between them (Fig. 8). In the MgO/SiO2, Fe2O3/SiO2, and K2O/SiO2 diagrams, all samples show comparable distribution. The same distribution is observed on the Na2O/SiO2 and Al2O3/SiO2 diagrams. In the diagram CaO/SiO2, the values vary between the different samples. In this same figure, all samples represent more than 45% in silica content. Moreover, the highest alumina contents (≈18–20%) occurs in Oz 4, Oz 9, and Oz 10 with relative Al2O3/SiO2 mass ratios of 0.37, 0.30, and 0.31, respectively. The lowest Fe2O3 content was observed in sample Oz 1 (2.319%), while the relatively high Fe2O3 content (>3%) was observed in samples Oz 3, Oz 6, Oz 9, and Oz 10. The highest CaO content (6.23%) was in sample Oz 3 compared to the other samples which are between 1.06 and 3.25%, which is probably related to the relative carbonate content. MgO and Na2O contents were found to be less than 2% in Oz 1 and Oz 2 respectively, but higher in the rest of the samples with a limit of <4% in each oxide. Otherwise, K2O content is presented in the range between 1 and 1.5% in all samples except for Oz 2 which is characterized by the highest value (2.26%).

The chemical composition is in accordance with the mineralogical composition such that all the samples represent a high content of SiO2 which means that the studied bentonite results from the alteration of volcanic products of acidic nature (rhyolites or trachyte) [47].
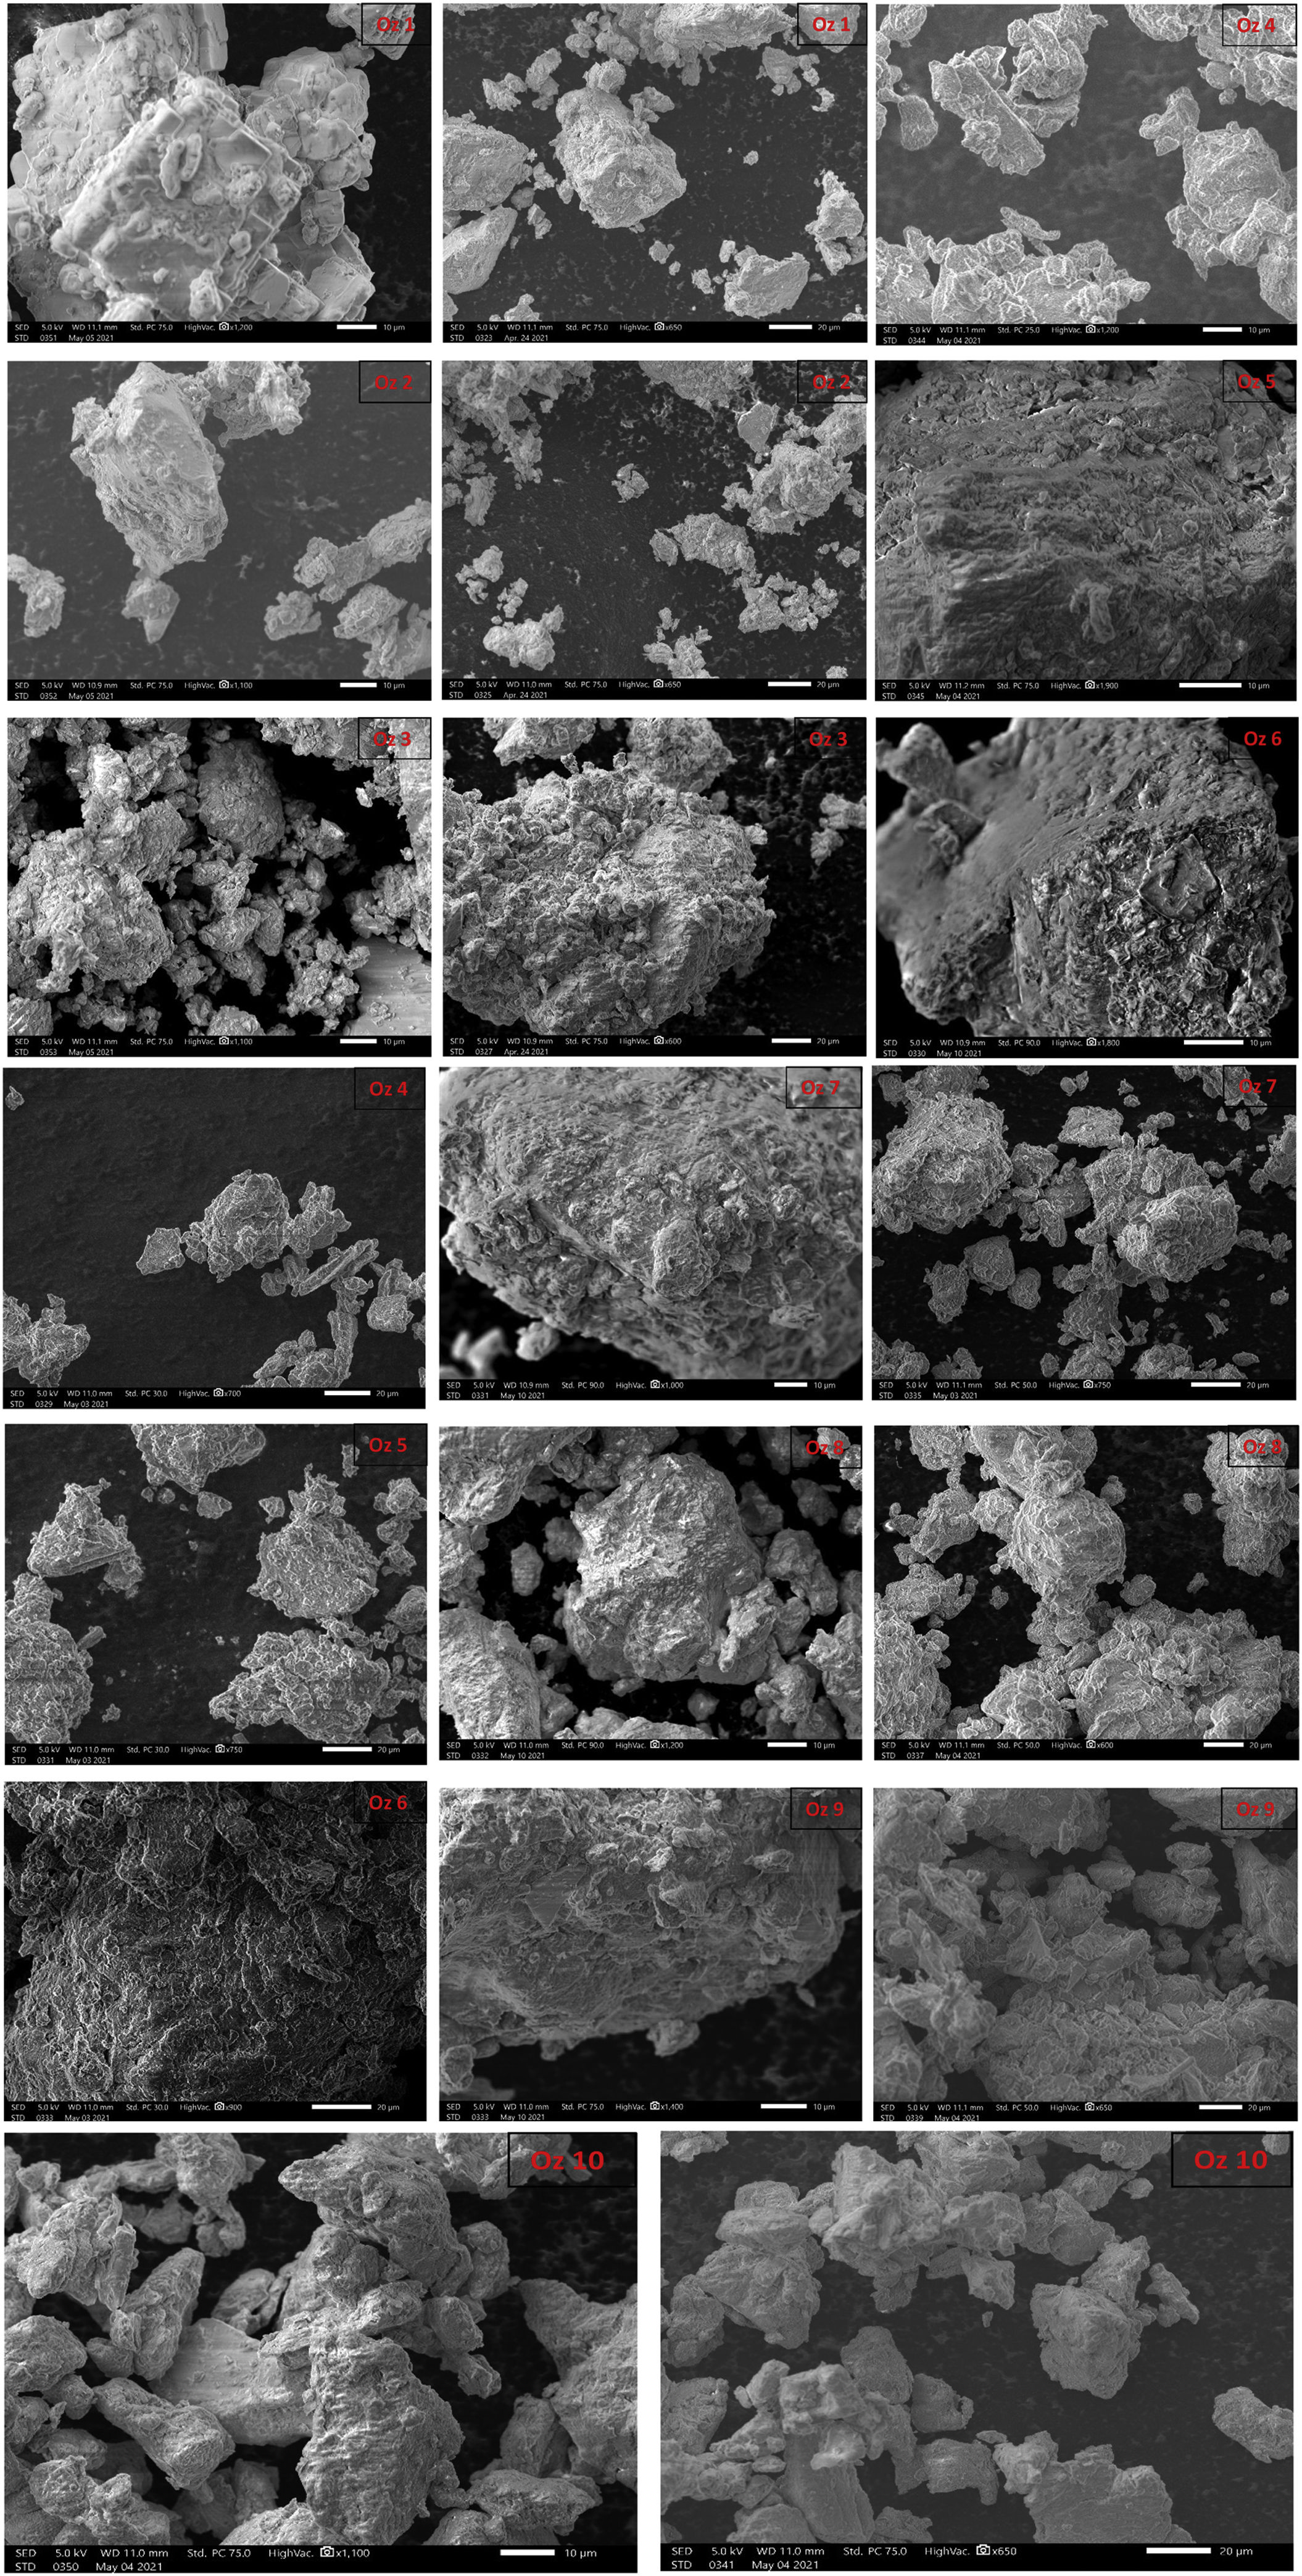
Morphological characterization (SEM)Scanning electron microscopy pictures illustrate the microscopic morphology of the bentonite surface. The observations were made with a scanning electron microscope fitted with an EDX device (quantitative analysis) on the bentonitic powder. It shows stacked overlaid layers and displays aggregates of bentonite grains, spherical and with a heterogeneous dimension, with a remarkable compact structure. Interstices between grains form pores. For a higher magnification (corresponding to a scale of 20μm), we observe big cavities of irregular shape (Fig. 9). The spongy appearance of the smectite minerals is clearly remarkable (Fig. 9).
Infrared spectroscopy
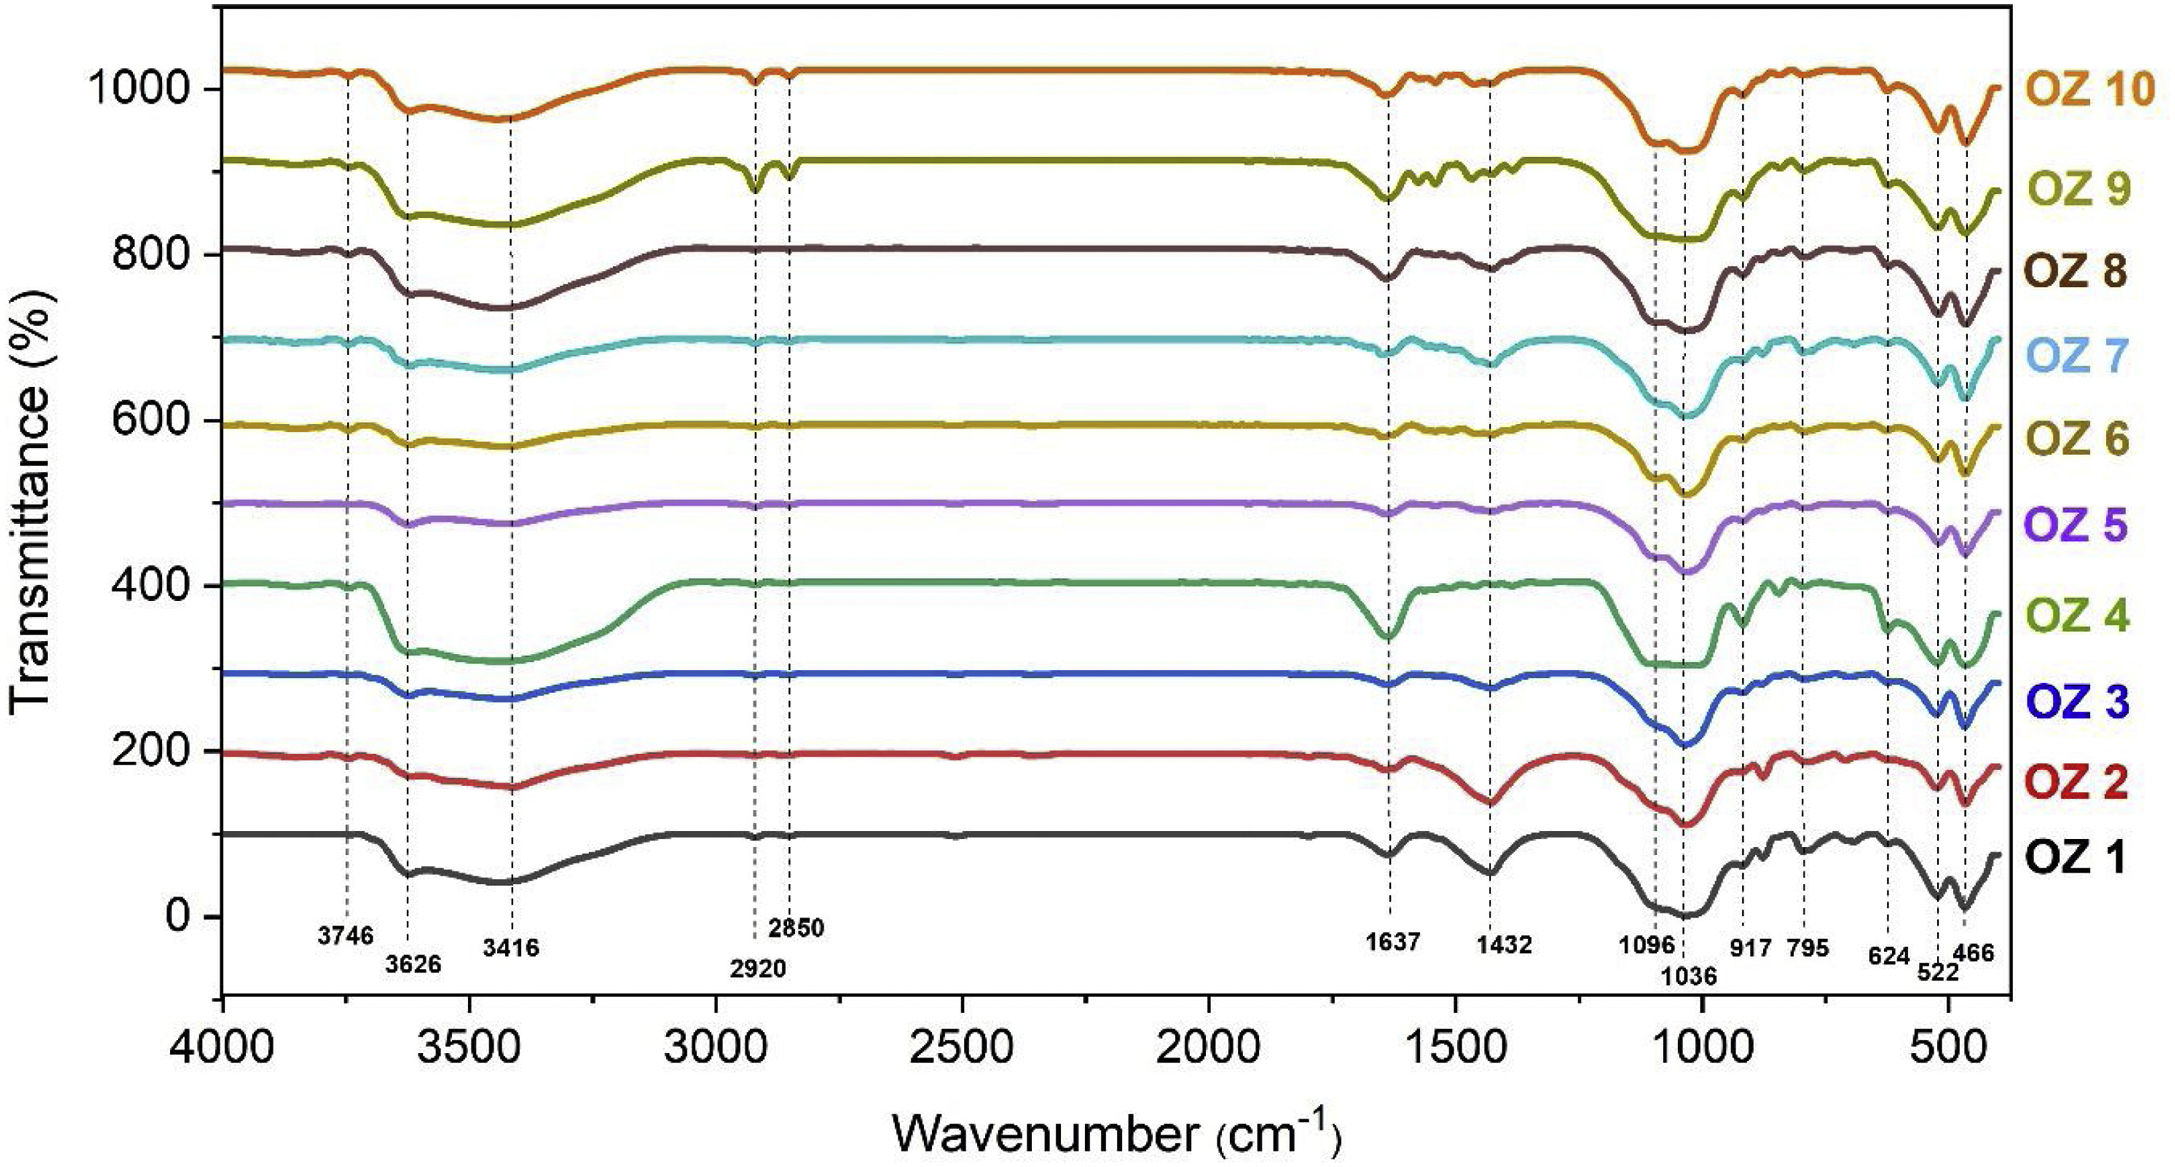
Chemical characteristics of bentonite samples including organic matter and functional groups were studied using FTIR analysis (Fig. 10). The obtained results showed the main characteristic bands of bentonite clay and revealed the same absorption bands. Stretching vibration bands of Al-O-Si and Si-O-Si were observed at 522cm−1 and 466cm−1 respectively [62]. The peaks at 3626 and 917cm−1 correspond to the OH stretching of structural hydroxyls and deformation of Al-Al-OH in the octahedral layers of bentonite, while the band at 624cm−1 is attributed to coupled Al-O and Si-O out-of-plane vibration. On the other hand, 1637cm−1 represents the H-O-H bending vibration of water [29]. A peak at 795cm−1 due to Si-O stretching vibration confirms the presence of Quartz [63]. Large Si-O bands are observed in the range 1100–1000cm−1 due also to the stretching vibrations in the tetrahedral layer [63]. The stretching vibration of absorbed water H-O-H can be observed at 3416cm−1. The band located at 1432cm−1 is due to the symmetric stretching vibration of carbonates [63]. The peaks located at 2920 and 2850cm−1 are probably due to asymmetric methylene stretching –CH2 of the organic matter [64] and observed with a significant amount in the samples Oz 1, Oz 2, Oz 9 and Oz 10.
Thermal behavior by DTA-TGA
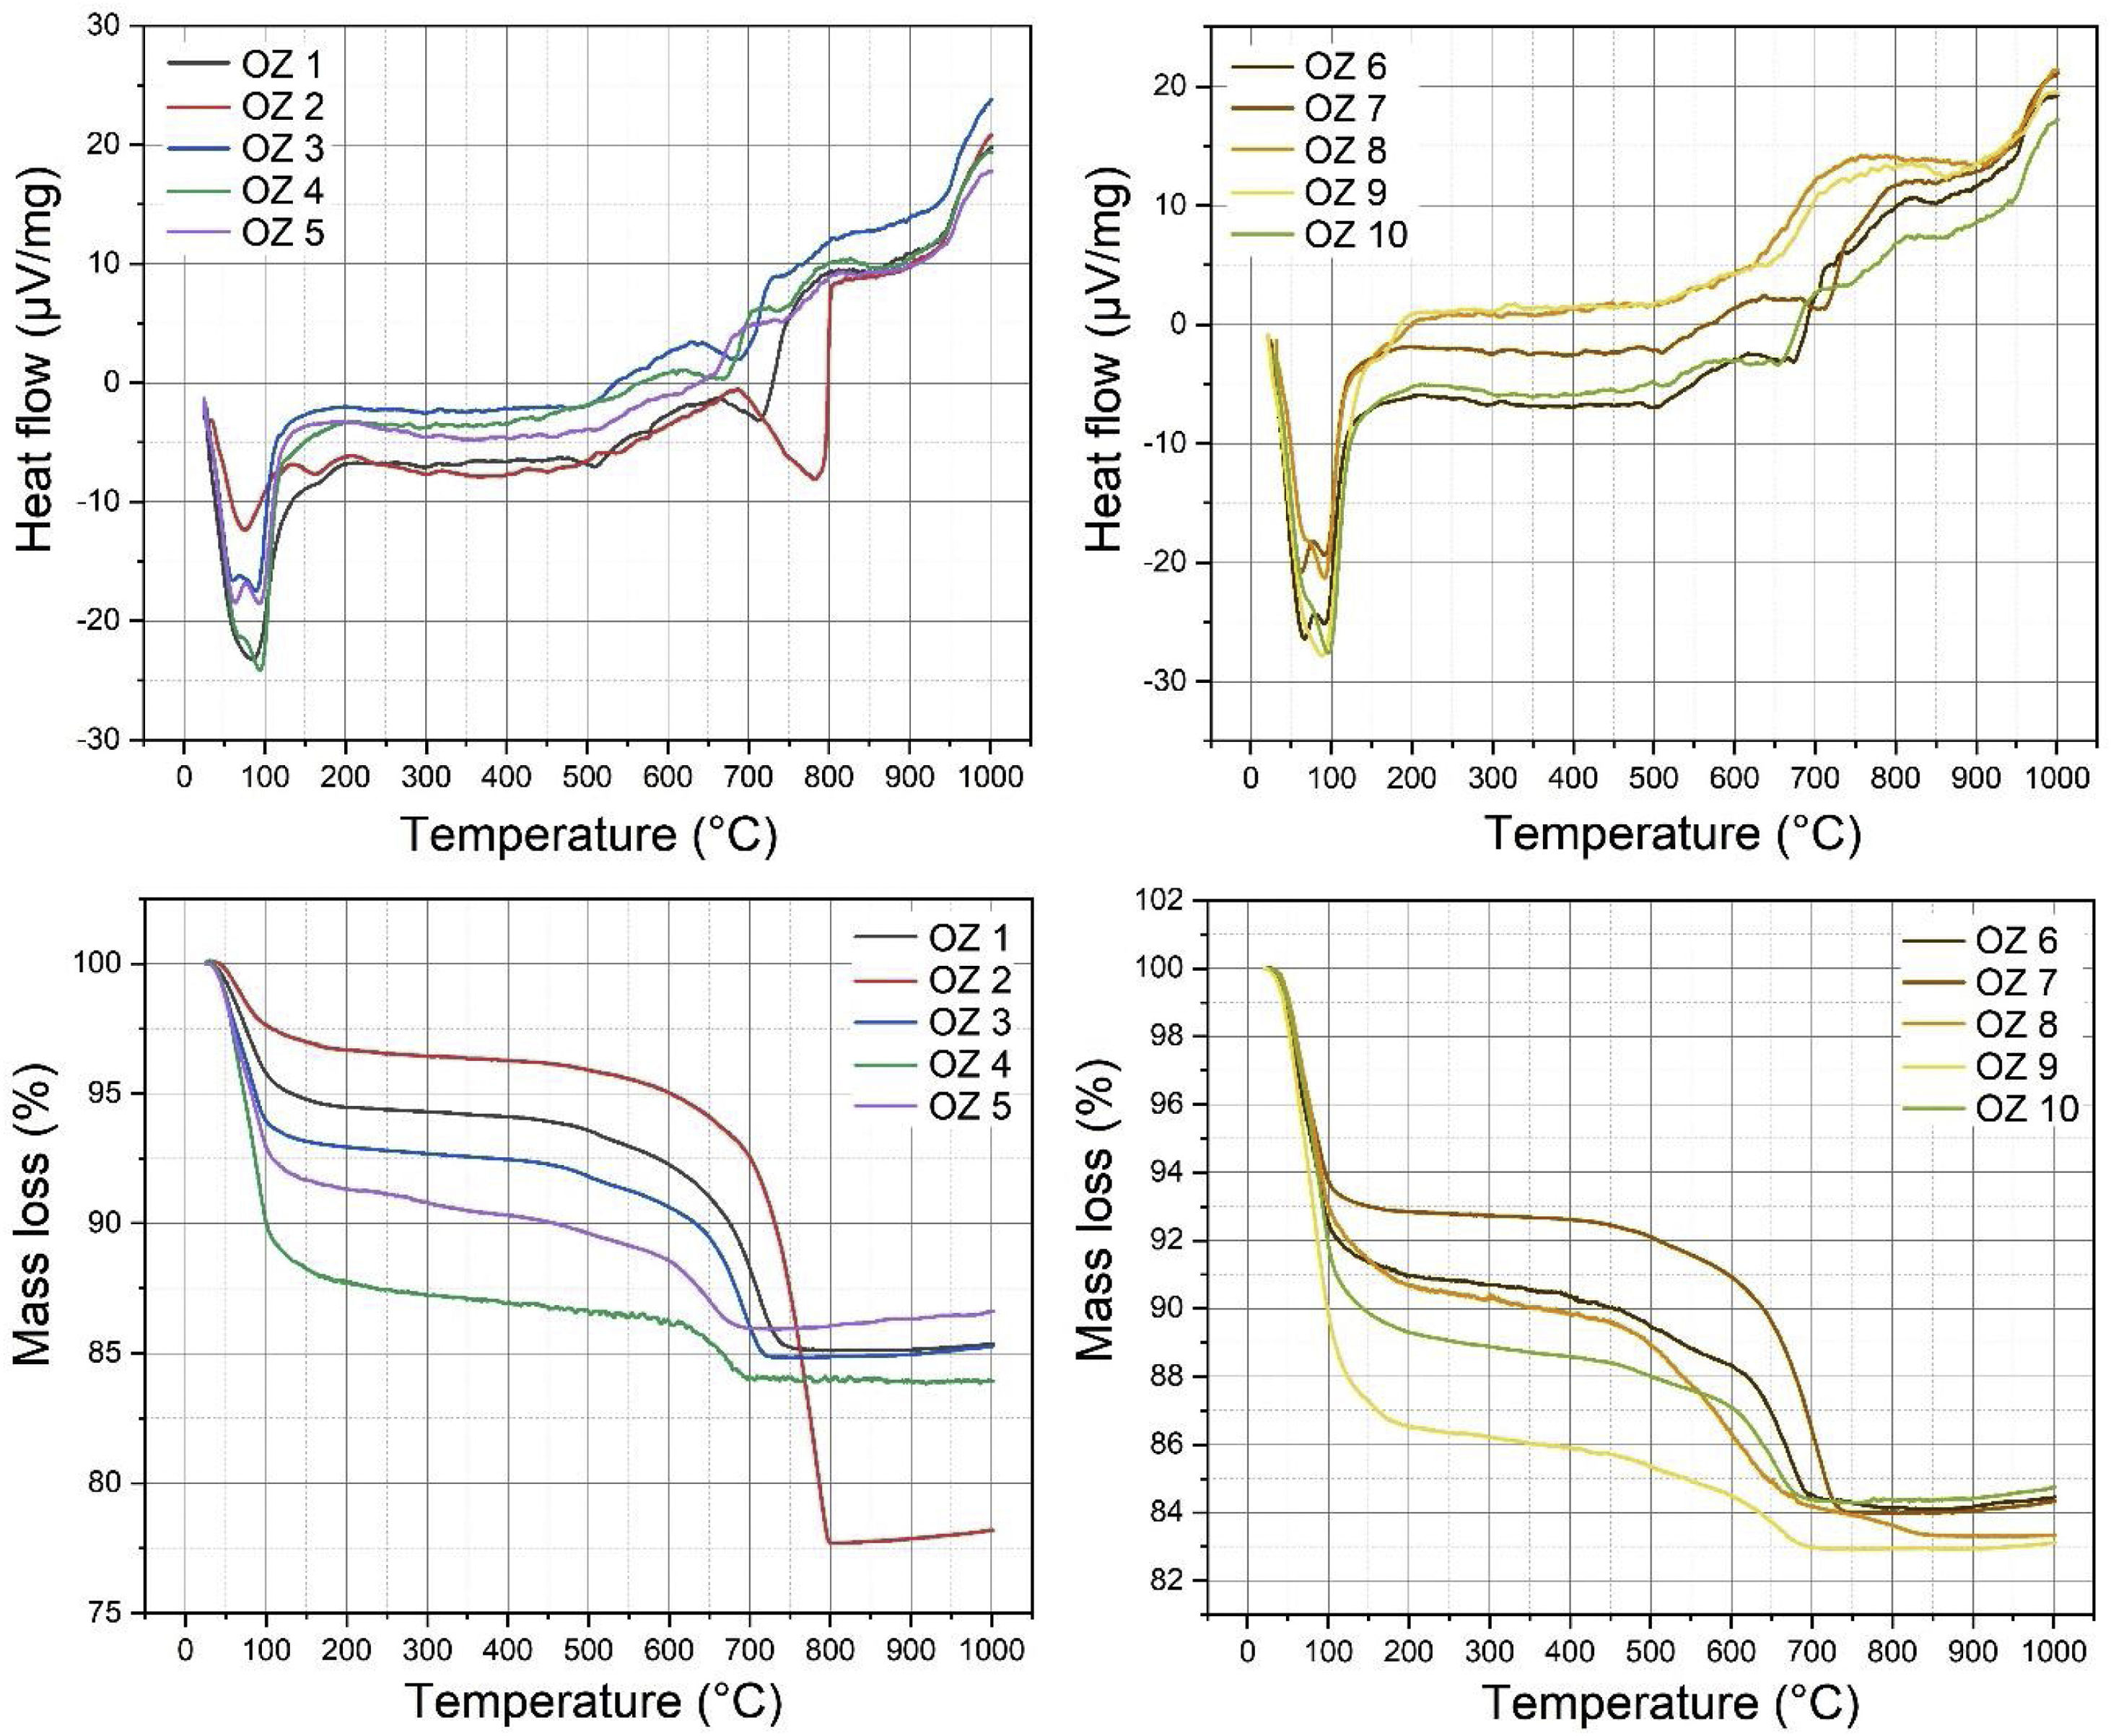
Thermal analysis by DTA-TGA of clay samples are presented in Fig. 11. The results provide a total mass loss between 14.02 and 22.26% in clay samples from 23°C to 1000°C. The major mass loss is attributed to Oz 2 sample due to the high content of carbonates. DTA results showed three major endothermic peaks in all samples. Large peaks were observed between 60 and 100°C corresponds to the departure of adsorbed water with a mass loss between 3.3 and 13.62% and respectively in Oz 2 and Oz 9. The very weak peaks located between 500 and 650°C are due to the structural reorganization of minerals in clay samples such as the polymorphic transformation of quartz α to quartz β with no significative mass loss values. The decomposition of carbonate minerals was detected between 650 and 800°C with mass losses between 2.91 and 19.02% and respectively in Oz 4 and Oz 2 samples [62,63].
Characterization of bentonitesAtterberg limits.")
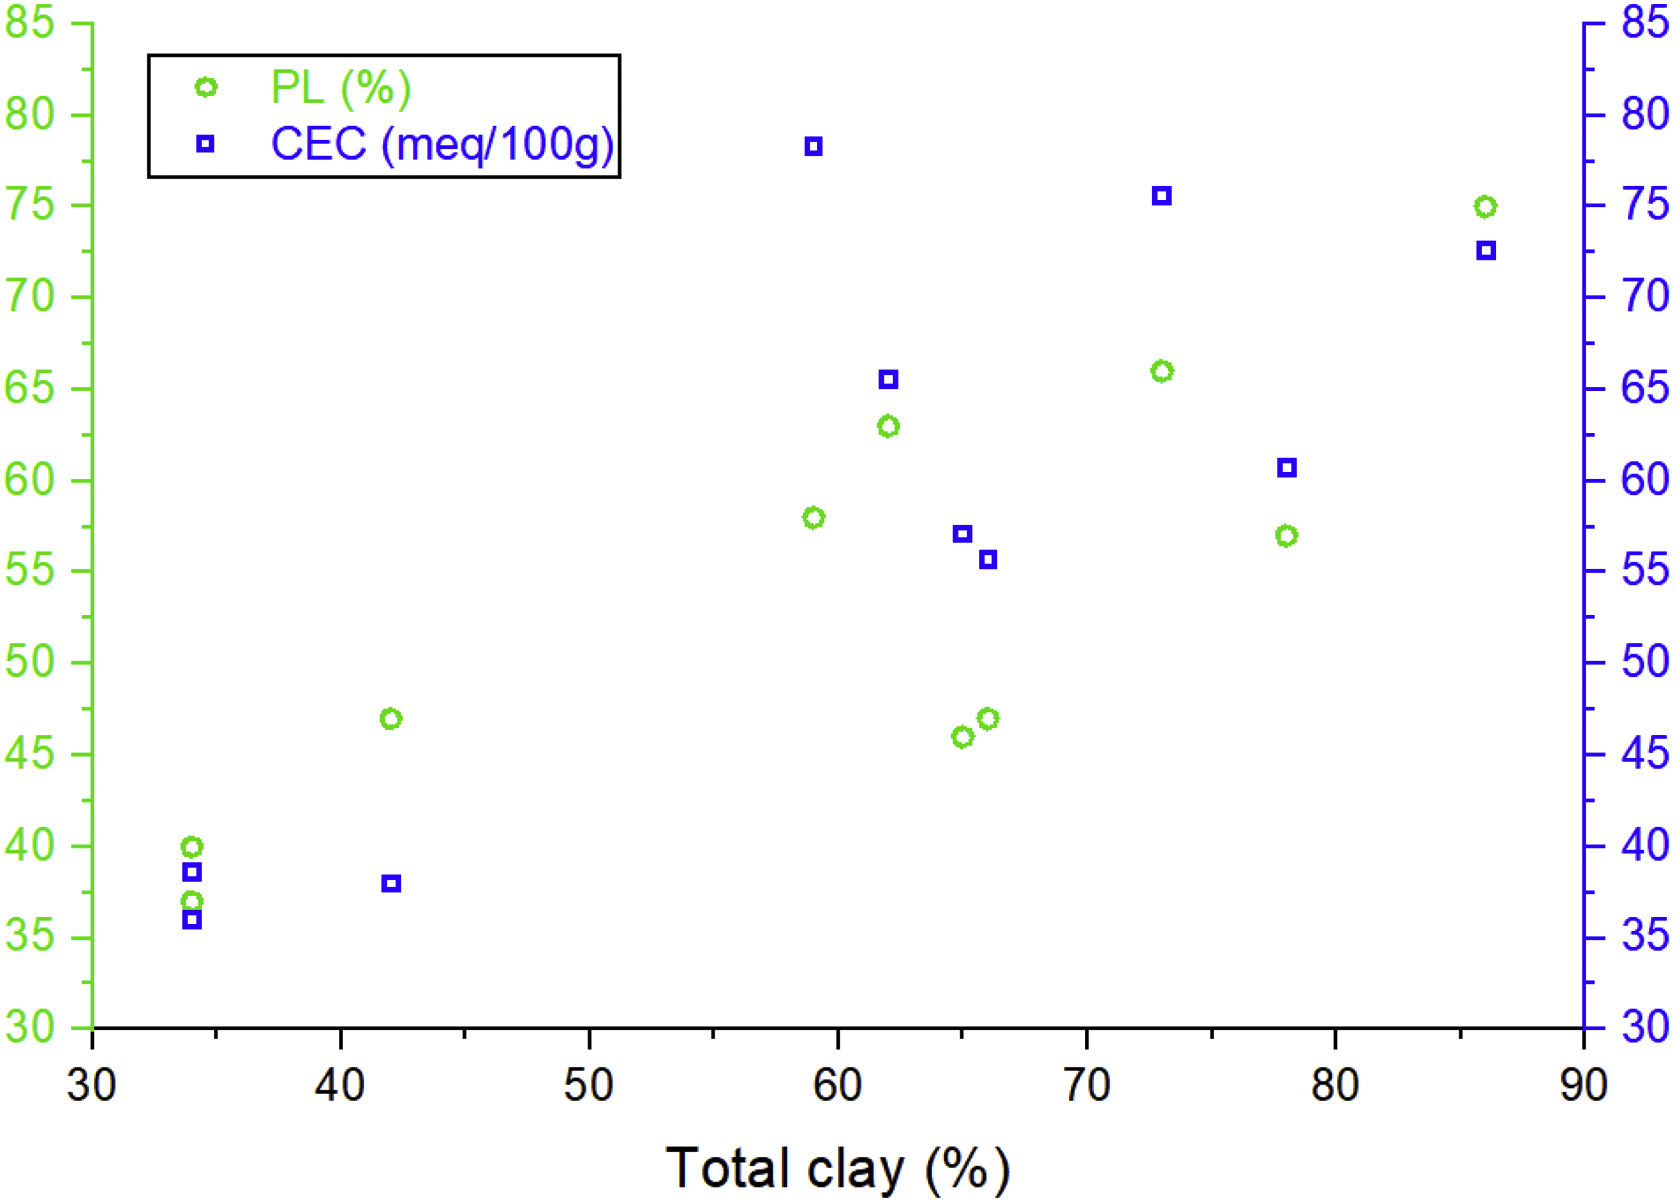
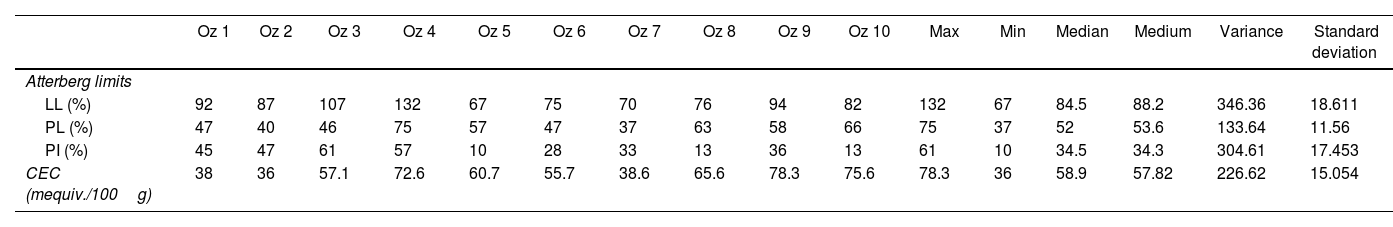
Plasticity results widely vary between the different samples studied. The liquid limit varies from 67 to 132%. The plasticity limit varies from 37 to 75%. The resultant plasticity index varies between 10 and 61% (Table 5). The liquidity limit and the plasticity limit record their minimum values in respective Oz 5 and Oz 7 samples. However, Oz 4 bentonite shows maximum values of liquidity limit and plasticity index. Therefore, Oz 5, Oz 8 and Oz 10 samples are poorly plastic but the other samples are extremely plastic [65,66]. Indeed, the plasticity limit depends on the content and the mineralogy of clay minerals (Figs. 3 and 4) since they give plasticity to clay materials. All studied samples show plasticities comparable to that of calcic bentonites [18,67].
Atterberg limits and cation exchange capacity of clay samples.
| Oz 1 | Oz 2 | Oz 3 | Oz 4 | Oz 5 | Oz 6 | Oz 7 | Oz 8 | Oz 9 | Oz 10 | Max | Min | Median | Medium | Variance | Standard deviation | |
|---|---|---|---|---|---|---|---|---|---|---|---|---|---|---|---|---|
| Atterberg limits | ||||||||||||||||
| LL (%) | 92 | 87 | 107 | 132 | 67 | 75 | 70 | 76 | 94 | 82 | 132 | 67 | 84.5 | 88.2 | 346.36 | 18.611 |
| PL (%) | 47 | 40 | 46 | 75 | 57 | 47 | 37 | 63 | 58 | 66 | 75 | 37 | 52 | 53.6 | 133.64 | 11.56 |
| PI (%) | 45 | 47 | 61 | 57 | 10 | 28 | 33 | 13 | 36 | 13 | 61 | 10 | 34.5 | 34.3 | 304.61 | 17.453 |
| CEC (mequiv./100g) | 38 | 36 | 57.1 | 72.6 | 60.7 | 55.7 | 38.6 | 65.6 | 78.3 | 75.6 | 78.3 | 36 | 58.9 | 57.82 | 226.62 | 15.054 |
The variation range of the cation exchange capacity (CEC) of samples is 36–78.3mequiv./100g, with an average value of 57.82mequiv./100g (Table 5). These values are higher than illites (10–40mequiv./100g), kaolinite (10–20mequiv./100g) and chlorite (10–40mequiv./100g) values [68–70]. The calculated CEC values are relatively lower than those of pure smectites which are characterized by a higher CEC value (80–150mequiv./100g) [71]. This is due to the presence of associated minerals such as quartz, feldspars and carbonate (Fig. 12).
Characterizations of elaborated ceramicsSynthesized phase identification by XRD
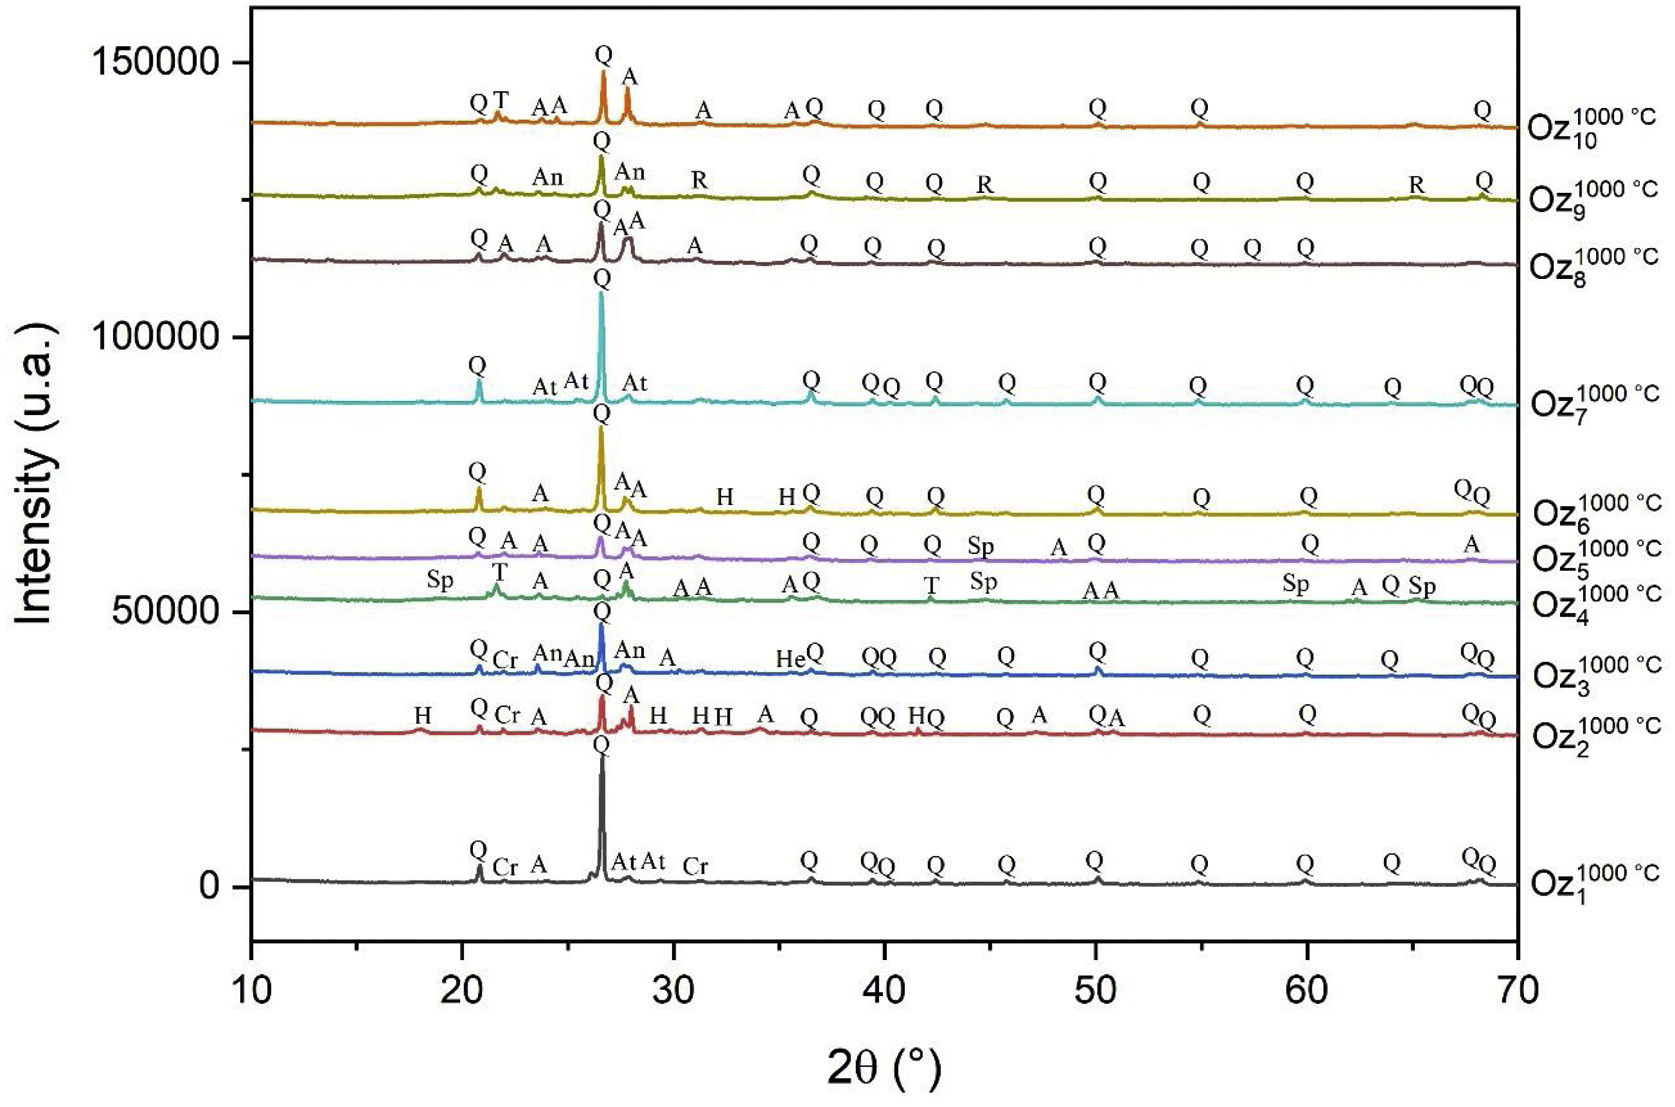
X-ray diffraction of Oz 1–Oz 10 ceramics is presented in Fig. 13. The results showed that quartz and hematite were the only minerals that resisted at 1000°C, with the appearance of newly formed phases such as Cristobalite, Trydimite, Anorthite, Albite, Anorthoclase, Hatrutite, Spinel and Ringwoodite. The destruction of clay minerals (montmorillonite and muscovite) had also been noticed. According to some authors, the structure of montmorillonite breaks down entirely at 900°C [62] which explains the reason for the formation of the new phases. The results indicate also that Quartz is the predominant phase in all ceramics except the Oz 4 based body that presents albite as the major phase. Otherwise, we can also notice that the spinel phase has appeared only in Oz 4 and Oz 5 specimens. It should be also mentioned that the predominance of quartz is probably due to the high weight content of silica (46.08–61.92%) in raw samples and confirmed by XRF.
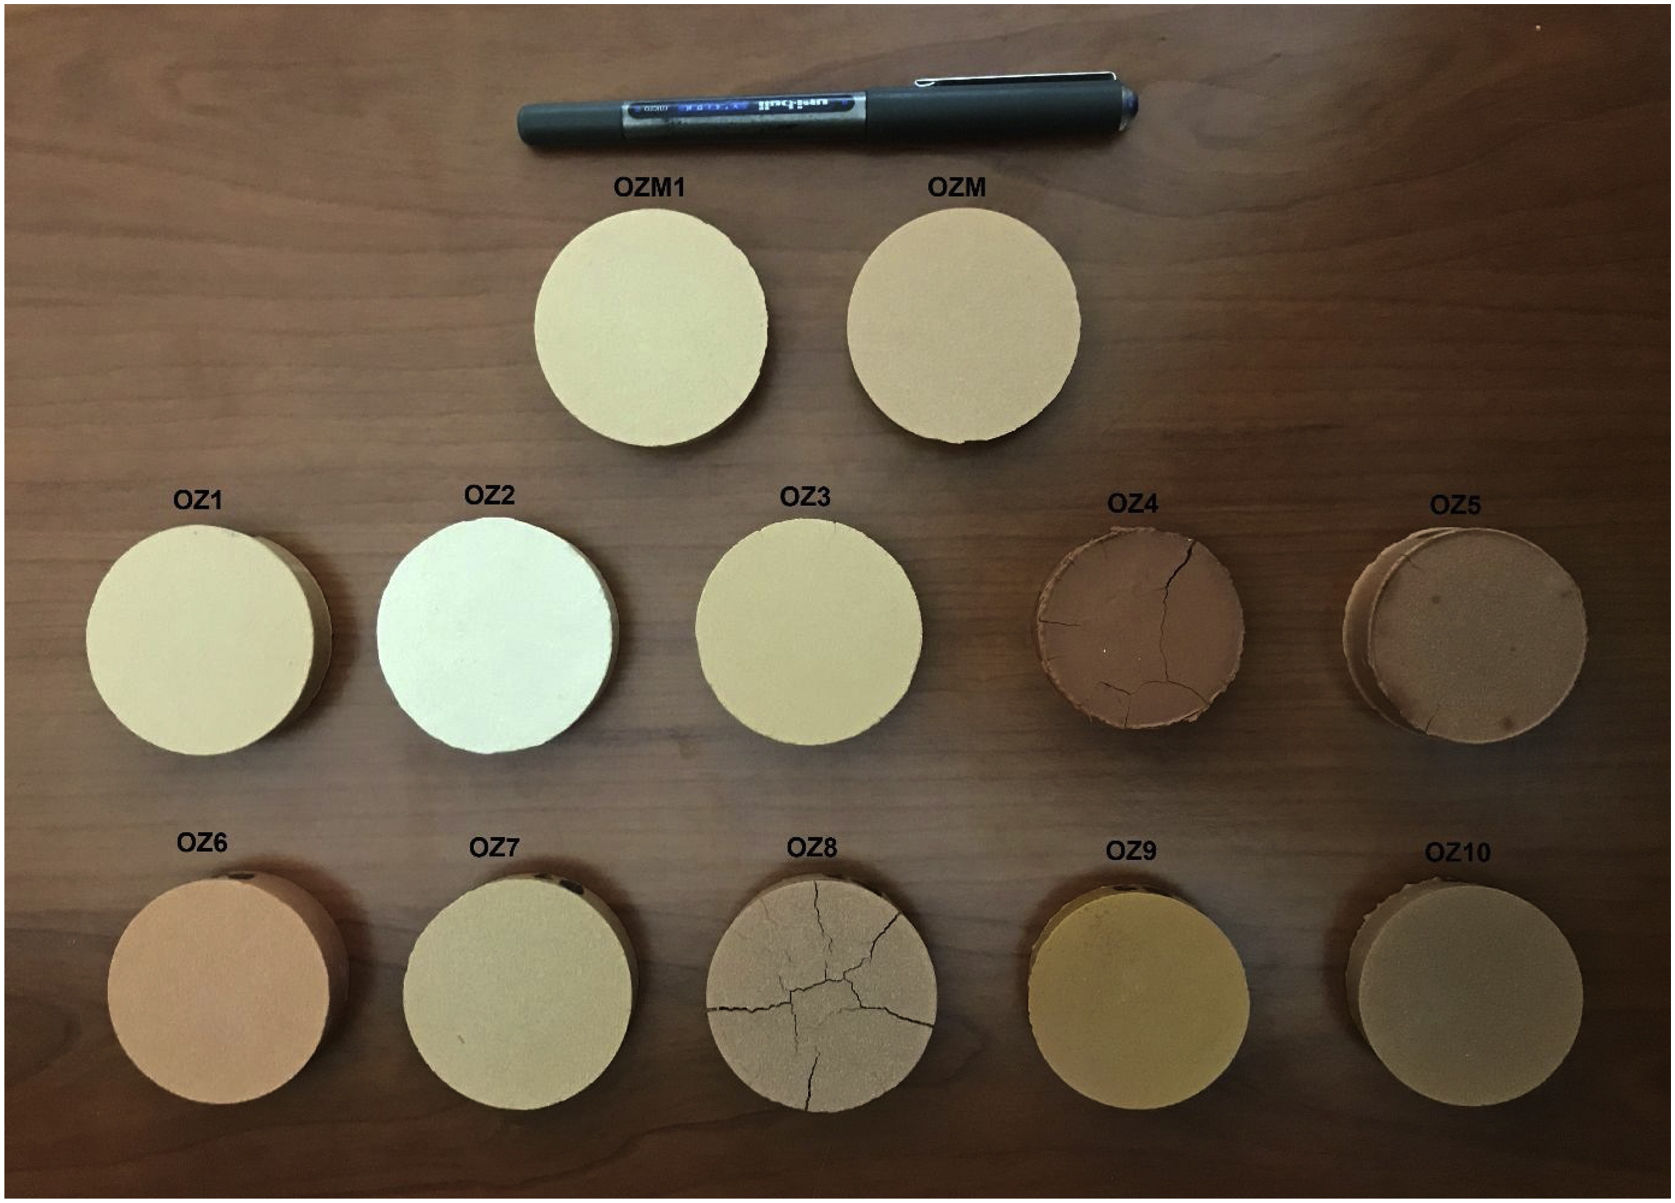
Macroscopic aspect of ceramics calcined at 1000°C. Q: Quartz; Cr: Cristobalite; T: Trydimite; At: Anorthite; A: Albite; An: Anorthoclase; He: Hematite; H: Hatrurite; Sp: Spinel; R: Ringwoodite.")
The fired ceramics at 1000°C (Oz 1–Oz 10) (Fig. 14) showed good physical appearances and are of good quality, without cracks, surface damages or deformation, except for ceramics based on Oz 4, Oz 5 and Oz 8 samples. These three ceramic bodies have shown low cohesion, surface cracks and a vitreous aspect, which is probably due to the abundance of feldspars and melting elements in raw samples allowing them to reach the melting point at lower temperatures. Otherwise, a difference in fired shrinkage has also been noticed visually in some ceramic bodies. To correct this problem, two mixtures were developed from these clay samples (Oz M: equimassic mixture of all the clay samples with a mass fraction of 1/10; Oz M1: a mixture of all the clay samples that showed a good physical cohesion after sintering with a mass fraction of 1/7). The developed ceramics showed a good physical cohesion in the final material form and good dimensional stability after thermal treatment (no cracks and/or no dimensional defects).
Technological properties of elaborated ceramics
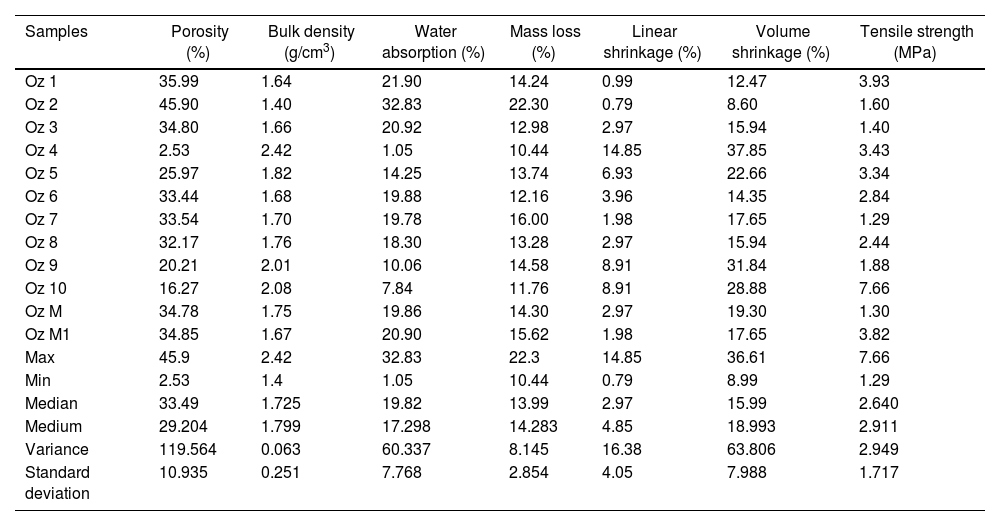
Technological properties of the fired ceramics (Oz 1–Oz 10, Oz M–Oz M1) are reported in Table 6. The results illustrate a close deviation in some prepared ceramics that is probably due to the close composition between the studied samples. All these ceramics (except Oz 4 and Oz 10) are classified in ceramic tiles by the ISO 13006 technical standard based on the water absorption data (>10%) in the BIII group (B for pressing method) [30,72], while ceramics-based Oz 4 and Oz 10 samples are respectively classified in BIIb and BIIa groups. The sintered ceramic Oz 10 has shown the greatest tensile strength (7.66MPa) compared to the other ceramics, moderate values 3.93–2.44MPa in Oz 1, Oz 4, Oz 5, Oz 6 and Oz 8, but the lowest mechanical strength (1.88–1.3MPa) were observed in Oz 9, Oz 2, Oz 3 and Oz 7. Nevertheless, important values of linear and volume shrinkages respectively are determined in Oz 4 (14.85%, 37.85%), Oz 5 (6.93%, 22.66%), Oz 9 (8.91%, 31.84%) and Oz 10 (8.91%, 28.88%). The apparent densities were observed between 1.4 and 2.42g/cm3. Otherwise, porosity was very high in Oz 2 (45.9%), Oz 1 (35.99%), Oz 3 (34.8%), Oz 6 (33.44%), Oz 7 (33.54%), Oz 8 (32.17%), moderate in Oz 5 (25.97%), Oz 9 (20.21%), Oz 10 (16.27%) and insignificant in Oz 4 (2.53%). More importantly, the developed ceramic mixtures (Oz M and Oz M1) have shown a good evolution in terms of these technological properties. The results showed a competitive character and especially close values in all parameters with only a favorable optimization in tensile strength for ceramic mixture Oz M1 (3.82MPa).
Technological results of ceramic bodies obtained after sintering at 1000°C.
| Samples | Porosity (%) | Bulk density (g/cm3) | Water absorption (%) | Mass loss (%) | Linear shrinkage (%) | Volume shrinkage (%) | Tensile strength (MPa) |
|---|---|---|---|---|---|---|---|
| Oz 1 | 35.99 | 1.64 | 21.90 | 14.24 | 0.99 | 12.47 | 3.93 |
| Oz 2 | 45.90 | 1.40 | 32.83 | 22.30 | 0.79 | 8.60 | 1.60 |
| Oz 3 | 34.80 | 1.66 | 20.92 | 12.98 | 2.97 | 15.94 | 1.40 |
| Oz 4 | 2.53 | 2.42 | 1.05 | 10.44 | 14.85 | 37.85 | 3.43 |
| Oz 5 | 25.97 | 1.82 | 14.25 | 13.74 | 6.93 | 22.66 | 3.34 |
| Oz 6 | 33.44 | 1.68 | 19.88 | 12.16 | 3.96 | 14.35 | 2.84 |
| Oz 7 | 33.54 | 1.70 | 19.78 | 16.00 | 1.98 | 17.65 | 1.29 |
| Oz 8 | 32.17 | 1.76 | 18.30 | 13.28 | 2.97 | 15.94 | 2.44 |
| Oz 9 | 20.21 | 2.01 | 10.06 | 14.58 | 8.91 | 31.84 | 1.88 |
| Oz 10 | 16.27 | 2.08 | 7.84 | 11.76 | 8.91 | 28.88 | 7.66 |
| Oz M | 34.78 | 1.75 | 19.86 | 14.30 | 2.97 | 19.30 | 1.30 |
| Oz M1 | 34.85 | 1.67 | 20.90 | 15.62 | 1.98 | 17.65 | 3.82 |
| Max | 45.9 | 2.42 | 32.83 | 22.3 | 14.85 | 36.61 | 7.66 |
| Min | 2.53 | 1.4 | 1.05 | 10.44 | 0.79 | 8.99 | 1.29 |
| Median | 33.49 | 1.725 | 19.82 | 13.99 | 2.97 | 15.99 | 2.640 |
| Medium | 29.204 | 1.799 | 17.298 | 14.283 | 4.85 | 18.993 | 2.911 |
| Variance | 119.564 | 0.063 | 60.337 | 8.145 | 16.38 | 63.806 | 2.949 |
| Standard deviation | 10.935 | 0.251 | 7.768 | 2.854 | 4.05 | 7.988 | 1.717 |
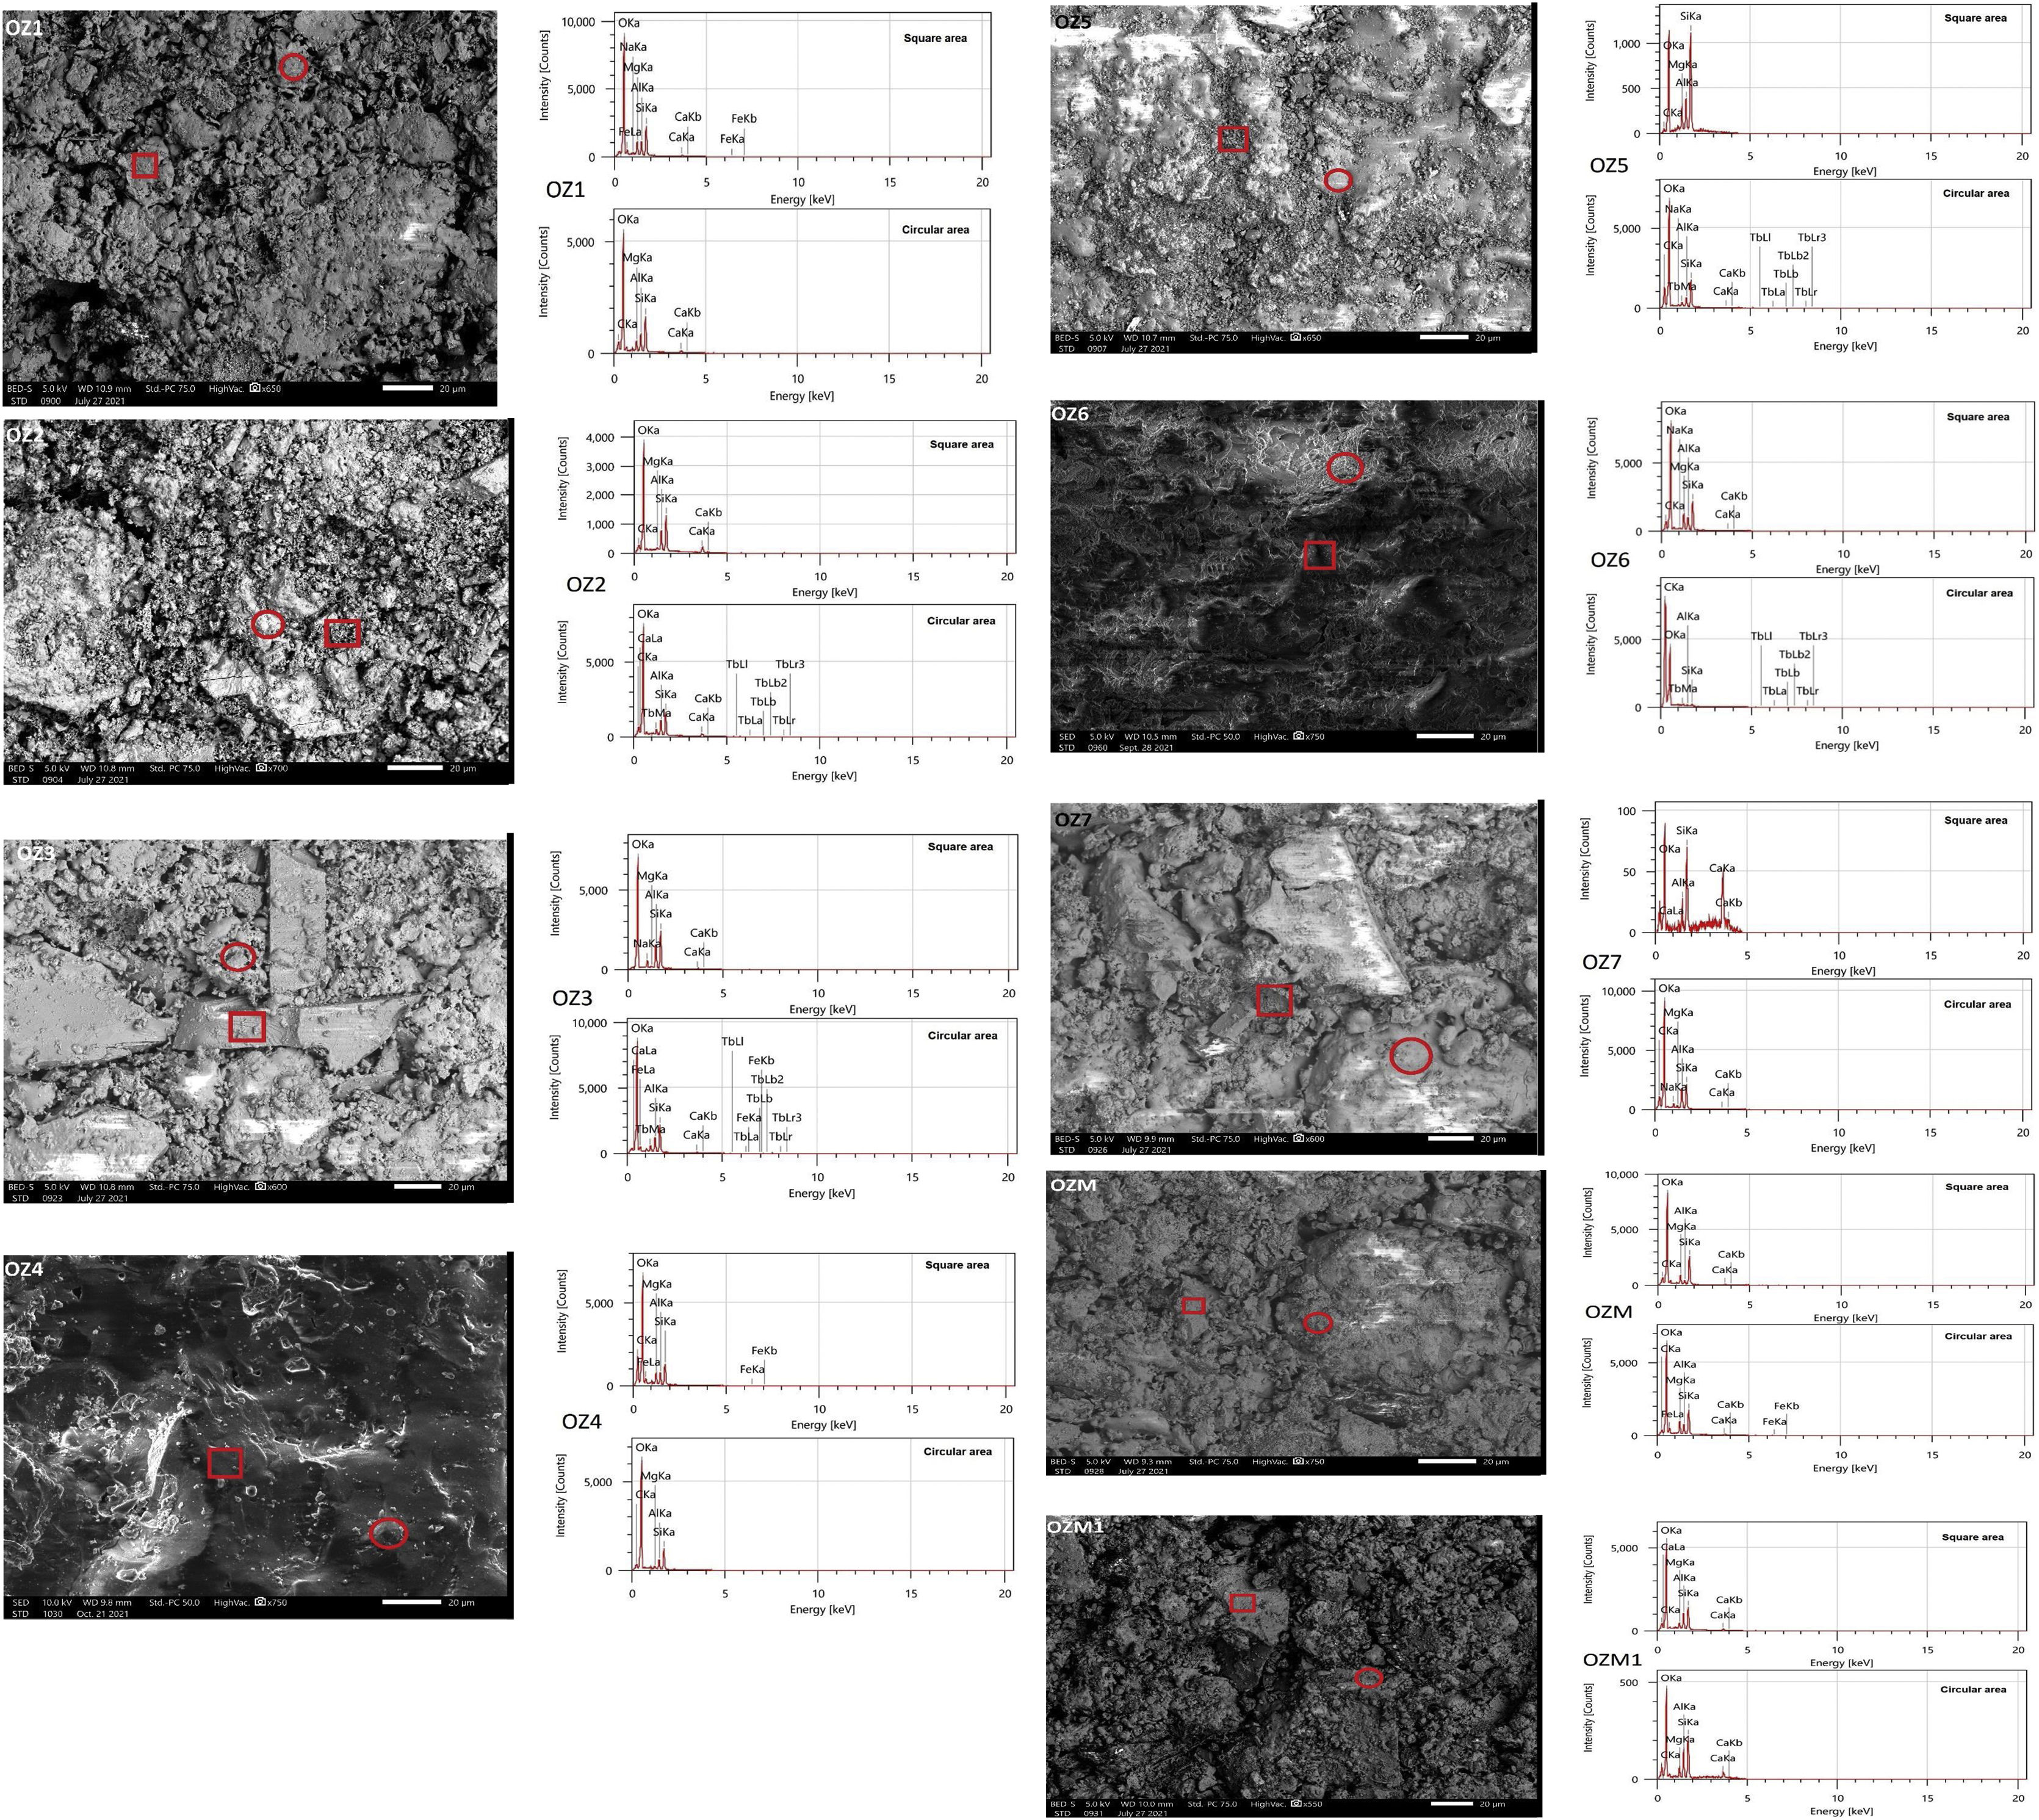
To investigate the morphological surface characteristics of ceramics, SEM-EDS analysis was performed on the 12 prepared bodies (Fig. 15). The micrographs illustrate the good densification of the surface (except Oz 1, Oz 2, Oz 3 and Oz M1) which is explained by the relative consolidation of the material after sintering at 1000°C. The formation of grain boundaries was seen within this temperature. Otherwise, the porous aspect was noticed in some bodies (Oz 1, Oz 2, Oz 3 and Oz M1) which is probably due to the decomposition of organic matter and carbonates as the main elements responsible for the creation of micropores in the studied ceramics. The melting phenomenon has clearly started at 1000°C in the Oz 4 based ceramic and is noticed by the low value of porosity (2.53%). According to EDS peaks, some ceramics had not presented a good chemical homogeneity which is revealed by the obtained composition in the two different marked areas on the same surface, this result was also investigated and confirmed by XRD through the appearance of the newly formed phases.
Conclusion.")
The results of this study show that the mineralogical composition of the studied bentonite samples consists mainly of quartz, calcite, montmorillonite and plagioclase. The chemical composition shows that the most abundant oxides in the studied samples are SiO2 (33.17–52.72%) and Al2O3 (13.66–26.20%). Scanning electron microscope observations show stacked overlaid layers and display aggregates of bentonite grains, spherical and with a heterogeneous dimension, with a remarkable compact structure. Plasticity results indicate that all studied samples are characterized with plasticity values comparable to that of calcic bentonites.
This study has successfully shown the efficiency of using the studied bentonite samples of Oued Zemmour region (Nador, Oriental Rif Morocco) in the ceramic field. The samples showed a good cohesion in the ceramic bodies after thermal treatment at 1000°C except for Oz 4, Oz 5 and Oz 8 samples that had represented some cracks in ceramic surfaces. According to ISO 13006 standard, the successfully formed ceramics are classified in the BIII group (water absorption data >10%). The mineralogical composition of ceramics indicates that Quartz and hematite are the only minerals resisted at 1000°C along with the formation of some other minerals. The developed BIII ceramic mixtures (Oz M and Oz M1) had represented close technological parameter values with a remarkable improvement in mechanical strength that is respectively 1.3 and 3.82MPa.
Conflict of interestsThe authors declare that they have no known competing financial interests or personal relationships that could have appeared to influence the work reported in this paper.
The authors declare the following financial interests/personal relationships which may be considered as potential competing interests.

