


Meat is one of the most perishable foods owing to its nutrient availability, high water activity, and pH around 5.6. These properties are highly conducive for microbial growth. Fresh meat, when exposed to oxygen, is subjected to the action of aerobic psychrotrophic, proteolytic, and lipolytic spoilage microorganisms, such as Pseudomonas spp. The spoilage results in the appearance of slime and off-flavor in food. In order to predict the growth of Pseudomonas fluorescens in fresh meat at different pH values, stored under refrigeration, and temperature abuse, microbial mathematical modeling was applied. The primary Baranyi and Roberts and the modified Gompertz models were fitted to the experimental data to obtain the growth parameters. The Ratkowsky extended model was used to determine the effect of pH and temperature on the growth parameter μmax. The program DMFit 3.0 was used for model adjustment and fitting. The experimental data showed good fit for both the models tested, and the primary and secondary models based on the Baranyi and Roberts models showed better validation. Thus, these models can be applied to predict the growth of P. fluorescens under the conditions tested.
Fresh meat is a highly perishable product owing to its high nutritious content. Many interrelated factors influence the shelf life and freshness of meat such as storage temperature, atmospheric oxygen (O2), endogenous enzymes, moisture, light and most importantly, micro-organisms.1 Therefore, meat is a complex niche with particular physicochemical characteristics that allow colonization and development of a wide variety of organisms,2 making it highly susceptible to be contaminated by spoilage bacteria.3 Microbial spoilage can lead to food disposal and consequent economic losses to the industry and a decrease in consumer trust.4
Various conservation methods are available to increase the shelf life of fresh meat including refrigeration.5 The use of cold temperatures, such as refrigeration and freezing, is considered the most effective method of retarding or inhibiting microbial growth in meat products during transportation or storage for maintaining product quality and extending shelf life.6 The use of refrigeration to preserve food is based on the reduced rate of metabolism in microorganisms at low temperatures.7 The rate of enzyme-catalyzed reactions is temperature dependent, and considerably slows down at low temperatures. Therefore, it is extremely important to control and maintain the refrigeration temperature within the acceptable limits to ensure the security and integrity, and to extend the shelf life of meat products.8
However, even in cold stored meat, the organoleptic spoilage by microbial consumption of meat nutrients, such as sugars and free amino acids, and the release of undesired volatile metabolites cannot be eliminated completely. These activities may be performed at low temperatures by psychrotrophic bacteria compromising preserving effect of low temperature.5 These microorganism can thrive well at low temperatures via modifying their cytoplasmic membrane and increasing the unsaturated fatty acids levels, which keep the membrane in semifluid state, thereby facilitating the transport of nutrients and enzymes.9 Their ability to grow at low temperatures is one of the challenges to the meat industry while considering the meat quality and public health.10
Pseudomonas spp. stand out among the psychotropic microorganisms, particularly, those involved in the spoilage of meat stored at low temperatures.11 They are Gram-negative, aerobic, proteolytic and lipolytic microorganisms mostly associated with the deterioration of fresh meat. The most commonly found pseudomonas in meat is Pseudomonas fluorescens, which is characterized by producing a soluble pigment called pyoverdine.
Predictive microbiology can be used to assess the quality of food susceptible to deterioration by these spoiling microorganisms considering the fact that the behavior of the microbial population and its effect on environment can be predicted, as its status is known at any given time.12 Thus, predictive models can be used to predict product quality and microbiological safety considering the product characteristics and processing and storage conditions.13
This study aimed to construct and validate the mathematical models for predicting P. fluorescens growth at different temperatures and pH conditions.
Material and methodsInoculum standardization and maintenanceFreeze-dried P. fluorescens strain ATCC 13525 was stored at −18°C in a freezing medium containing 15mL glycerol, 0.5g bacteriological peptone, 0.3g yeast extract, 0.5g NaCl, and 100mL distilled water. Prior to use, the strain was activated in brain heart infusion (BHI) broth (HiMedia, Mumbai, India) and incubated at 28°C for 24h to obtain the number of cells necessary for standardization.
Effect of storage temperature and pH of the medium on the growth of P. fluorescens in meat brothAliquots of the standardized inoculum were transferred to 100mL meat broth (10g meat extract, 10g meat peptone, 5g tryptone, and 5g glucose in 1L water) at a final concentration of 104CFUmL−1, and incubated at 4°C, 7°C, and 12°C.
The pH of the medium was adjusted to 5.5, 6.0, and 6.3 with 2M NaOH or 2M HCl using a digital pH meter (Digimed DM20, Campo Grande, Brazil).
The growth of P. fluorescens at each pH and temperature condition (4°C and pH 5.5; 4°C and pH 6.0; 4°C and pH 6.3; 7°C and pH 5.5; 7°C and pH 6.0; 7°C and pH 6.3; 12°C and pH 5.0; 12°C and pH 6.0; and 12°C and pH 6.3) was monitored at 3, 6, 9, 12, 24, 30, 36, 48, 54, 60, 72, 84, 96, 108, and 120h of incubation. At each interval, an aliquot of 1mL was transferred to a tube containing 9mL of 0.1% (w/v) peptone water, and was serially diluted. Subsequently, a 0.01-mL aliquot from appropriate dilutions was taken and plated on Trypticase Soy Agar (TSA) plates (HiMedia, Mumbai, India) by microdrop technique. The plates were incubated at 28°C for 24h, and the colonies were counted.
Analysis of growth data for obtaining modelsThe model for P. fluorescens growth in meat broth was developed using the two-stage methodology. In the first stage, the maximum specific growth rate (μmax), and the lag phase (λ) were calculated for each experimental combination. The growth parameters were obtained by the modified Gompertz and Baranyi and Roberts equation to the experimental data by using DMFit 3.0 program. In the second stage, the estimates obtained for μmax were adjusted for the extended Ratkowsky model to determine the effect of temperature and pH on the maximum specific growth rate of P. fluorescens, according to the following equation:
where a is the regression constant, and pHmim, Tmim are the minimum pH and minimum temperature, respectively, estimated theoretically for the microbial growth.Validation of the results by statistical analysis of models
The following statistical parameters were calculated for the validation of the models: correlation coefficient (R2), mean square error (RMSE), bias factor, and accuracy factor.14 The correlation coefficient (R2) describes the model fit throughout the length of the curve; the closer the value of R2 is to one, the better the model fit is.
The mean square error (RMSE) is given by Eq. (2), and presents the model error relative to the data, that is, how close are the predicted values to the observed values; where the closer to zero indicates a better fit.
where valueobs is the experimental value, valuepred is the value predicted by the model, SQR is the sum of square residuals, and n is the number of degrees of freedom (number of data points−number of model parameters).
The bias factor shown in Eq. (3) gives the same weight to the average values that over- or underestimates the average, that is, an average relative deviation.
where valueobs is the experimental value, valuepred is the value predicted by the model, and n is the number of data points minus the number of model parameters.
The accuracy factor is the most reliable and accurate statistical measurement, as it uses both, the predicted and observed values, and determines the percentage prediction error. This factor takes into account only the absolute values. The closer the value is to 1, the lower the percentage error is. The calculation factor is corrected by Eq. (4).
where valueobs is the experimental value; valuepred is the value predicted by the model, and n is the number of data points minus the number of model parameters.Results and discussionPrimary growth model of P. fluorescens in meat broth
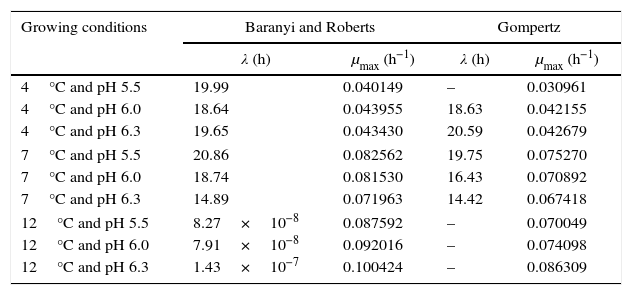
Table 1 shows the growth parameters for P. fluorescens at three different temperatures and pH values.
Growth parameters of P. fluorescens in meat broth at 4°C, 7°C, and 12°C, and pH 5.5, 6.0, and 6.3.
| Growing conditions | Baranyi and Roberts | Gompertz | ||
|---|---|---|---|---|
| λ (h) | μmax (h−1) | λ (h) | μmax (h−1) | |
| 4°C and pH 5.5 | 19.99 | 0.040149 | – | 0.030961 |
| 4°C and pH 6.0 | 18.64 | 0.043955 | 18.63 | 0.042155 |
| 4°C and pH 6.3 | 19.65 | 0.043430 | 20.59 | 0.042679 |
| 7°C and pH 5.5 | 20.86 | 0.082562 | 19.75 | 0.075270 |
| 7°C and pH 6.0 | 18.74 | 0.081530 | 16.43 | 0.070892 |
| 7°C and pH 6.3 | 14.89 | 0.071963 | 14.42 | 0.067418 |
| 12°C and pH 5.5 | 8.27×10⁻⁸ | 0.087592 | – | 0.070049 |
| 12°C and pH 6.0 | 7.91×10⁻⁸ | 0.092016 | – | 0.074098 |
| 12°C and pH 6.3 | 1.43×10⁻⁷ | 0.100424 | – | 0.086309 |
λ, duration of lag phase; μmax, maximum specific growth rate.
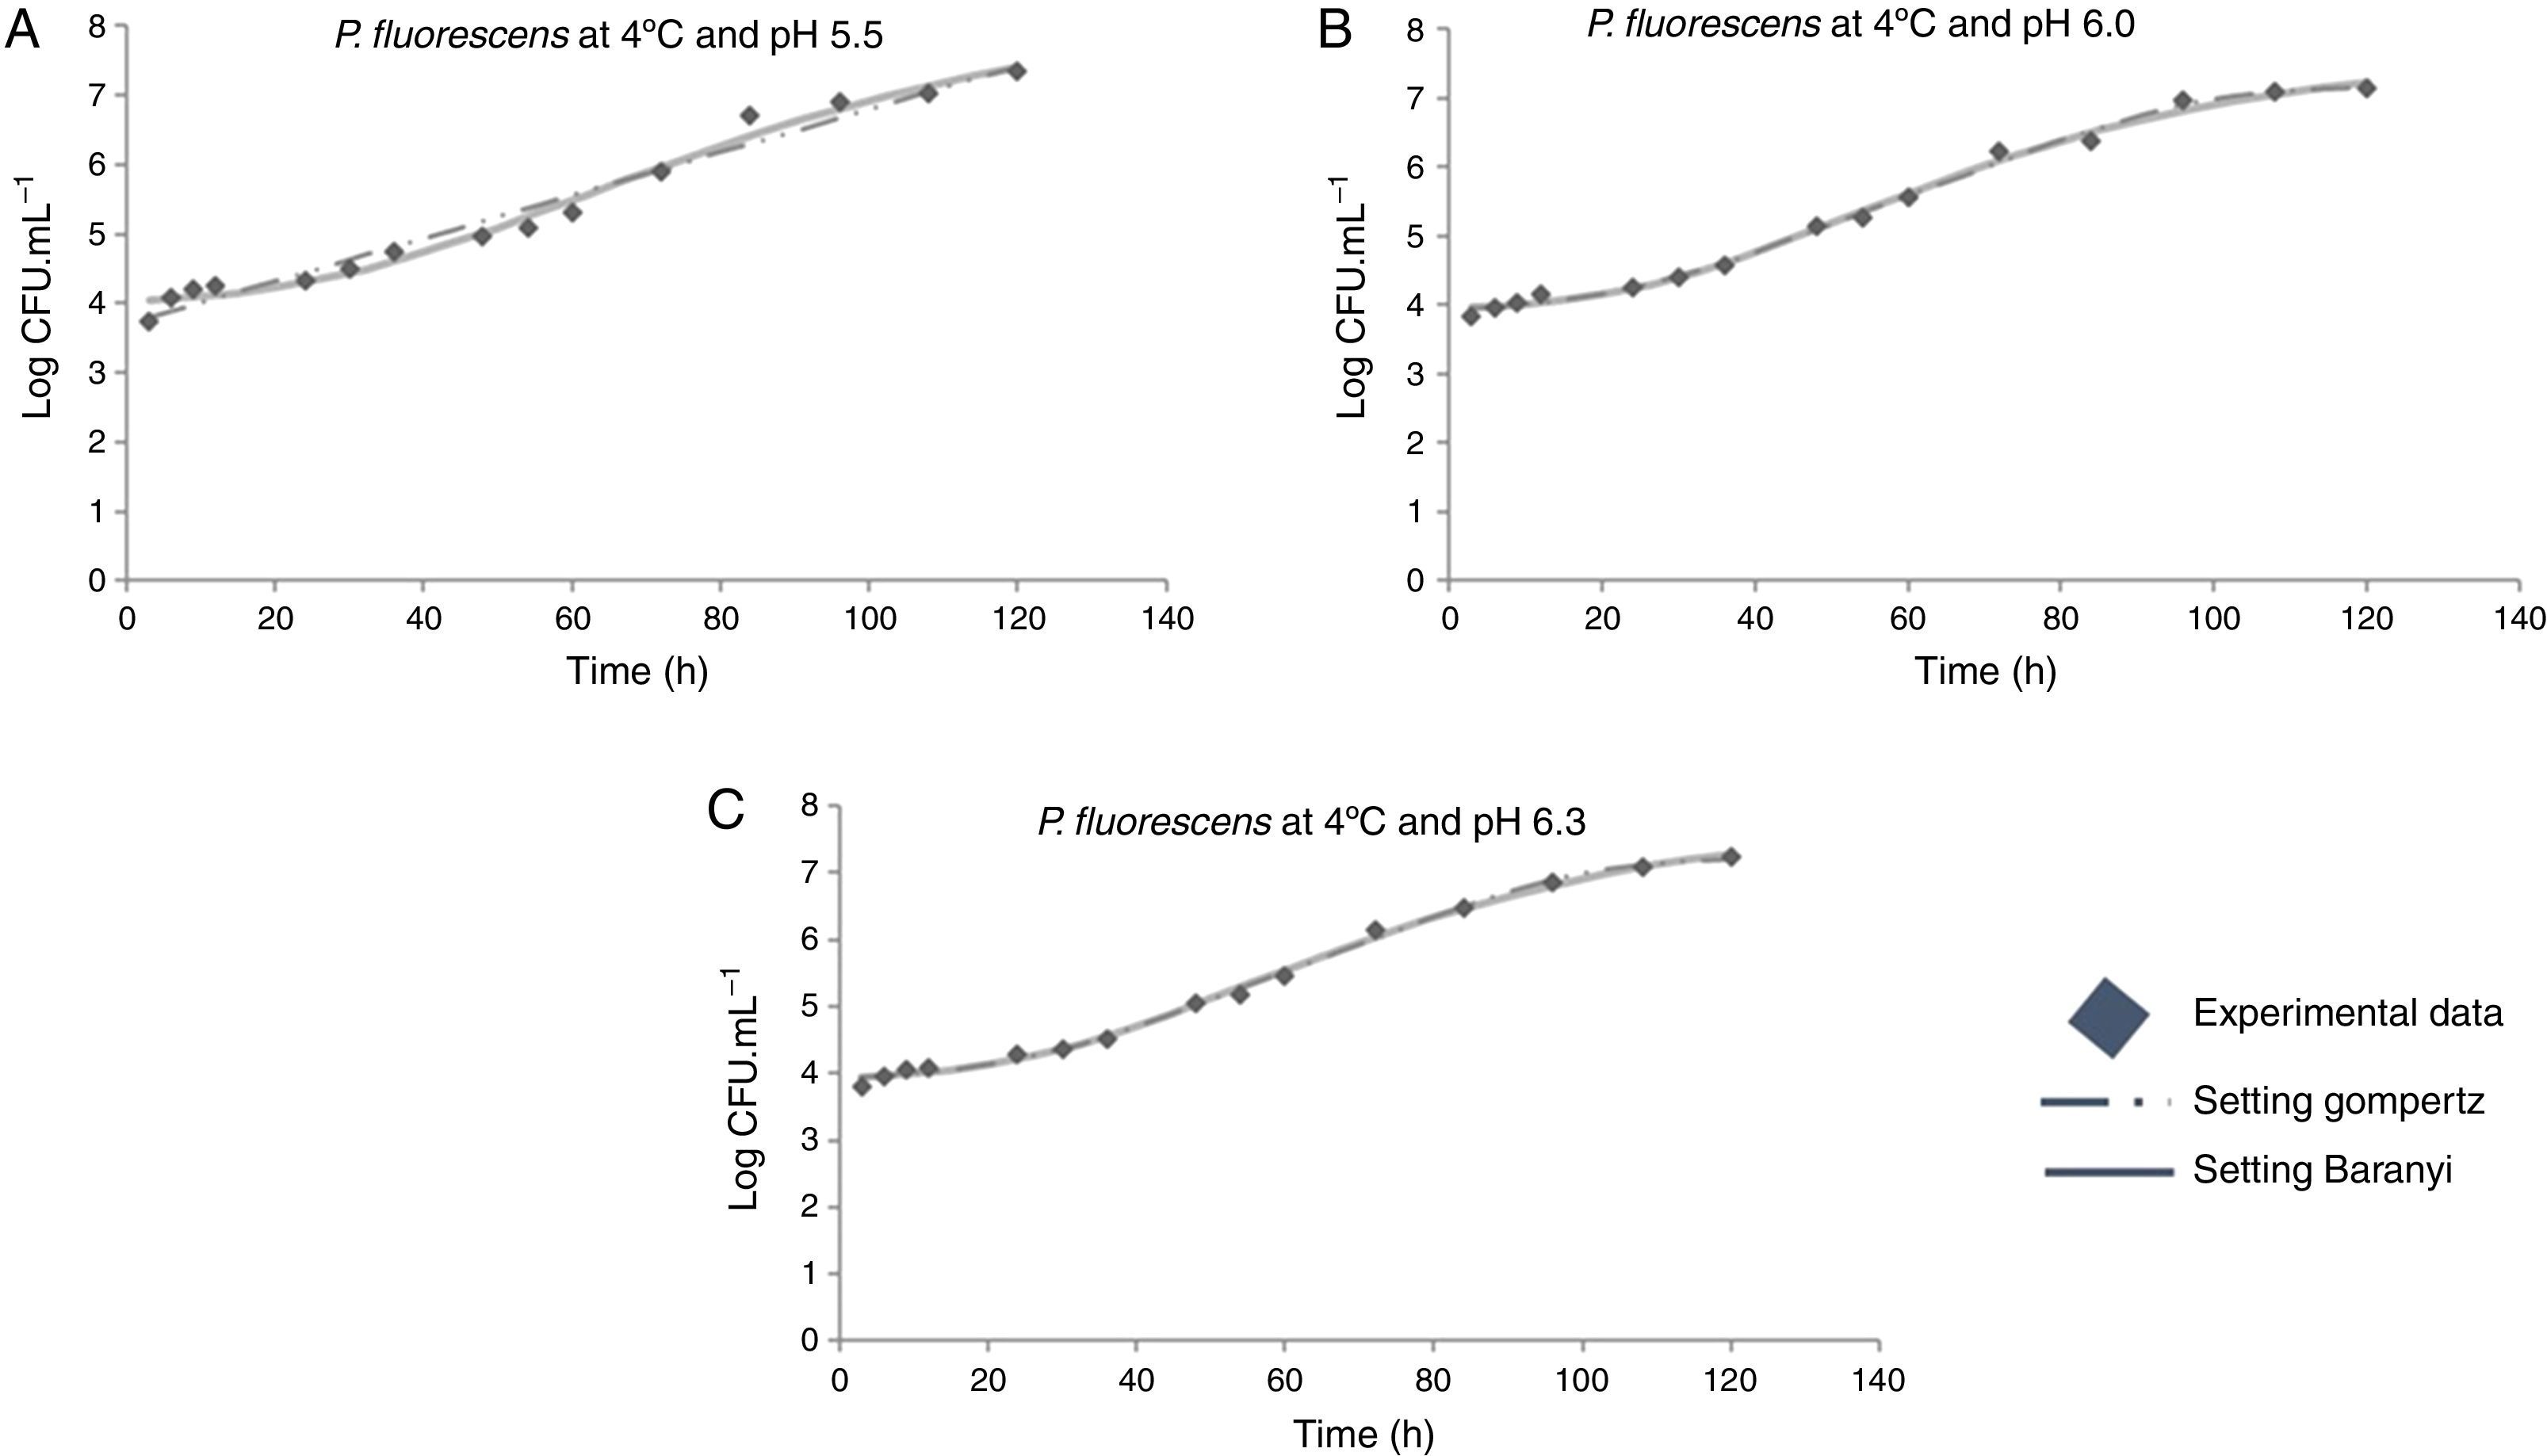
The modeled growth parameters in Table 1 show that, in general, different pH values did not affect the growth of P. fluorescens at a given temperature. This is evident, for example, considering the concentration of 5logCFUmL−1, when the deterioration process starts. This concentration of population is reached in about 50h at all temperatures, regardless of the pH value (Fig. 1).
, pH 6.0 (B), and pH 6.3 (C).")
The final meat pH can vary from 5.5 to 7.0, and is highly dependent on the amount of glycogen present in the tissue at the time of slaughter, since it turns into lactic acid after slaughter.15 The final pH value directly affects microbial growth,16 as at low pH, weak acids in the undissociated form can pass through the plasma membrane of the microorganism. Then, the acid dissociates by consuming ATP, releasing protons, and stabilizing pH; this results in cell death.17 On the other hand, when food is stored under aerobic conditions, the pH tends to increase, leading the total cell counts greater than 107CFUmL−2. These changes are caused possibly due to the formation of basic substances synthesized mainly during the pseudomonas growth.18 However, this relationship between the increased microbial growth rate and higher pH values was observed only at 12°C. An earlier study investigated the microbiological deterioration of ground beef at a pH range from 5.34 to 6.13, and found a significant effect of meat pH on the growth kinetic parameters of pseudomonas.19 In contrast, some other studies16,20 reported that, depending on the conditions, pH might not have effect on microbial growth in a range close to that employed in this work.
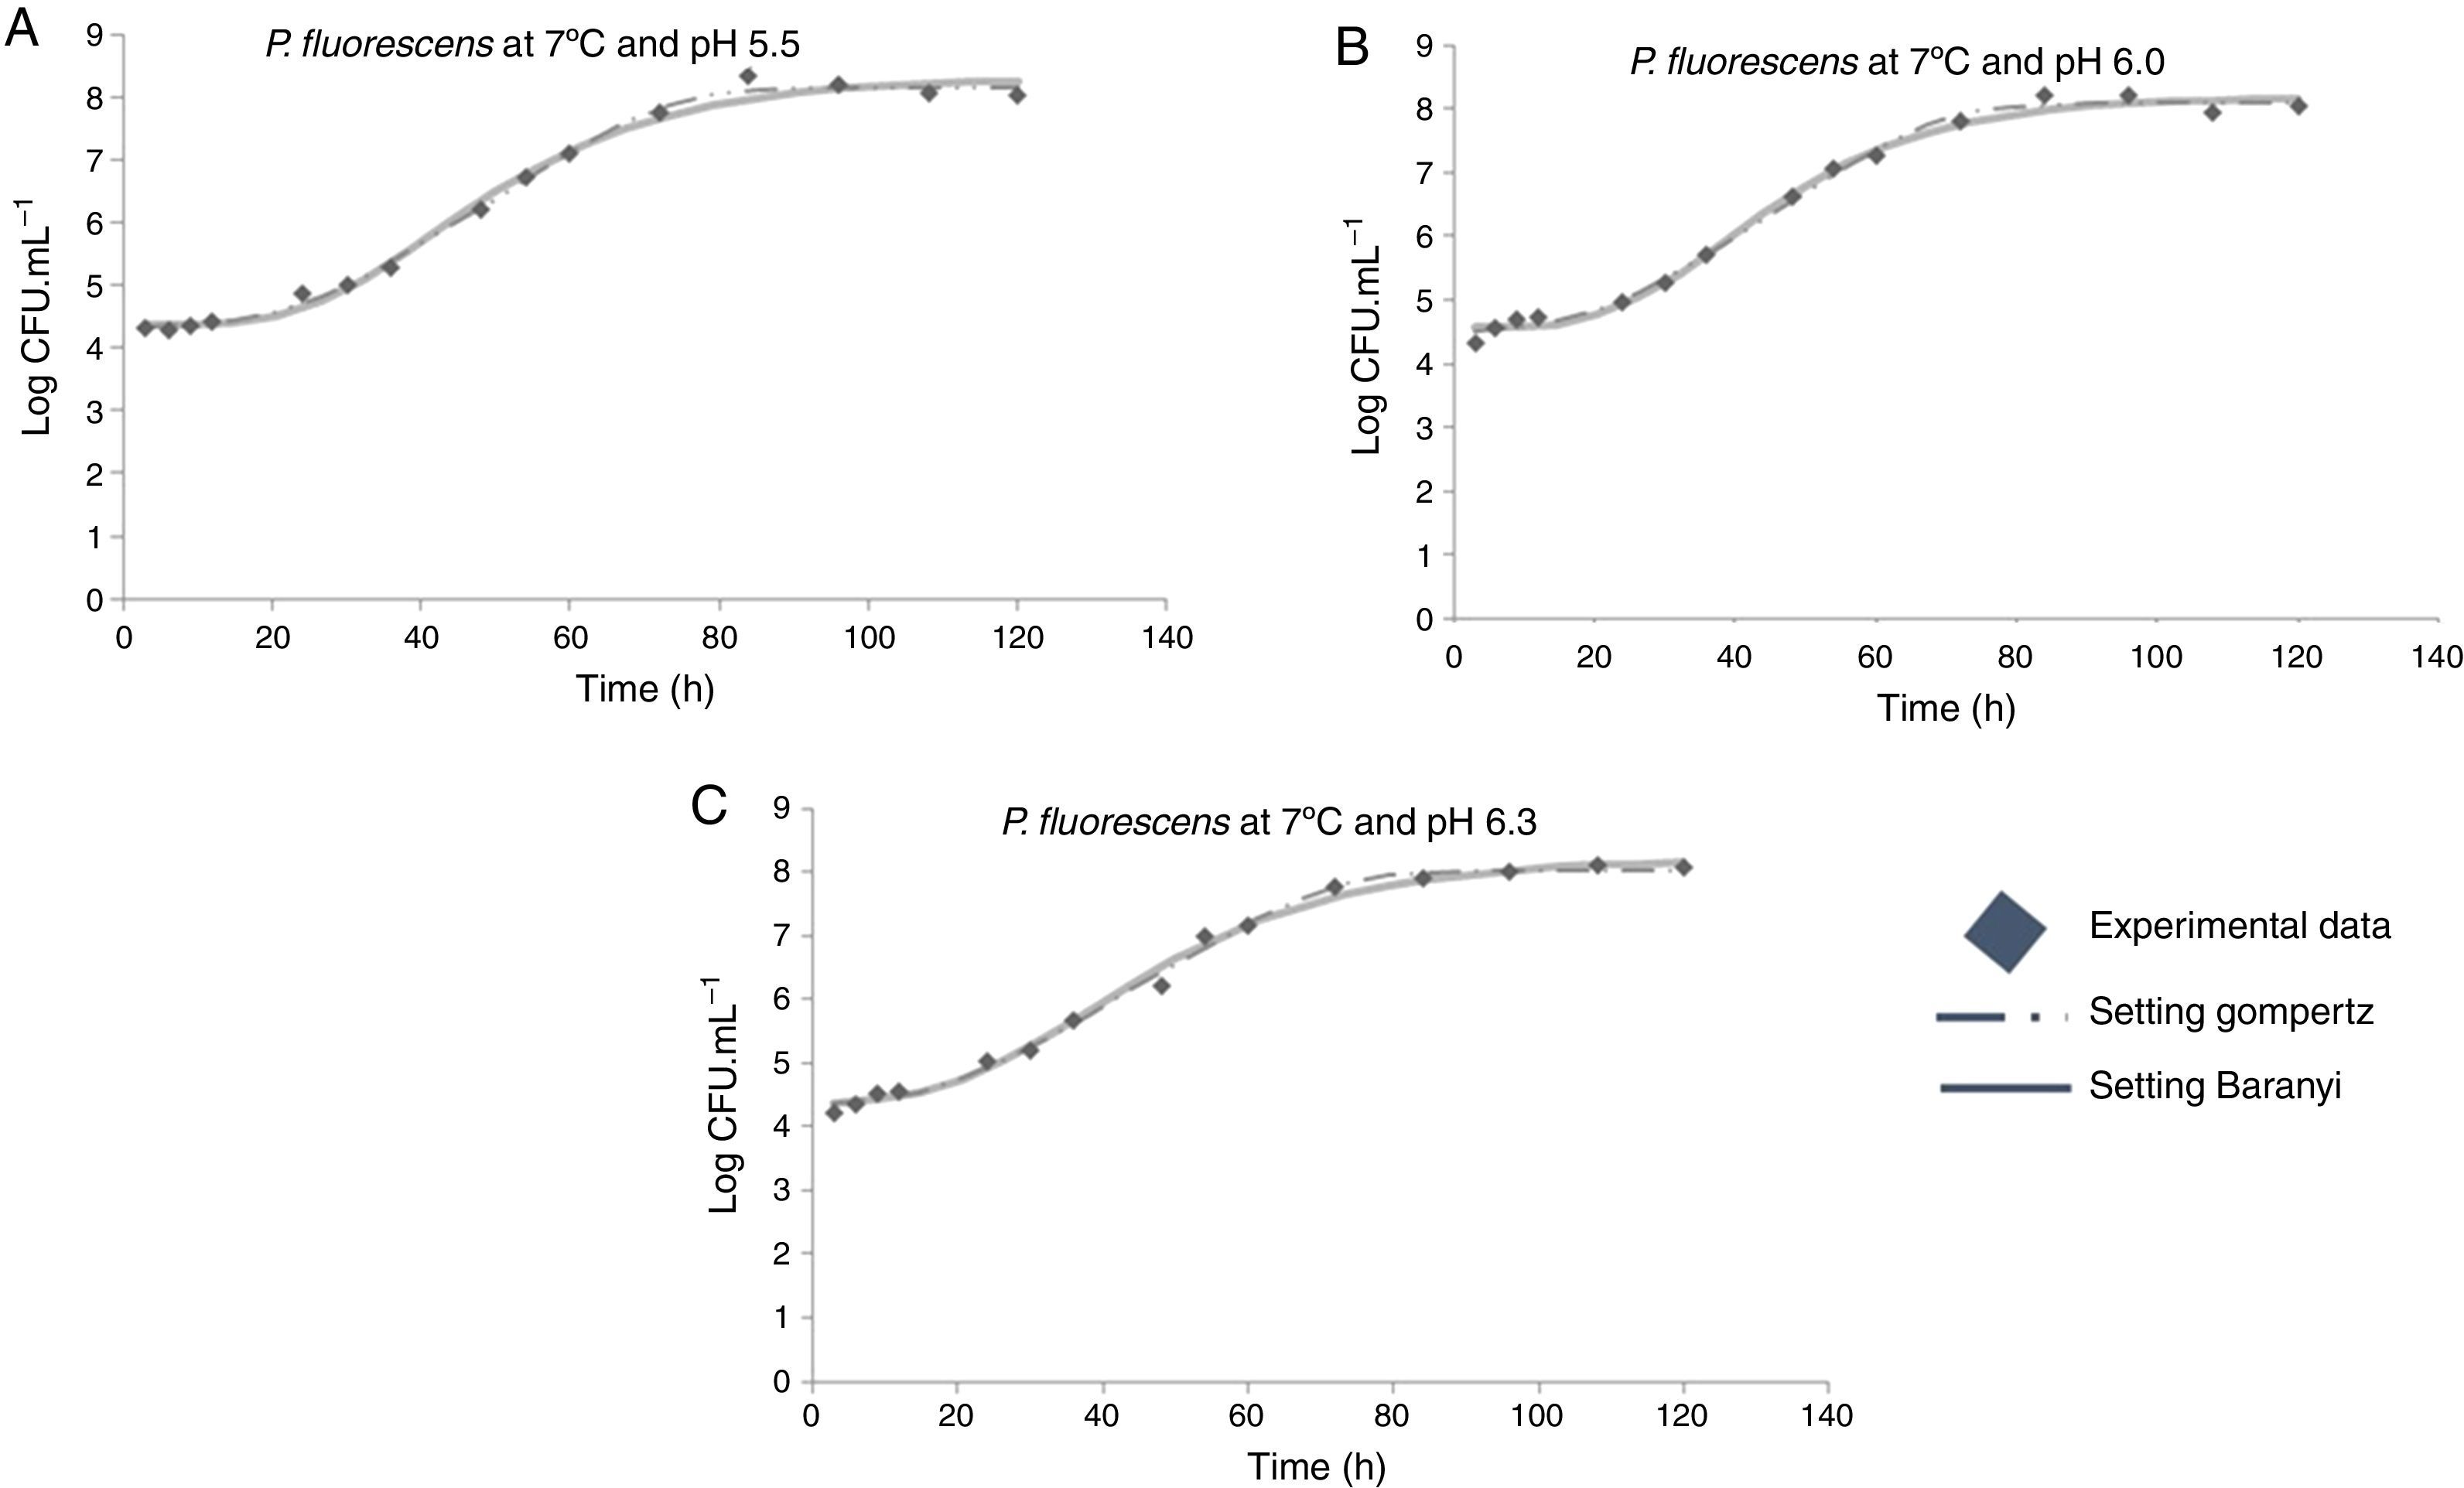
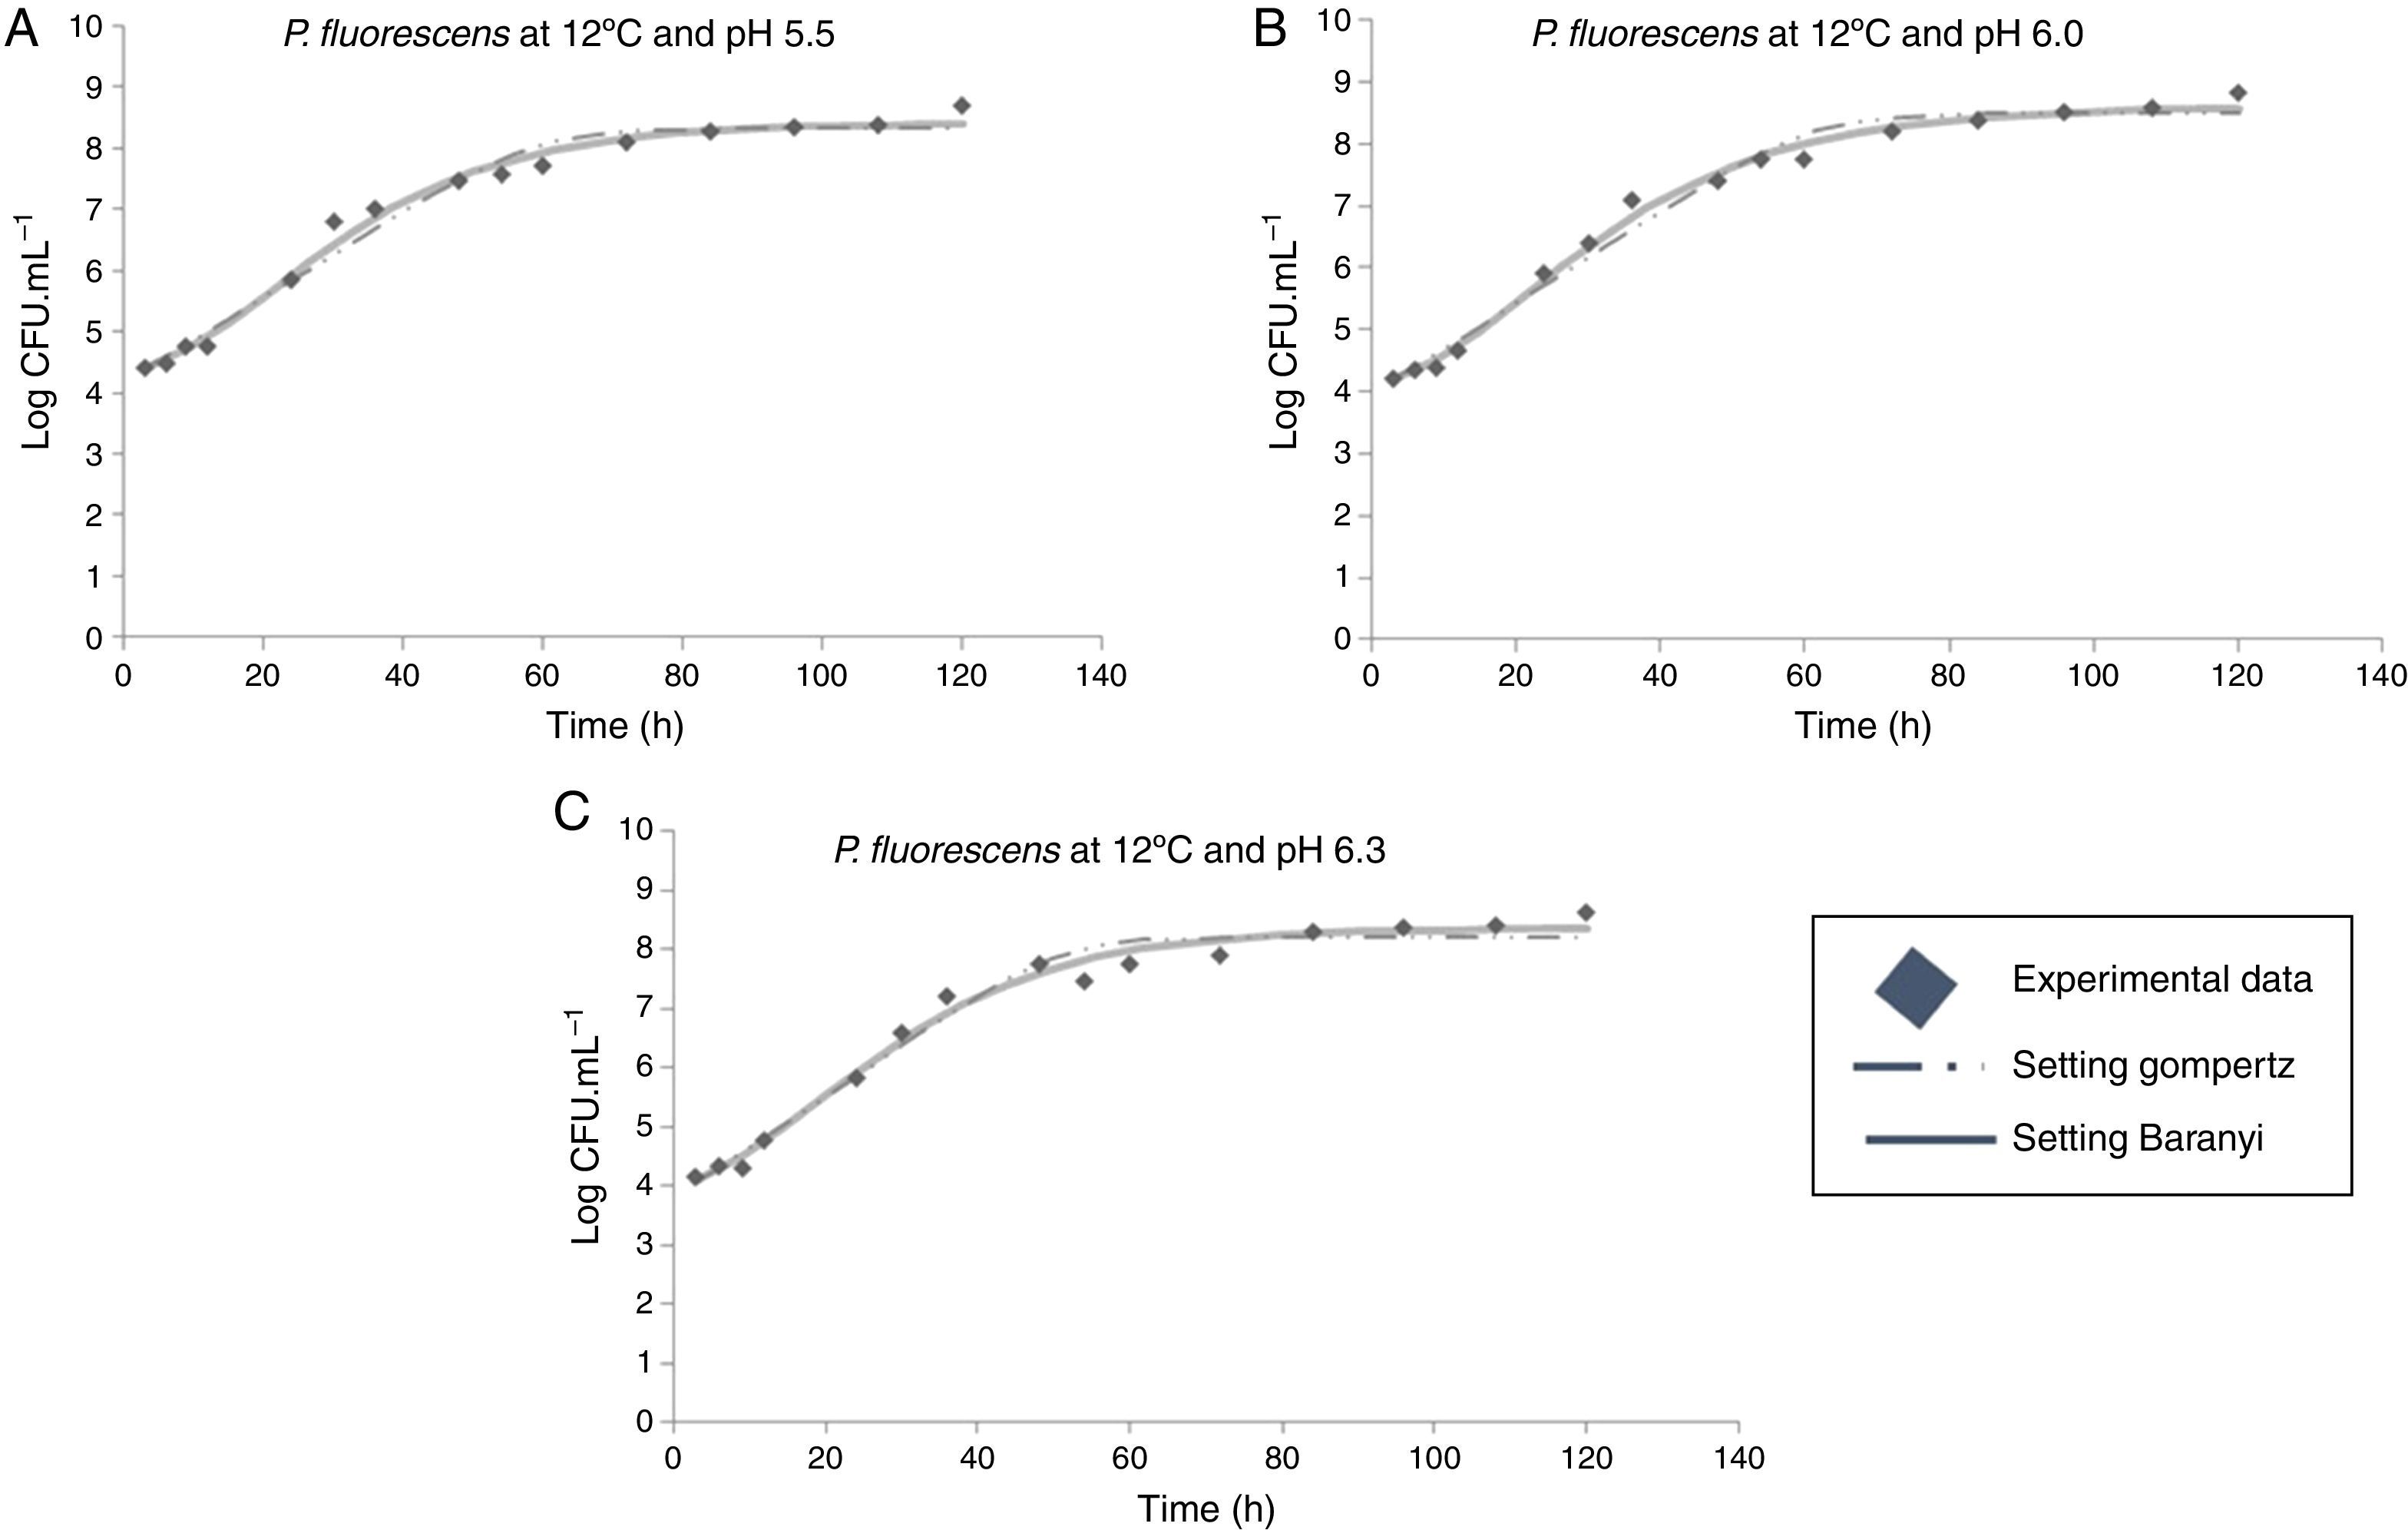
Moreover, it was observed that the increase in storage temperature from 4°C to 12°C led to a decrease in the lag phase and an increase in the exponential phase. This behavior led to a population concentration of about 6logCFUmL−1 after 70, 40, and 24h, at 4°C, 7°C, and 12°C, respectively, independent of the pH value (Figs. 1–3).
, pH 6.0 (B), and pH 6.3 (C).")
, pH 6.0 (B), and pH 6.3 (C).")
A study investigated the prediction of shelf life of pork, and found that the total viable count reached 6logCFUmL−1 after 25h, 60h, and 100h at 15°C, 7°C, and 4°C, respectively.21
As shown in Table 1, a higher lag phase was observed at 7°C and pH 5.5 by the adjustment of the two primary models to the experimental data. Moreover, the lag phase (λ) was lower at the highest pH (6.3) tested, probably because most bacteria grow best in an environment having pH near to neutral (7.0). However, despite the growing conditions at 7°C, a higher lag phase was observed at more acidic pH (5.5), and the same was also observed for μmax. This behavior is opposite of that observed by other authors, as Gospavic et al.22 and Koutsomanis et al.23 found that at a higher lag phase, the maximum growth rate was lower. It is important to mention that these authors used a higher temperature range of 0–15°C and 0–20°C, compared to the one used in this work. It is noteworthy that the findings of Gospavic et al.22 have shown that the growth of Pseudomonas spp. adjusted to the modified Gompertz model presented a higher lag phase at 2°C and 4°C, corroborating the increase in μmax. The decrease in λ and the increase in μmax become clear when the values at 2°C and 4°C are compared with those obtained at 15°C and 20°C. The maximum tested value in this work was 12°C.
At 12°C, the estimated λ values adjusted by the Baranyi and Roberts model to the experimental data were very low. In contrast, these values were not estimated by the modified Gompertz model, evidencing no lag phase at 12°C.
With respect to the temperature increase from 7°C to 12°C, although a decrease in lag phase was observed, no significant changes were observed for the maximum specific growth rate, as can be seen in Table 1. At a greater range of growing conditions such as 4°C and 12°C, the λ values significantly decreased, while μmax increased considerably.
The modified Gompertz model could not estimate the λ value either for the growing condition at 4°C and pH 5.5 or at 12°C. As the P. fluorescens culture was activated before being inoculated in meat broth, the lag phase might have been suppressed. In addition, the Gompertz model does not consider the adaptation phase (lag phase), but only the increase in the number of cells within the exponential growth.15 Therefore, in some growth conditions, this phase could not be estimated by this model.
In the combined effect of the pH and incubation temperature on P. fluorescens growth, in general, higher temperature and higher pH result in the higher specific growth rate but lower lag phase. Thus, meat with initial pH closer to neutral and stored under temperature abuse may have short shelf life.
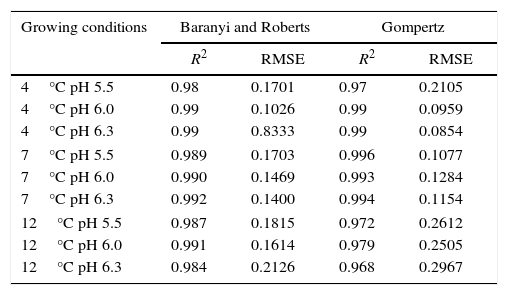
Table 2 shows the coefficient of determination (R2) and the root mean square error (RMSE) for the primary models.
R2 and RMSE of primary growth model for P. fluorescens.
| Growing conditions | Baranyi and Roberts | Gompertz | ||
|---|---|---|---|---|
| R2 | RMSE | R2 | RMSE | |
| 4°C pH 5.5 | 0.98 | 0.1701 | 0.97 | 0.2105 |
| 4°C pH 6.0 | 0.99 | 0.1026 | 0.99 | 0.0959 |
| 4°C pH 6.3 | 0.99 | 0.8333 | 0.99 | 0.0854 |
| 7°C pH 5.5 | 0.989 | 0.1703 | 0.996 | 0.1077 |
| 7°C pH 6.0 | 0.990 | 0.1469 | 0.993 | 0.1284 |
| 7°C pH 6.3 | 0.992 | 0.1400 | 0.994 | 0.1154 |
| 12°C pH 5.5 | 0.987 | 0.1815 | 0.972 | 0.2612 |
| 12°C pH 6.0 | 0.991 | 0.1614 | 0.979 | 0.2505 |
| 12°C pH 6.3 | 0.984 | 0.2126 | 0.968 | 0.2967 |
For all growing conditions shown in Table 2, the primary models showed good fit to the experimental data, with R2 values very close to 1; and low RMSE values demonstrated that the predicted values are close to the observed values, which ensure the validation of data. Gospavic et al.22 modeled the growth of Pseudomonas spp. in poultry at different temperature conditions, and also found good fit to the data by the Baranyi and Roberts and the modified Gompertz models.
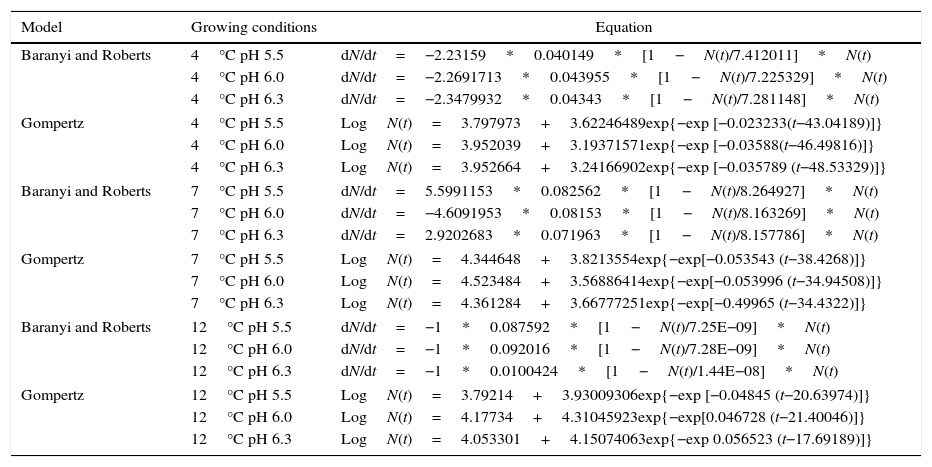
Table 3 shows the Baranyi and Roberts and the modified Gompertz models for P. fluorescens at 4°C, 7°C, and 12°C, and pH 5.5, 6.0, and 6.3.
The Baranyi and Roberts and the modified Gompertz growth models for P. fluorescens at 4°C, 7°C and 12°C, and pH 5.5, 6.0, and 6.3.
| Model | Growing conditions | Equation |
|---|---|---|
| Baranyi and Roberts | 4°C pH 5.5 | dN/dt=−2.23159*0.040149*[1−N(t)/7.412011]*N(t) |
| 4°C pH 6.0 | dN/dt=−2.2691713*0.043955*[1−N(t)/7.225329]*N(t) | |
| 4°C pH 6.3 | dN/dt=−2.3479932*0.04343*[1−N(t)/7.281148]*N(t) | |
| Gompertz | 4°C pH 5.5 | LogN(t)=3.797973+3.62246489exp{−exp [−0.023233(t−43.04189)]} |
| 4°C pH 6.0 | LogN(t)=3.952039+3.19371571exp{−exp [−0.03588(t−46.49816)]} | |
| 4°C pH 6.3 | LogN(t)=3.952664+3.24166902exp{−exp [−0.035789 (t−48.53329)]} | |
| Baranyi and Roberts | 7°C pH 5.5 | dN/dt=5.5991153*0.082562*[1−N(t)/8.264927]*N(t) |
| 7°C pH 6.0 | dN/dt=−4.6091953*0.08153*[1−N(t)/8.163269]*N(t) | |
| 7°C pH 6.3 | dN/dt=2.9202683*0.071963*[1−N(t)/8.157786]*N(t) | |
| Gompertz | 7°C pH 5.5 | LogN(t)=4.344648+3.8213554exp{−exp[−0.053543 (t−38.4268)]} |
| 7°C pH 6.0 | LogN(t)=4.523484+3.56886414exp{−exp[−0.053996 (t−34.94508)]} | |
| 7°C pH 6.3 | LogN(t)=4.361284+3.66777251exp{−exp[−0.49965 (t−34.4322)]} | |
| Baranyi and Roberts | 12°C pH 5.5 | dN/dt=−1*0.087592*[1−N(t)/7.25E−09]*N(t) |
| 12°C pH 6.0 | dN/dt=−1*0.092016*[1−N(t)/7.28E−09]*N(t) | |
| 12°C pH 6.3 | dN/dt=−1*0.0100424*[1−N(t)/1.44E−08]*N(t) | |
| Gompertz | 12°C pH 5.5 | LogN(t)=3.79214+3.93009306exp{−exp [−0.04845 (t−20.63974)]} |
| 12°C pH 6.0 | LogN(t)=4.17734+4.31045923exp{−exp[0.046728 (t−21.40046)]} | |
| 12°C pH 6.3 | LogN(t)=4.053301+4.15074063exp{−exp 0.056523 (t−17.69189)]} | |
Once validated, the equations (Table 3) can be used for prediction of P. fluorescens growth in meat broth under the conditions tested.
Therefore, for the growing conditions employed in this study, it is possible to assess the cell concentration rate over time using the equations generated in the Baranyi and Roberts models. In addition, it is also possible to assess the cell concentration at any time by the equations generated by the modified Gompertz model.
Many studies have used combination of the sensory evaluation and the predictive microbiology to estimate the shelf life of a particular food. Kreyenschmidt et al.24 and Nychas et al.25 estimated, by sensory parameters, the shelf life of poultry infected by Pseudomonas spp. when microbial population reached 7logCFUg−1 using the prediction curves obtained by the primary models. Then, the authors calculated the time to achieve a growth rate of 7logCFUg−1 under the environmental conditions tested, which was considered the end of shelf life for the meat. Therefore, the predictive models can also be used for the estimation of shelf life of food products.
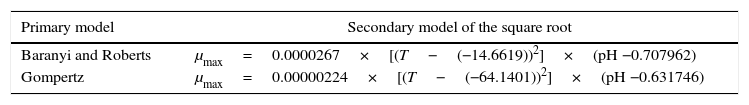
Secondary growth model for P. fluorescens in meat brothTable 4 shows the secondary models generated for the effect of temperature and pH on the maximum specific growth rate.
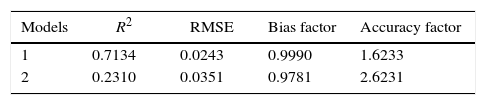
The statistical parameters for the validation of the secondary model for the growth data are shown in Table 5.
Statistical parameters, R2, RMSE, bias factor, and accuracy factor for validation secondary modeling of P. fluorescens.
| Models | R2 | RMSE | Bias factor | Accuracy factor |
|---|---|---|---|---|
| 1 | 0.7134 | 0.0243 | 0.9990 | 1.6233 |
| 2 | 0.2310 | 0.0351 | 0.9781 | 2.6231 |
Model 1 is the square root model generated from Baranyi and Roberts model, and Model 2 is the square root model generated from the modified Gompertz model.
Considering the data in Table 3, a secondary Ratkowsky model was used to evaluate the effect of pH and incubation temperature on P. fluorescens growth, which was best validated from primary data (μmax) generated by the Baranyi and Roberts model, since it has smaller RMSE, and R2, and the bias factor and accuracy factor are close to 1.
ConclusionThe primary models generated showed a good fit to the experimental data and can be used to predict the growth of P. fluorescens under the conditions employed in this study. The primary modeling showed that the increase or decrease in pH had a little effect on the microbial growth parameters, when compared with the temperature conditions. With respect to the combined effect of temperature and pH, in general, the increase in temperature concomitant with higher pH led to an increase in μmax and a decrease in λ value, resulting in a shorter shelf life, especially considering the temperature abuse tested.
The secondary modeling using the Ratkowsky model obtained from the data of the Baranyi model was validated better than that obtained by the Gompertz model, especially because the latter showed a low goodness of fit indices.
Thus, the equation in the secondary model obtained from the Baranyi model can be used to predict the effect of pH and temperature on P. fluorescens growth.
Conflicts of interestThe authors declare no conflicts of interest.
The authors thank CAPES for granting master's scholarship, and Federal University of Lavras and Mitah Technologies for the encouragement and facilitation of executing the study.