


Retail management of store brands (SBs) has focused on achieving positioning in value and creating associations of smart or expert shopping. The result is that value-conscious consumers and market mavens are the main targets of these brands. This study proposes and contrasts empirically a theoretical model of the effect of market mavenism and value consciousness on consumer identification with SBs. We also perform a multi-group analysis based on the consumer tendency to be loyal to the brands he or she buys. Consumers who are loyal to brands are very attractive segments for firms, due to the potential benefits these consumers represent in the long term, whereas consumers with little loyalty to brands can be an attractive segment for potential benefits in the short term. The results obtained in this study show differences between these two groups. For consumers who are loyal to brands, the results stress strong identification with the SB among the most value-conscious consumers, due fundamentally to their greater disagreement with the greater functional risk of these brands as compared to manufacturer brands and due to their greater conviction of the better price-quality ratio of SBs. In consumers with little brand loyalty, we find identification with the SB among the consumers with the greatest market mavenism, as a result of their greater perception of smart or expert shopping for these brands. Significant implications for management are derived from this study.
Brand identification is a recent concept in the discipline of marketing, and the concept has not been developed in sufficient depth in this field despite its great importance in most business results (Kuenzel and Halliday, 2008). There is insufficient research on this issue, and the few published studies indicate the need to advance knowledge of the factors that influence its achievement (Lam et al., 2013; Tuškej et al., 2011).
Lam et al. (2013) study consumer identification with a brand in the introductory stage on the technology market and point to the need for broader conceptualization between future lines of research. They recommend analyzing the consumer's brand identification in different context, a line of inquiry justified as necessary because the variables that contribute to the formation of identification depend on the target market and, more specifically, on the brand's prototypical customer.
Our study seeks to contribute to this area by investigating consumer identification with a brand in the stage of maturity on the food market. Specifically, we choose store brands (SBs) because these brands represent a considerable percentage of the mass consumption products sold in Europe. According to data published by the PLMA (Private Label Manufacturer Association) based on a study performed by Nielsen in 20 European countries for 2012, the market share in volume of these brands was 19–3% and over 40% in six countries (Switzerland, Spain, the United Kingdom, Portugal, Germany, and Belgium). 50% of consumers believe that these brands provide an excellent price/quality ratio and constitute good alternatives to manufacturer brands. 60% claim that they buy more of these brands in periods of recession, and 92% state that they will continue to do so when the economy recovers.
In Spain, according to data from the Observatory of Consumption and Food Distribution obtained in a market study performed on consumers and published by the Ministry of Agriculture, Food, and Environment (Ministerio de Medio Ambiente, Rural y Marino – MARM), 70.4% of consumers bought SBs in 2005, in contrast to 91.5% in 2011 (45% indicate that their purchases range from quite a few to many of these products, 46.5% indicate some, and only 8.5% do not buy them). When compared to leading manufacturer brands, the price of these brands is considered to be especially attractive for consumers (7.19 vs. 6.00, on a scale of 11 points, from 0 to 10) and compensates for the lower perceived quality in favor of leading manufacturer brands (6.96 vs. 8.01). Further, in a study of distributors, the distributors declare that consumers’ general loyalty to brands has decreased slightly (4.6) and has increased consumption of the distributor's own brands (6.4). 61.8% of distributors affirm that recently SBs have made consumers more loyal than manufacturer brands.
Distributors have adopted three different brand strategies for SBs: generic, standard, and premium brands (Kumar and Steenkamp, 2007). Generic SBs are positioned in low quality and low price, to which the distributor assigns a brand name different from the store's own label. Standard SBs are brands positioned in value, quality similar to leading manufacturer brands, and lower price, and they are brands for which the distributor usually uses its own label or an umbrella name that is repeated on a sufficiently wide number of products throughout the establishment. Premium SBs are brands positioned with excellent quality and a price that sometimes exceeds that of leading manufacturer brands. Standard SBs are widely accepted and consolidated brands on the food market, both in Spain and in many other European countries, and they constitute the object of this study.
To conceptualize the consumer's identification with the SB, we take as a reference and starting point the conceptual framework of the consumer's identification with the brand developed in Lam et al. (2013). Our study proposes a theoretical model for the SB that is validated through an empirical study on the Spanish food market. In addition, we perform a multi-group analysis based on the consumer tendency to be loyal to the brands he or she buys. We consider this variable to be an important moderator in the context of the analysis for two reasons. The first is the strategic interest that brand loyal and non brand loyal segments have for the retailer. Consumers that are loyal to brands represent potential benefits for firms in the long term, whereas non brand loyal consumers can be profitable in the short term. Knowing the idiosyncrasies of the process of identification with the SB in both segments can enable retailers to design and implement adapted marketing strategies that lead to better results for their own brands. The second reason is the negative relationship that has traditionally existed between brand loyalty and attitude to the SB (Burton et al., 1998) and the recent results of market reports (MARM, 2011) and academic studies (Cuneo et al., 2012a,b) performed in the Spanish context, which show that these brands are achieving brand loyalty and brand equity.
Conceptual frameworkIdentification with the SBAnalysis of the concept of brand identification has evolved from its foundation in Social Identity and Self-categorization Theory (e.g., Tajfel, 1978, 1982). These theories argue that individuals try to achieve a social identity that is positive and their own by comparing themselves to the group to which they believe they belong.
The phenomenon of the individual's identification with a brand is conceptualized as a specific kind of social identification in which the object with which the subject identifies him- or herself is a specific brand. As conceptualized in Social Identity Theory, identification includes a multidimensional perspective (cognitive, affective, and evaluative) and is defined as the psychological state that includes three elements: perception, feeling, and evaluation of the connection with the brand (Fournier, 1998; Lam et al., 2013). It has also been defined in the academic literature, however, as congruence of self-image among consumers and brands (Donavan et al., 2006; Hughes and Ahearne, 2010; Kressmann et al., 2006) or involvement of a consumer in a brand (Pritchard et al., 1999). Individuals use brands to create and communicate their self-concept (Chaplin and John, 2005). Given the symbolic nature of brands, consumers identify themselves with the brands with which they share personality traits and values and construct their social identity based on these brands (Bagozzi and Dholakia, 2006; Carlson et al., 2008; Dholakia et al., 2004).
Brand identification represents a kind of relationship between the brand and consumers that is often confused conceptually with other relational variables, such as (1) love and passion for the brand, (2) connection between brand and self, (3) interdependence with the brand, (4) commitment to the brand, (5) close relationship with the brand, and (6) the brand as a partner (Fournier, 1998).
Identification with the brand has psychological benefits, such as strengthening individuals’ self-esteem (Wann and Branscombe, 1995), and involves behavior such as loyalty, cross-buying, up-buying and word of mouth (Ahearne et al., 2005; Bhattacharya and Sen, 2003), willingness to pay a higher price (Homburg et al., 2009), and resistance to negative information about the company (Bhattacharya and Sen, 2003).
Among the most significant antecedents in the literature on brand identification are congruence between the brand's values and the individual's values (Bhattacharya and Sen, 2003; Lam et al., 2013; Tuškej et al., 2011) and satisfaction with the brand (Kuenzel and Halliday, 2008).
Lam et al. (2013) summarize the antecedents of the consumer's identification with the manufacturer brand using three kinds of variables: instrumental, symbolic, and consumer trait. Specifically, for the technology market and for a leading manufacturer brand in the introductory stage, their study considers perceived quality as an instrumental variable, congruence between the brand image and the consumer's image (self-brand congruity) as a symbolic variable, and innovative character as consumer trait.
The model developed by Lam et al. (2013) constitutes the reference and starting point of our study, and it is adapted to the SB in its mature stage on the Spanish food market. As a result, we believe that the antecedents of consumer identification with the SB can be summarized using three kinds of variables: instrumental, symbolic, and consumer trait, to which we would add consumer satisfaction with the brand, which is stressed in other studies (Bhattacharya et al., 1995; Kuenzel and Halliday, 2008). In the specific context of SB, however, we consider perceived value and perceived functional risk as instrumental variables, associations with smart shopping as symbolic variable, and market mavenism and value consciousness as consumer traits.
First, perceived value is considered an instrumental characteristic of SBs because these brands are generally under the control of manufacturers and distributors. Perceived value is used because it is the main characteristic recognized in these brands (Kara et al., 2009). We also choose to include a second instrumental characteristic associated with SBs: perceived functional risk for these brands, due to their negative influence contrasted over their perceived value (Dunn et al., 1986; González et al., 2006; Liljander et al., 2009; Richardson et al., 1996).
Second, associations of SBs with smart shopping are conceived as a symbolic variable because they are moderately under the control of the managers, for example, through positioning and marketing communications. The self-brand congruity is a fundamental antecedent of identification (Dimitriadis and Papista, 2011; Kuenzel and Halliday, 2010; Lam et al., 2013). The buyer with a more positive attitude to SBs will see him or herself as a smart shopper (Garretson et al., 2002; Martínez and Montaner, 2008). SBs, characterized by their lower prices and their quality similar to that of manufacturer brands (Apelbaum et al., 2003), are congruent with the self-image of their consumers as smart shoppers. For these specific brands, we thus propose the contribution of the association with smart shopping to identification with the SB.
Third, we propose market mavenism and value consciousness as defining characteristics of SB consumers and view these traits as outside the control of manufacturers and distributors. We replace the innovative character of the consumer from the model developed by Lam et al. (2013) with market mavenism and value consciousness, since our study does not apply to prestigious technology manufacturer brands in their introductory stage, but to SBs, whose positioning is value and which have reached the stage of maturity on the Spanish food market (MARM, 2011). Market mavenism is a characteristic of SB consumers (Martínez and Montaner, 2008). Market mavens grant great importance to the value obtained in purchasing, and SBs reinforce these experts’ feeling of being smart shoppers (Garretson et al., 2002; Martínez and Montaner, 2008). Another characteristic of SB consumers is value consciousness (Byoungho et al., 2005). Various studies find a positive effect of value consciousness on perceived value of SBs (Burton et al., 1998; Garretson et al., 2002; Gómez and Rubio, 2010; Jin and Suh, 2005; Kara et al., 2009).
Finally, we add satisfaction with SBs as a determining variable in identification with these brands (Bhattacharya et al., 1995; Kuenzel and Halliday, 2008). Satisfaction with the brand emerges from the results of the subjective evaluation of the purchase, consumption, and experience where the brand exceeds expectations. A common aspect present in nearly all definitions of satisfaction is the notion of comparison between expectations and result (Gómez et al., 2011). Satisfaction with the brand is key to constructing relationships between the brand/company and the consumer (Oliver, 1980). It is one of the fundamental strategic concepts in marketing, since it generates an explicit relationship between the processes of purchasing and consumption and the post-purchase phenomenon (Hunt, 1983).
The theoretical model proposed for the study of consumer identification with SBs is presented in Fig. 1. This figure shows the relationships whose justification is developed in the following section (H1–H9), and relationships already contrasted in the specialized academic literature, such as those listed as follows: (1) negative effect of perceived functional risk in SBs over perceived value (Liljander et al., 2009; Richardson et al., 1996; Seeney et al., 1999), (2) positive effect of value consciousness on perceived value of SBs (Burton et al., 1998; Garretson et al., 2002; Gómez and Rubio, 2010; Jin and Suh, 2005; Kara et al., 2009), (3) negative effect of perceived functional risk on the brand satisfaction (Dowling and Staelin, 1994; Gocek and Beceren, 2012; Johnson et al., 2006, 2008), (4) positive effect of perceived value in the brand on consumer satisfaction with the brand (Cronin et al., 2000; Fornell et al., 1996; Hallowell, 1996; Hu et al., 2009), and (5) positive effect of satisfaction with the brand on brand identification (Bhattacharya et al., 1995; Kuenzel and Halliday, 2008). Further, we propose the moderating effect of the consumer tendency to be loyal to the brands he or she buys (P1). The use of moderating variables1 has gained importance recently in the literature on relational marketing (Walsh et al., 2008), and in the context of the study, prior research recognizes the consumer tendency to be brand loyal as an important classification criterion (Kumar, 2008; Reinartz and Kumar, 2002).
Research hypotheses
Perceived risk is a determining aspect of consumers’ attitude and behavior toward a product or brand. According to a seminal article by Bauer (1960), consumer behavior involves risk in the sense that any action by the consumer produces consequences that cannot be anticipated with some degree of certainty, and it is probable that at least some of these will be unpleasant. The marketing literature identifies six dimensions of risk, which explain the consumer's behavior: functional, financial, social, psychological, physical (Jacoby and Kaplan, 1972), and of convenience (Roselius, 1971). The functional and financial dimensions have received the most study, since they are less specific to concrete products (Liljander et al., 2009; Sweeney et al., 1999).
In this study, we treat the functional dimension, which represents the uncertainty involved in the result of purchasing a product that does not fulfill the consumer's expectations and specifically illustrates the consumer's fears about the quality of the product (Agarwal and Teas, 2001; González et al., 2006). In the area of SBs of mass consumption products, this risk plays the strongest role in determining perception of SBs as less secure than manufacturer brands (Dunn et al., 1986; González et al., 2006).
Still, not all consumers perceive the functional risk of a brand in the same way. To understand the evaluation of functional risk that different consumers perform for manufacturer and SBs in a category, we must turn to the consumer traits (González et al., 2006), such as their value consciousness or their market mavenism.
Consumers whose purchases are guided mainly by value are designated in the academic literature as value-conscious consumers (Lichtenstein et al., 1990; Thaler, 1985; Zeithaml, 1988). Before defining this kind of consumer, it is important to consider the distinction made by Thaler (1985) between acquisition utility and transaction utility. Acquisition utility refers to the economic gain of the transaction and is obtained by subtracting the price paid from the utility of the product (Lichtenstein et al., 1990; Thaler, 1985). Transaction utility indicates the psychological satisfaction and pleasure obtained in purchasing, and it is obtained by subtracting the price paid from the internal reference price (Lichtenstein et al., 1990; Thaler, 1985).
Value-conscious consumers are concerned about saving money and paying low prices subject to some concerns about quality. As a result, their main motivation is acquisition utility, followed by transaction utility. In the area of SBs, various studies show a positive relationship of value consciousness and attitude to SB (Burton et al., 1998; Garretson et al., 2002; Gómez and Rubio, 2010; Jin and Suh, 2005; Kara et al., 2009) that culminates in the acquisition of these brands (Byoungho et al., 2005; Garretson et al., 2002).
Value-conscious consumers have more favorable perceptions of SBs, and this perception affects their purchasing positively. These more favorable perceptions include relationships with their functional performance and their perceived value (Burton et al., 1998). Value consciousness is therefore a consumer trait that affects these consumers’ perceptions of the perceived functional risk and of the value of SBs favorably (Bailey, 1999; Burton et al., 1998; González, 2002; Gronhaug, 1972; Monroe, 1976; Richardson et al., 1996). As a result of the foregoing, we propose the following hypothesis:H1 Value consciousness reduces the perceived functional risk of SBs.
Feick and Price (1987, p. 85) define market mavens as individuals who have information about many kinds of products, places to shop, and other facets of markets, and initiate discussions with consumers and respond to questions from consumers for market information. Market mavens have a wide variety of information on the market, use various information sources to get to know products, and are especially attentive to the communications media as the main source of information (Feick and Price, 1987). For these consumers, it is very important to have easily contrastable information, through the extrinsic attributes of the product, as such information facilitates evaluation of the purchase risk, increases their confidence in their ability to evaluate purchase alternatives, and contributes to security in their decision making (Feick and Price, 1987). Among the extrinsic cues consumers use as risk reduction strategies, we stress commercial sources (packaging or vendors) and well-known brands (Mitchell and McGoldrick, 1996; Schiffman and Kanuk, 2006).
In the area of SBs, analysis of objective quality between manufacturer and SBs reveals similar quality in both brands (Apelbaum et al., 2003; Méndez et al., 2008). Nevertheless, analysis of perceived quality shows the clear predominance of manufacturer brands (Méndez et al., 2011; Richardson et al., 1994). Méndez et al. (2011) demonstrate that the manufacturer brand and the packaging have a negative effect on the evaluation of the quality of SBs in a blind test, and that the negative effect is significant in categories with well-known manufacturer brands.
The use that market mavens make of the extrinsic cues of products to support their purchase decision (Feick and Price, 1987) and specifically, the importance that the packaging and awareness of the brand have as strategies to reduce purchase risk (Mitchell and McGoldrick, 1996; Schiffman and Kanuk, 2006) should increase the functional risk perceived by market mavens for SBs as opposed to manufacturer brands. The formal expression of these conditions leads us to articulate the following hypothesis:H2 Market mavenism increases the perceived functional risk of SBs.
Zeithaml (1988, p. 14) defines the perceived value of a product as “consumers’ overall assessment of the utility of a product based on perceptions of what is received and what is given” in a purchase. Monroe and Petroshius (1981) focus their definition of value on the price/quality ratio. If we assume that the quality and the price of the product are the best exponents of what the consumer receives and delivers, respectively, Zeithaml's definition is consistent with that of Monroe and Petroshius, which focuses on quality and price.
Various studies show that market mavens, as compared to non-experts, also grant high importance to price (Williams and Slama, 1995), are interested in smart shopping (Slama et al., 1992), and are intensive users of coupons (Price et al., 1988). The findings in these studies show the mediating character of value consciousness in the relationship between market mavenism and perceived functional risk for SBs. That is, the market maven perceives greater functional risk for SBs (H2), due to the more negative perception of the extrinsic cues of these brands and their lower awareness, although perceived functional risk decreases as the market maven incorporates purchase price into evaluation of the brands he or she acquires. The negative effect of market mavenism on perceived functional risk of the SB (H2) will thus be lower as value consciousness increases (H1 and H3). Hence, we propose the hypothesis:H3 Market mavenism has a positive effect on value consciousness.
The communication on SBs in the various media has focused on the aspects of value and smart shopping, which currently represent and define these brands. Slogans such as “the best price/quality ratio,” “the best buy,” “the smart buy,” or “quality is not expensive,” as well as the position of these brands on the shelves between low-quality and low-price brands and leading manufacturer brands has contributed to their positioning for value and smart shopping (Goldsmith et al., 2010). “Various academic studies thus stress the value positioning of SBs (Rubio et al., 2014; González-Benito and Martos-Partal, 2012; Méndez et al., 2008). Retailers’ communication strategies concerning these brands have focused on achieving this positioning (retailers have used the shelves as the main communication medium of the value of their brands. SBs have been situated between leading manufacturer brands and price first brands and highlighted with messages such as “best purchase alternative” or “best price/quality ratio”). The fact that market mavens are especially attentive to the communications media to form an opinion of products and brands (Feick and Price, 1987) leads us to propose the following hypotheses for SBs:H4 Market mavenism has a positive effect on the perceived value of the SB. Market mavenism favors the association of smart shopping and SBs.
Bergami and Bagozzi (2000) indicate that brand identification occurs with brands that enjoy brand equity. And brand equity implies that the brand must be known for some attribute that has value for the customer (Anselmsson and Johansson, 2007). In the area of SBs, recent studies show that these brands have managed to construct brand equity (Cuneo et al., 2012a,b) and that perceived value has played a significant role in their brand equity (Beristain and Zorrilla, 2011). According to Kara et al. (2009), perceived value is the main factor in creating a positive perception of the SB and strengthening the link between the consumer and the brand. It is thus logical to expect the existence of consumers who identify with what these brands represent, in other words, the existence of a positive causal relationship from perceived value of the SB to the consumer's identification with the brand. Finally, we propose:H6 The perceived value of SBs increases the consumer's identification with these brands.
A fundamental element of identification is the existence of values shared between the consumer and the brand (Scott and Lane, 2000). When there is overlap between the values of consumers and the traits, attributes, and values that emanate from the personality of the brand, identification occurs (Ashforth and Mael, 1989; Bergami and Bagozzi, 2000). The perception of brand associations that correspond to the consumer's personal traits strengthens the consumer's identification with the brand (Bhattacharya and Sen, 2003). The main characteristic of SBs is perceived value (Kara et al., 2009), and this value gives consumers the feeling of “knowing how to shop” or “making smart purchases” (Kumar and Steenkamp, 2007). Smart shopping is a vital aspect associated with SBs and is sought by the purchasers of these brands (Burton et al., 1998; Garretson et al., 2002; Jin and Suh, 2005). Based on the foregoing, we formulate the following hypotheses:H7 Value that the consumer perceives in SBs has a positive influence on associations of smart shopping. Associations of smart shopping with SBs increase the consumer's identification with these brands.
Positive beliefs about a brand and associations with it reinforce each other insofar as the consumer is satisfied with the brand (Chen, 2010; Kim et al., 2008; Pappu and Quester, 2006). Satisfaction with SBs, whether motivated by the economic savings they represent (Olavarrieta et al., 2006) or their perceived value, gives consumers hedonic benefits (Kara et al., 2009), such as the feeling of knowing how to shop, which strengthens their associations of smart shopping with these brands. We therefore argue that:H9 The consumer's satisfaction with SBs reinforces associations of smart shopping with these brands.
Finally, we propose a moderating effect of the consumer tendency to be loyal to the brands he or she buys on his or her identification of SBs. We believe that this variable is a significant moderator in the context of analysis for two reasons. First, it is of strategic interest for the retailer to know the behavior of brand loyal and non-loyal segments (Kumar, 2008; Reinartz and Kumar, 2002). Consumers who are loyal to brands represent potential benefits for firms in the long term, whereas non-loyal consumers may be profitable in the short term. Knowing the specific characteristics of the identification with the SB for both segments can enable retailers to design and implement marketing strategies adapted to produce better result for their own brands.
The second reason is the negative relationship that has traditionally existed between brand loyalty and attitude toward the SB (Ailawadi et al., 2001; Burton et al., 1998; Garretson et al., 2002), and the recent results of market reports (MARM, 2011) and academic research (Cuneo et al., 2012a,b) performed in the Spanish context, which show that these brands are achieving brand loyalty and brand equity. SB consumers have traditionally been conceived as price-conscious consumers, as concerned with paying low prices and showing little loyalty to brands (Ailawadi et al., 2001; Blattberg and Neslin, 1990). Recent research shows, however, that SBs have achieved brand loyalty and brand equity (Cuneo et al., 2012a,b) (MARM, 2011), which suggests the existence of consumer segments of SBs with different tendencies in brand loyalty and probably with different processes of identification with the SB.
Based on the foregoing, this study proposes:P1 The consumer's characteristic loyalty to brands has a moderating effect on the process of consumer identification with SBs.
The theoretical model proposed is contrasted empirically by performing a study of people responsible for shopping in their households who claim to have purchased SBs in food products.
In an initial phase of the research, we performed twenty in-depth interviews on the group to be studied. The interviews provided exploratory starting information that enabled us to determine the relationship between consumers and brands and the best way to design the questionnaire. The in-depth interviews were performed with residents of Spain captured by the snowball method according to quotas for gender, age, occupation, and number of members in the household. The results obtained made it easier to design the questionnaire and adapt the items used in previous research to the specific context of analysis.
In a second phase, we performed the quantitative investigation. At the exit of the commercial establishments, students in the last year of postgraduate marketing with general training in market research captured customers whom they asked to complete a self-administered questionnaire that took about 10min. The information was obtained from 54 stores belonging to seven chains of supermarkets and hypermarkets in Spain (Mercadona, Eroski Group, Carrefour Group, Dia, and Auchan Group). The number of establishments per group was determined according to the share of commercial surface of the group in m2 in 20102 (14 establishments for Mercadona, 13 for Eroski group, 12 for Carrefour group, 10 for Dia, and 5 for Auchan group). The establishment was chosen by taking into account the different urban areas based on income, means of transportation, and geographical area. The survey respondents answered questions on SBs commercialized in the establishment in which they were captured.
We obtained 804 valid questionnaires, with a sampling error3 of 3.53%. The sample profile shows that 74.53% of those surveyed were women, 31% were under 34 years of age, 32% from 35 to 49, 30% from 50 to 64, and 7% over 64 years old; 64% worked outside the home, 67.4% claimed the monthly net income of the family unit was under 3000 euros, the average number of members of the household was 3.27, and the average number of children per household 1.33.
To measure the concepts proposed, we examined scales used previously in the academic literature, which we adapted in some cases based on the results obtained in the qualitative analysis. Specifically, to measure market mavenism, we adopted three items from the scale by Feick and Price (1987), which was used subsequently by other authors (Ailawadi et al., 2001; Urbany et al., 1996). For value consciousness, we used four items from the scale by Lichtenstein et al. (1990, 1993) that have been used often in the academic literature on SBs by Burton et al. (1998), Garretson et al. (2002), and Jin and Suh (2005). The scale on functional risk is constructed by adapting the scales proposed by Dholakia (1997) and Stone and Gronhaug (1993) to the area of SBs. To measure perceived value, we used the items for value from the scale of attitude to SB by Burton et al. (1998). Satisfaction with the SB was measured by three items adapted from the scale by Oliver (1980) to the SB, and for associations of SB, we adapted the scale for smart shopper self-perception by Burton et al. (1998). For consumer identification with the SB, we adapted the scale for brand identification proposed by Mael and Ashforth (1992). Table 3 describes the variables used in the analysis.
Finally, the consumer tendency to be brand loyal, employed as moderating variable, was measured using five items, three proposed by Ailawadi et al. (2001): (1) I prefer one brand of most products I buy, (2) I am willing to make an effort to search for my favorite brand, and (3) I usually care a lot about which particular brand I buy. To these, we added two more items: (4) In general, I always buy the same brands, and (5) once I have gotten used to a brand, I hate to change.
All of the variables used were measured on a 7-point Likert scale, from 1 totally disagree to 7 totally agree. The empirical estimation model was constructed using structural models of covariance with the statistical package AMOS 19.
ResultsIn this section, we present the results of the proposed modeling for the general sample and for the different consumer segments, according to their tendency to be loyal to the brands they buy. We believe that identification with the SB probably differs between consumer segments according to their tendency to be brand loyal (P1). Consumers who are loyal to brands will tend to maintain closer links to the brands they buy. Their process of identification with the SB, which is of great interest to retailers, should be different from that of consumers who are not loyal to brands. Thus, the theoretical model proposed in this study is estimated for consumers who are loyal to brands (CLB) and for consumers who are not loyal to brands (CNLB).
We first confirm the reliability of the moderating variable, consumer tendency to be brand loyal, which is guaranteed by the Alpha Cronbach of 0.803 obtained. Second, we construct a summed scale for this variable and calculate the median value (5). Consumers below this value (414) are considered to be CNLB and the rest (390) CLB.
Table 1 shows the differences obtained between the two segments for the model variables. We see significant differences only for value consciousness and perceived functional risk of SBs, with higher values for consumers with a tendency to be brand loyal.
Differences between consumers according to their loyalty to brands.
| Variable/construct | CLB (N=390) | CNLB (N=414) | Total (N=804) | F-Snedecor |
|---|---|---|---|---|
| Market mavenism | 3.50 (1.43) | 3.43 (1.23) | 3.46 (1.33) | 0.550 |
| Value consciousness | 5.34 (1.19) | 5.11 (1.22) | 5.22 (1.21) | 7.635*** |
| SB functional risk | 3.63 (1.60) | 3.22 (1.31) | 3.42 (1.47) | 16.292*** |
| SB perceived value | 4.07 (1.51) | 4.22 (1.17) | 4.15 (1.35) | 2.574 |
| SB satisfaction | 4.46 (1.34) | 4.52 (1.13) | 4.49 (1.23) | 0.364 |
| SB smart shopping associations | 4.01 (1.58) | 4.06 (1.39) | 4.04 (1.48) | 0.217 |
| SB identification | 4.13 (1.51) | 4.22 (1.26) | 4.18 (1.39) | 0.832 |
SB: store brand, CLB: consumers who are loyal to brands, CNLB: consumers who are not loyal to brands.
Standard deviation in parentheses.
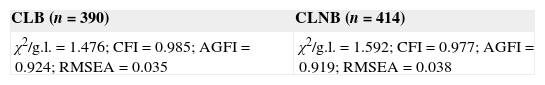
For each of the subsamples, we confirm the quality of the measurement scales, as recommended by Byrne (2001). We perform a confirmatory factor analysis with the program AMOS 19.0, the results of which show highly satisfactory fit in both samples. As can be observed in Table 2, the results respect the limits proposed in the academic literature for overall goodness of fit of the measurement model.
The results of reliability and validity for both subsamples are presented in Tables 3 and 4, respectively. In all cases, the reliability statistics used, the Alpha Cronbach, and composite reliability exceed the minimum value of 0.70 recommended by Hair et al. (1998). The variance extracted is greater than or equal to 0.5, and all of the items have good convergent validity, confirmed by the fact that all of the parameters are statistically significant.
Analysis of reliability and validity of measurement scales for consumers who are loyal to brands (CLB).
| Variables | Li | Ei | Reliability | Validity | ||
|---|---|---|---|---|---|---|
| Alpha Cronbach | Composite reliability (CR) | Average variance extracted (AVE) | Convergent validity | |||
| Market mavenism | ||||||
| v1: People think of me as a good source of shopping information | 0.73 | 0.47 | 0.78 | 0.83 | 0.63 | t=4.70*** |
| v2: I am somewhat of an expert when it comes to shopping | 0.97 | 0.05 | t=5.01*** | |||
| v3: I enjoy giving people tips on shopping | 0.64 | 0.59 | – | |||
| Value consciousness | ||||||
| v4: When I buy a product, I like to make sure that I am paying what I really should pay | 0.70 | 0.50 | 0.80 | 0.51 | t=10.28*** | |
| v5: When I buy a product, I always try to maximize the quality for the money I pay | 0.69 | 0.53 | 0.82 | t=10.10*** | ||
| v6: When I go shopping, I compare the prices of different brands to be certain that I get the best value for the money I spend | 0.84 | 0.29 | t=10.92*** | |||
| v7: I am very concerned about prices, but I am equally concerned about the quality of the product | 0.61 | 0.63 | – | |||
| SB functional risk | ||||||
| v8: Purchasing a well-known manufacturer brand (MB) is safer than purchasing a well-known SB | 0.81 | 0.34 | 0.87 | 0.87 | 0.70 | t=16.98*** |
| v9: SBs have worse performance than MBs | 0.89 | 0.20 | t=18.04*** | |||
| v10: A product with a “famous” MB will perform better than an SB, even if the SB is from a recognized establishment | 0.80 | 0.37 | t= | |||
| SB perceived value | ||||||
| v11: For many products, the best purchase (for price/quality ratio) is generally the SB | 0.85 | 0.29 | 0.90 | 0.90 | 0.74 | t=20.75*** |
| v12: Considering value for money, I prefer SBs to manufacturer brands | 0.89 | 0.21 | t=22.56*** | |||
| v13: When I buy an SB, I always feel that I am getting a good deal | 0.85 | 0.28 | – | |||
| SB satisfaction | ||||||
| v14: With SBs, I always get what I am looking for | 0.87 | 0.24 | 0.89 | 0.91 | 0.76 | t=19.72*** |
| v15: SBs always meet my expectations as a consumer | 0.86 | 0.26 | – | |||
| v16: My choice to buy SBs is a wise one | 0.89 | 0.21 | t=20.29*** | |||
| SB smart shopping associations | ||||||
| v17: Smart shoppers buy SBs | 0.93 | 0.14 | r=0.81*** | 0.90 | 0.81 | t=18.54*** |
| v18: Expert shoppers buy SBs | 0.87 | 0.24 | – | |||
| SB identification | ||||||
| v19: I feel identified with SBs | 0.77 | 0.40 | 0.88 | 0.88 | 0.71 | t=18.45*** |
| v20: When someone praises SBs, I feel exactly the same way | 0.86 | 0.25 | t=19.19*** | |||
| v21: I feel proud of SBs | 0.89 | 0.20 | ||||
SB, store brand; MB, manufacturer brand.
Li: standardized loading; Ei=(1−R2): error variance.
***Significance level p<0.001.
Analysis of reliability and validity of measurement scales for consumers who are not loyal to brands (CNLB).
| Variables | Li | Ei | Reliability | Validity | ||
|---|---|---|---|---|---|---|
| Alpha Cronbach | Composite reliability (CR) | Average variance extracted (AVE) | Convergent validity | |||
| Market mavenism | ||||||
| v1: People think of me as a good source of shopping information | 0.94 | 0.12 | t=4.64*** | |||
| v2: I am somewhat of an expert when it comes to shopping | 0.74 | 0.45 | 0.74 | 0.80 | 0.58 | t=4.63*** |
| v3: I enjoy giving people tips on shopping | 0.55 | 0.70 | – | |||
| Value consciousness | ||||||
| v4: When I buy a product, I like to make sure that I am paying what I really should pay | 0.75 | 0.45 | t=11.38*** | |||
| v5: When I buy a product, I always try to maximize the quality for the money I pay | 0.74 | 0.45 | t=11.37*** | |||
| v6: When I go shopping, I compare the prices of different brands to be certain that I get the best value for the money I spend | 0.88 | 0.23 | 0.85 | 0.83 | 0.56 | t=11.73*** |
| v7: I am very concerned about prices, but I am equally concerned about the quality of the product | 0.61 | 0.63 | – | |||
| SB functional risk | ||||||
| v8: Purchasing a well-known manufacturer brand (MB) is safer than purchasing a well-known SB | 0.73 | 0.47 | t=14.22*** | |||
| v9: SBs have worse performance than MBs | 0.82 | 0.32 | 0.83 | 0.83 | 0.62 | t=15.08*** |
| v10: A product with a “famous” MB will perform better than an SB, even if the SB is from a recognized establishment | 0.80 | 0.35 | – | |||
| SB perceived value | ||||||
| v11: For many products, the best purchase (for price/quality ratio) is generally the SB | 0.73 | 0.47 | t=13.09*** | |||
| v12: Considering value for money, I prefer SBs to manufacturer brands | 0.78 | 0.40 | 0.81 | 0.81 | 0.58 | t=14.72*** |
| v13: When I buy an SB, I always feel that I am getting a good deal | 0.78 | 0.39 | – | |||
| SB satisfaction | ||||||
| v14: With SBs, I always get what I am looking for | 0.78 | 0.39 | 0.84 | 0.86 | 0.67 | t=12.80*** |
| v15: SBs always meet my expectations as a consumer | 0.78 | 0.40 | – | |||
| v16: My choice to buy SBs is a wise one | 0.89 | 0.21 | t=14.40*** | |||
| SB smart shopping associations | ||||||
| v17: Smart shoppers buy SBs | 0.88 | 0.22 | r=0.79*** | 0.88 | 0.79 | t=18.27*** |
| v18: Expert shoppers buy SBs | 0.90 | 0.20 | – | |||
| SB identification | ||||||
| v19: I feel identified with SBs | 0.77 | 0.41 | – | |||
| v20: When someone praises SBs, I feel exactly the same way | 0.87 | 0.25 | 0.86 | 0.86 | 0.67 | t=17.86*** |
| v21: I feel proud of SBs | 0.82 | 0.32 | t=16.97*** | |||
SB, store brand; MB, manufacturer brand.
Li: standardized loading; Ei=(1−R2): error variance.
Further, we confirm discriminant validity in both subsamples using the method of variance extracted. Table 5 shows that, for the CNLB sample, the square root of the variance extracted from each construct is in all cases greater than the absolute value of the correlation between each pair of concepts. For the CLB sample, however, the square root of the variance extracted for identification with the SB is lower than the correlation coefficient between this construct and that of perceived value for the SB.
Analysis of discriminant validity for both pairs of samples (CLB and CNLB) according to the method of average variance extracted.
| Market mavenism | Value consciousness | SB functional risk | SB perceived value | SB satisfaction | SB smart shopping associations | SB identification | ||
|---|---|---|---|---|---|---|---|---|
| Market mavenism | CLB | 0.79 | 0.25 | 0.08 | 0.29 | 0.15 | 0.19 | 0.27 |
| CNLB | 0.76 | 0.22 | 0.16 | 0.27 | 0.08 | 0.31 | 0.22 | |
| Value consciousness | CLB | 0.71 | −0.17 | 0.53 | 0.39 | 0.34 | 0.46 | |
| CNLB | 0.75 | −0.01 | 0.26 | 0.25 | 0.22 | 0.29 | ||
| SB functional risk | CLB | 0.83 | −0.42 | −0.43 | −0.30 | −0.39 | ||
| CNLB | 0.79 | −0.2 | −0.29 | −0.11 | −0.19 | |||
| SB perceived value | CLB | 0.86 | 0.73 | 0.63 | 0.87 | |||
| CNLB | 0.76 | 0.56 | 0.53 | 0.70 | ||||
| SB satisfaction | CLB | 0.87 | 0.53 | 0.79 | ||||
| CNLB | 0.82 | 0.46 | 0.65 | |||||
| SB smart shopping associations | CLB | 0.90 | 0.65 | |||||
| CNLB | 0.89 | 0.66 | ||||||
| SB identification | CLB | 0.84 | ||||||
| CNLB | 0.82 |
SB, store brand; CLB, consumers who are loyal to brands; CNLB, consumers who are not loyal to brands.
The values on the diagonal correspond to the square root of the AVE in each construct.
The values above the diagonal represent the correlations between pairs of constructs.
Discriminant validity between the two concepts is analyzed using the Chi-square method. For the sample of CLB, we set the covariance between the two constructs at one and analyzed the change in the Chi-square between the unrestricted model and the model with the restriction of covariance. The Chi-square of the unrestricted model is 242.09, with 164 degrees of freedom, while the restricted Chi-square model is 265.6 with 165 degrees of freedom. The worsening of the Chi-square by 23.51 points for 1 degree of freedom is significant at 0.001%, which permits us to sustain discriminant validity between the two constructs.
Next, we perform the invariance analysis. First, we confirm the configural invariance, by evaluating the model's fit considering the two groups of customers simultaneously and without imposing any restriction. The goodness of fit indices of the configural invariance model show satisfactory fit (χ2=503.253; g.l.=328; χ2/g.l.=1.534; CFI=0.981; NFI=0.948; IFI=0.981; GFI=0.944; AGFI=0.922; RMSEA=0.026). These results thus enable us to confirm that both groups share the factor structure of the constructs considered.
Second, we impose the restriction of equality of factor loadings on the two samples and compare the results of goodness of fit for this restricted model with the results for the goodness of fit obtained for the unrestricted model (Δχ2=17.51; Δg.l.=14; p=0.23>0.05). The model does not worsen significantly, which guarantees that measurement invariance is fulfilled.
We subsequently contrast the invariance in the variance of the factors and observe a significant increase in the Chi-square statistic with respect to the previous model of measurement invariance (Δχ2=80.48; Δg.l.=28; p<0.05), although the other indicators (GFI=0.934; AGFI=0.917; CFI=0.975; RMSEA=0.028) show good fit and the CFI index does not worsen significantly either with respect to the previous model (ΔCFI=0.006) or with respect to the model on the configural invariance (ΔCFI=0.006). The increase in the CFI is lower than the limit of 0.01 proposed by Cheung and Rensvold (2002), enabling us to accept invariance in factor variance.
Finally, in the case of invariance of measurement error, there is also a significant increase in the Chi-square statistic relative to the previous model (Δχ2=70.11; Δg.l.=25; p<0.05), although the other indicators continue to be above the acceptable levels (GFI=0.926; AGFI=0.914; CFI=0.970; RMSEA=0.030) and the CFI index does not worsen significantly with respect to the previous model (ΔCFI=0.005). Having completed the invariance analysis of measurement, we can affirm that the results testify to its fulfillment and enable us to use the data to contrast the hypotheses proposed. The presence of invariance in the measurement guarantees that the values of the parameter obtained later in the structural relationships for both groups will not be affected by lack of equivalence in the measurement instruments (Steenkamp and Baumgartner, 1998).
Causal relationship modelThe model in Fig. 1 is estimated using structural equations, without including the moderating effect. The fit obtained is satisfactory (χ2=279.44; g.l.=171; χ2/g.l.=1.634; CFI=0.988; NFI=0.971; IFI=0.988; GFI=0.968; AGFI=0.957; RMSEA=0.028), and we confirm all of the relationships and hypotheses proposed. The parameters obtained can be seen in Table 6.
Estimation of the relationship model.
| Model relationships | Hypothesis | Standardized coefficient | t-value |
|---|---|---|---|
| SB functional risk→SB perceived value | −0.34 | −8.91*** | |
| Value consciousness→SB perceived value | 0.33 | 8.31*** | |
| Value consciousness→SB functional risk | H1 | −0.11 | −2.47** |
| Market mavenism→SB functional risk | H2 | 0.13 | 2.93*** |
| Market mavenism→value consciousness | H3 | 0.23 | 5.19*** |
| Market mavenism→SB perceived value | H4 | 0.25 | 6.40*** |
| Market mavenism→SB smart shopping associations | H5 | 0.11 | 2.94*** |
| SB functional risk→SB satisfaction | −0.17 | −4.93*** | |
| SB perceived value→SB satisfaction | 0.61 | 15.61*** | |
| SB perceived value→SB identification | H6 | 0.46 | 10.52*** |
| SB perceived value→SB smart shopping associations | H7 | 0.41 | 7.83*** |
| SB smart shopping associations→SB identification | H8 | 0.23 | 6.64*** |
| SB satisfaction→SB smart shopping associations | H9 | 0.22 | 4.52*** |
| SB satisfaction→SB identification | 0.31 | 7.89*** |
SB, store brand.
We then consider the moderating effect and perform a multigroup structural analysis for the segments CLB and CNLB. We compare the results of two models, a first whose structural parameters are unrestricted (unrestricted model) and a second in which we impose the restriction of equality for the structural parameters of the two segments (restricted model). The results of goodness of fit show significant worsening of the model when we impose the restrictions of equality in the structural relationships, suggesting that some restrictions imposed are not sustainable and demonstrating the moderating role of the consumer tendency to be brand loyal in the proposed modeling (P1). See Table 7.
Table 8 presents the non-standardized structural parameters for each of the segments considered and the critical ratios (CR) obtained for the differences. Remember that, in comparing the models, we used the non-standardized parameters, due to the possible presence of differences in the standard deviation of each construct among the samples (Iglesias and Vázquez, 2001). The statistical significance of the Chi-square is calculated using a t-test based on the expression t=(βi−βj)/square root (Si2+Sj2) proposed by Hair et al. (1998), in which βi and βj represent the coefficients to be contrasted and Si and Sj their respective standard errors.
Results of the multigroup analysis.
| Model relationships | Hypothesis | CLB | CNLB | CR |
|---|---|---|---|---|
| SB functional risk→SB perceived value | −0.36*** | −0.23*** | 1.74 | |
| Value consciousness→SB perceived value | 0.67*** | 0.24*** | −3.96*** | |
| Value consciousness→SB functional risk | H1 | −0.32*** | −0.06 | 2.18*** |
| Market mavenism→SB functional risk | H2 | 0.12** | 0.18*** | 0.70 |
| Market mavenism→Value consciousness | H3 | 0.15*** | 0.22*** | 1.04 |
| Market mavenism→SB perceived value | H4 | 0.20*** | 0.26*** | 0.70 |
| Market mavenism→SB smart shopping associations | H5 | 0.013 | 0.24*** | 3.07*** |
| SB functional risk→SB satisfaction | −0.14*** | −0.16*** | −0.43 | |
| SB perceived value→SB satisfaction | 0.58*** | 0.47*** | −1.47 | |
| SB perceived value→SB identification | H6 | 0.50*** | 0.35*** | −1.77 |
| SB perceived value→SB smart shopping associations | H7 | 0.51*** | 0.38*** | −1.19 |
| SB smart shopping associations→SB identification | H8 | 0.12*** | 0.28*** | 2.81*** |
| SB satisfaction→SB smart shopping associations | H9 | 0.19** | 0.34*** | 1.30 |
| SB satisfaction→SB identification | 0.33*** | 0.32*** | −0.17 |
SB, store brand.
CR, critical ratio for the differences between parameters.
t=1.96 for p<0.05 and t=2.58 for p<0.01.
As can be seen, the consumer tendency to be brand loyal exercises a moderating effect on the relationships proposed in the model for consumer identification with SBs (P1). Each of the hypotheses proposed in this study is contrasted in both samples, except Hypothesis H5, which is not contrasted in sample CLB, and H1, which is not contrasted in the CNLB sample. Further, the intensity of the relationships proposed relative to value consciousness and perceived value of the SB and between the association of smart shopping for the SB and consumer's identification with these brands (H8) differs significantly between CLB and CNLB. The intensity of the other relationships proposed is similar for both groups.
Specifically, in the sample of CLB, the positive relationship between value consciousness and perceived value is significantly more intense (0.67 in CLB vs. 0.24 in CNLB), as also occurs in the negative relationship between value consciousness and perceived functional risk (H1) (−0.32 in CLB vs. −0.06 in CNLB). To the extent that they are more value conscious, consumers who are loyal to brands perceive SBs to be the best purchase options and identify with them. Not only the more competitive price but also the lower perceived risk in acquiring SBs contributes to their perceived value for this segment.
It is interesting to note that, in the CLB segment, the total effect of value consciousness for each of the constructs is considerably higher than the total effect obtained in the segment of CNLB. The total effect on perceived value is 0.79 in CLB and 0.25 in CNLB. For satisfaction, the effect is 0.50 in CLB and 0.13 in CNLB. In associations of smart shopping, it is 0.50 in CLB and 0.14 in CNLB, and in identification 0.62 in CLB and 0.17 in CNLB.
For the sample of CNLB, in contrast, the positive relationship between market mavenism and association of the SB with smart shopping (H5) is significantly more intense (0.013 in CLB vs. 0.24 in CNLB), as is the positive relationship between association of the SB with smart shopping and identification with these brands (H8) (0.12 in CLB vs. 0.28 in CNLB). As the market mavenism of consumers who are not loyal to brands increases, these consumers perceive the purchase of SBs to a greater extent as smart and expert shopping and identify with them.
Finally, we should stressing the high proportion of variance explained by the different constructs in both samples, although the explanatory values achieved in the CLB segment are higher than those obtained in the CNLB segment. Specifically, the variance explained by identification with the SB is R2=0.82 in CLB and R2=0.67 in CNLB. For SB smart shopping associations, it is R2=0.41 in CLB and R2=0.36 in CNLB; for satisfaction with the SB, it is R2=0.55 in CLB and R2=0.36 in CNLB; and for perceived value of the SB, it is R2=0.44 in CLB and R2=0.18 in CNLB.
Conclusions and implications for managementThe findings of this study enable us to understand the process of the consumer's identification with the SB, as well as differences in this process that occur in the two consumer segments with great value for the retail sector (consumers who are loyal and non-loyal toward brands).
On the one hand, the results of the modeling performed reveal that the perceived value of these brands plays a determining role in the consumer's identification with them. The total standardized effect of the value of the SB in the identification is 0.77 and occurs directly (0.46) and indirectly (0.31), as value increases the consumer's satisfaction with these brands and reinforces the associations of smart shopping attributed to them. The descriptive data show, however, that consumers agree only slightly that these brands represent the alternative with greater value.
It follows that the results obtained alert retailers to the importance of implementing marketing strategies that reinforce the perceived value of their brands to encourage consumer identification with the SB. Currently, to improve the sales of the SBs, some commercial chains have opted to reduce the variety of manufacturer brands in some product categories, primarily those in which the SB has achieved significant market share. However, this policy can have undesired effects on the perceived value of the SB and thus on the consumer's identification with these brands.
Suppressing manufacturer brands should not have either positive or negative effects on consumers who are certain to purchase the SB, but it could affect the perceived value of these brands negatively for potential buyers of the SB. The competitive advantage of SBs is in their perceived value, which has been achieved by the distributors, mainly through merchandizing strategies. Traditionally, retailers have used the shelves as a means of communicating the value of their brands. SBs have been situated between the leading manufacturer brands and price first brands and showcased through messages such as “best alternative purchase” and “best price/quality ratio.” Retailers should continue to win consumers for their own brands by implementing strategies that reinforce the value of these brands but permit the consumer to choose them freely. Suppressing leading manufacturer brands obligates consumers who have doubts about buying the SBs to acquire them and prevents them from choosing these brands freely, as a result of favorable evaluation of their value when compared to other competing brands.
As a result, to reinforce the value of the SB, retailers should be sure to compare their brands to other brands in the product category. To do this, they can continue to use the position on the shelf and place posters in the establishment that communicate the value of these brands, but they can also implement other practices, such as blind product tests at the point of sale, free samples that help the buyer to appreciate the value of the SBs, different labels (FOP – front of package) or TLS (traffic light system)) that provide consumers with useful information for comparing the products at the point of sale (Van Camp et al., 2010), promoting innovation in the SB, etc.
As to the effect of value consciousness and market mavenism on identification with the SB, we can draw important conclusions from this study. The greater the value consciousness and the greater the market mavenism, the greater the perceived value for SBs. Whereas more value-conscious consumers perceive less functional risk for the SBs, however, those with more market expertise perceive greater functional risk for these brands. Thus, both consumer traits have a positive effect on the perceived value of SBs, although for the most value conscious, the lower perceived functional risk increases their value, whereas for the most market mavens, the greater perceived functional risk for these brands reduces their value.
SBs have traditionally been characterized as having lower prices than manufacturer brands. In the eyes of consumers, their most competitive prices have not been questioned and have contributed positively to their perceived value. The same has not occurred, however, with the quality of these brands, which is questioned and perceived differently by consumers, and whose contribution to perceived value has been the object of more analysis.
The results obtained in this study, which conceptualizes perceived value as the price/quality ratio, show that the most market mavens attribute greater value to these brands as a result of their lower prices, but not of their quality, since they perceive the purchase of SBs to be riskier and less secure than the purchase of manufacturer brands. In contrast, the most value-conscious consumers perceive greater value for these brands, not only for their prices but also for their quality, since they perceive lower functional risk in purchasing these brands.
At present, manufacturer brands maintain their image as safe brands among consumers with the most market mavenism. Manufacturers have wisely begun to react to the peak in SBs in the Spanish market in order to strengthen their image of safety and trustworthy brands they have earned over the years. Some manufacturers defend their brands in the communications media, individually with slogans like “do not manufacture for other brands,” and collectively through agreements between manufacturers’ associations and television chains (Telecinco, Cuatro, etc.) that broadcast advertisements with slogans such as “Telecinco for brands” or “We are Cuatro, and we believe in brands.” They are also trying to improve their perception of value through price. Multinationals such as Procter & Gamble incorporate the slogan “we look for the seal of sure value in your trusted brands and for discounts of up to 30%” or facilitate the acquisition of coupons for their products to obtain direct price discounts through their webpages (www.proximaati.com for P&G, www.agustoconlavida.es for Nestle and www.alimentasonrisas.es for Danone). Retailers should attempt to decrease the perceived risk of their own brands among consumers with the most market mavenism by making a greater effort to communicate these brands outside the establishment and in different media, and to focus communication on the quality of these brands and the safety of purchasing them. One must keep in mind that these consumers use different information sources to learn about products on the market and are especially attentive to the communications media as an information source to guarantee their knowledge and credibility before others (Feick and Price, 1987).
Finally, it is advisable to reflect on the results obtained in the multi-group analysis of consumers who are loyal to brands (consumers who are very attractive for firms due to their potential long-term benefits) and consumers who are not loyal to brands (attractive for their short-term benefits).
In the segment of consumers who are loyal to brands, value consciousness constitutes one of the main determinants of greater SB perceived value and SB identification. This result is especially important, since, on the one hand, it alerts us to the attractiveness of SBs among consumers who are loyal to these brands and more value conscious, on the other, provides evidence for the loss of hegemony of manufacturer brands as brands with which to identify for this segment. Insofar, consumers who are loyal to brands to the extent that they are more value conscious, perceive greater value for the SB—not only because of their more competitive prices but also because of their lower perception of functional risk in acquiring these brands.
In the segment of consumers who are not loyal to brands, we find that SBs must improve these consumers’ perception of quality, of being safe brands. Among consumers who are not loyal to brands, the greater value perceived in SBs, for both market mavens and value conscious consumers, comes fundamentally from their lower prices. Thus, we see that, of consumers who are not loyal to brands, the most market mavens perceive a stronger association with smart and expert shopping in SBs, which contributes favorably to their identification with these brands. These results again confirm the need for greater communication about SBs to consolidate them in specific segments (Rubio et al., 2014), such as those of consumers who are not loyal to brands and especially those not loyal to brands who have more market mavenism. Market mavens are usually both loyal buyers of many brands (Stokburger-Sauer and Hoyer, 2009) and innovators (Andrews and Benedicktus, 2006), but they have disproportionate influence as leaders in opinion about multiple product categories, one reason that distributors should consider them especially important and value them (Geissler and Edison, 2005).
This study is not exempt from some limitations, from which future lines of research may be derived. First, the data were obtained from a survey and thus provide self-evaluation measures. It would be interesting for future studies to use both measures based on perceptions and objective measures of behavior. Second, we analyzed SBs at the aggregate level. Controlling SBs by label could be interesting to evaluate the effect of labels on the model variables. Finally, future studies could expand the area of application to new product categories and new countries.
The authors wish to acknowledge the financial support of the Fundación Ramón Areces (research project: “El capital cliente en mercados minoristas de gran consumo”), Ministry of Economy and Competitiveness (research project ref.: ECO2012-31517) and UAM+CSIC (research project ref.: CEMU-2012-34).
Moderating variables are defined as variables that affect the form or strength of the relationship between a dependent variable and an independent variable (Walsh et al., 2008).
Mercadona (13.2%), Eroski (12.2%), Carrefour (12%), Dia (9.3%), and Auchan (5.2%). We used the share of surface area instead of share of sales to avoid possible bias in the results due to Mercadona's outstanding leadership in sales and its own brands in Spain.
We used the expression of sample size (n) in stratified samplings developed by Scheaffer et al. (2007) to calculate sampling error:
L, number of establishments; N, number of sampling units in the population; Ni, number of sampling units per establishment; B, sampling error; ai, fraction of establishments set in the chain i; pi, population dispersion for establishment i. We assume the least favorable value: qi=1−pi=0.5.