


This paper investigates the relationship between changes in interest rates and the Spanish stock market at the industry level over the period from January 1993 to December 2012 using a wavelet-based approach. The empirical results indicate that Spanish industries exhibit, in general, a significant interest rate sensitivity, although the degree of interest rate exposure differs considerably across industries and depending on the time horizon under consideration. In particular, regulated industries such as Utilities, highly indebted industries such as Real Estate, Utilities or Technology and Telecommunications, and the Banking industry emerge as the most vulnerable to interest rates. Further, the link between movements in interest rates and industry equity returns is stronger at the coarsest scales. This finding is consistent with the idea that investors with long-term horizons are more likely to follow macroeconomic fundamentals, such as interest rates, in their investment decisions.
Understanding the linkage between interest rates and stock prices is a critical issue to many areas of finance, including asset allocation, portfolio management, risk management, asset pricing and monetary policy transmission, and it may be, therefore, of special interest to investors, portfolio managers, corporate managers and policy makers. The link between changes in interest rates and stock returns is based on financial theory. Modern financial theory assumes that any firm generates a stream of future cash flows and the stock price of that firm is equal to the present value of all expected future cash flows discounted at the appropriate discount rate. Interest rates affect stock prices through two primary channels. First, movements in interest rates have a direct effect on the discount rate used in equity valuation. Second, interest rate changes affect firms’ expectations about future cash flows by altering the cost of financing, mainly in the highly indebted companies. Consequently, it is expected that interest rates will be a significant determinant of stock prices. In this regard, according to survey evidence by Graham and Harvey (2001), interest rate risk is ranked by U.S. firm managers as the second most relevant financial risk factor, only behind credit risk.
The relationship between interest rate fluctuations and the market value of companies has received a great deal of attention in the literature, although much of this research has focused on financial institutions as a large proportion of income and expenses of these firms directly depend on interest rates. Nevertheless, interest rate variations may be also important for non-financial corporations, principally through their effect on the borrowing costs and the value of financial assets and liabilities held by these companies The classical ordinary least squares (OLS) regression has been the most common approach used in the literature to assess the relation between changes in interest rates and stock returns. More recent studies have utilized, however, more sophisticated time series methods in the time domain, such as cointegration, Granger causality, vector autoregressive (VAR) or generalized autoregressive conditional heteroscedasticity (GARCH) models. A major limitation of the existing empirical research is that it is restricted to one or at most two time scales, i.e. the short run and the long run.
Despite remarkable advances in modeling techniques, little attention has been paid so far to the influence of a potentially relevant feature such as the investment horizon on the interest rate-stock market link. Financial security markets such as bond and stock markets are complex systems consisting of thousands of heterogeneous agents making decisions over different time horizons (from minutes to years), who collectively determine aggregate market behavior. For example, agents with short investment horizons, such as day traders, are typically linked to speculative activities and make decisions largely based on ephemeral phenomena such as sporadic events (i.e. announcements of earning surprises, mergers), market sentiment or psychological factors. In contrast, agents with long horizons, such as big institutional investors, are more involved in investment activities and follow more closely macroeconomic fundamentals such as the business cycle, inflation, monetary policy stance, etc.
In this way, it is not unreasonable to think that the extent of connection between interest rates and stock prices may vary across time scales associated with different investment horizons of market participants. In such a context, where the strength and direction of relationships between economic and financial variables may differ with the time scale, wavelet methods appear as a very appealing alternative. Wavelet analysis is a comparatively new, at least in finance, and powerful tool for signal processing that takes into account both time and frequency domains. The essential advantage of wavelets is their ability to decompose any signal into its time scale components.1 This signal decomposition property provides an opportunity to study economic relationships on a scale-by-scale basis. Thus, it is possible to separate those time horizons at which the connection is statistically significant from those horizons at which it is not and, therefore, to obtain a broader picture as compared to the time domain approach which in fact aggregates all time horizons together.
The purpose of this paper is to examine the linkage between changes in interest rates and the Spanish stock market at the industry level across different investment horizons by using a wavelet approach. More specifically, three complementary wavelet-based tools are employed, namely wavelet variance, correlation and cross-correlation. The central research question of this study is whether the relationship between interest rate fluctuations and industry equity returns varies across investment horizons and if so, how it does. A priori, we expect that this relationship will be stronger at long investment horizons because market participants with a very long view (years) are more likely to be interested in market fundamentals, such as interest rates, than agents with shorter horizons, who are mainly influenced by transitory factors.
This work contributes to the current literature in several aspects. First, to the best of our knowledge, this study is the first to investigate interrelationships between movements in interest rates and stock returns in the Spanish case at multiple investment horizons by using the wavelet methodology. In this respect, the Spanish equity market offers an ideal setting to assess the interest rate exposure given the great importance of financial, regulated and heavily indebted firms, all of them being particularly sensitive to interest rate fluctuations, in this market. Second, no previous research has examined the linkage between interest rates and stock returns at the industry level through wavelet techniques. The analysis on an industry basis is, however, appropriate because market aggregation may mask significant differences among industries in terms of interest rate sensitivity. Third, this study is also unique in the sense that a novel discrete wavelet technique is applied, which is called Haar à trous wavelet transform (hereafter referred to as HTW). The HTW was introduced by Murtagh et al. (2004) and overcomes the drawbacks of traditional wavelet functions. As is argued by Jammazi (2012b), the major reason behind the choice of this alternative wavelet transform is its ease in dealing with the boundary problem without the need to remove data. Therefore, the HTW transform ensures the conservation of the whole information included in the original signals, making it possible to better characterize the real interactions between interest rate changes and stock returns.
Our results indicate that the Spanish equity market exhibits a remarkable degree of interest rate sensitivity, although sizeable differences can be observed across industries and depending on the time horizon considered. Unsurprisingly, regulated industries such as Utilities, heavily indebted industries such as Real Estate, Utilities or Technology and Telecommunications, along with the Banking industry emerge as the most interest rate sensitive. On the contrary, there is a wide range of industries such as Chemicals and Paper, Financial Services, Construction, Health Care, and Industrials hardly influenced by interest rates. It is also found that the interest rate-stock market link becomes more pronounced at longer investment horizons (low frequencies), suggesting that the role of interest rates as a key driving factor of stock market performance may be held only in the long run for some specific industries. As expected, the interest rate sensitivity is predominantly negative, indicating that Spanish firms are, on average, adversely impacted by interest rate rises. In addition, a significant bidirectional relationship between changes in interest rates and industry returns is found at longer horizons.
The remainder of the paper is structured as follows. Literature review section 2 briefly reviews the relevant related literature. Data set section introduces the wavelet methodology and the wavelet tools used to characterize the relationship between changes in interest rates and industry returns. Econometric methodology section describes the dataset employed. Empirical findings are discussed in Empirical findings section. Finally, Concluding remarks section concludes the paper.
Literature reviewThe relationship between changes in interest rates and stock returns has given rise to a prolific research activity over the past few decades. The bulk of this literature has concentrated on the Banking industry because of the particularly interest rate sensitive nature of the financial intermediation business. Specifically, the maturity mismatch or duration gap between banks’ financial assets and liabilities resulting from the maturity transformation function of banking firms (i.e. the financing of long-term loans with short-term deposits) has been usually identified as the main cause of the interest rate sensitivity of banks (Ballester et al., 2011; Czaja et al., 2009, 2010). This positive duration gap (the average duration of banks’ assets exceeds the average duration of banks’ liabilities) implies that rising interest rates have an adverse effect on the value of banks and vice versa. This occurs because when interest rates increase, the present value of banks’ assets falls more than that of banks’ liabilities and also the costs of banks’ liabilities rise faster than the yields on banks’ assets.
However, movements in interest rates may also have a significant effect on the value of non-financial corporations through several channels. First, within the framework of present value models hikes in interest rates increase the cost of capital for firms, which translates into higher discount rates for future cash flow valuation, thereby adversely affecting firms’ stock prices. Second, interest rate rises increase the interest expense of leveraged companies and can also reduce the demand for products by heavily indebted consumers, which means lower corporate profits and has, in turn, a negative impact on share prices. Third, interest rate fluctuations alter the market value of financial assets and liabilities held by non-financial firms. Finally, movements in interest rates affect the opportunity cost of equity investments. Higher interest rates make bonds more attractive as an alternative to hold stocks, which leads investors to rebalance their portfolios by buying bonds and selling stocks, thus depressing stock prices. All these effects suggest an inverse relationship between interest rate fluctuations and stock returns. Nevertheless, it is also possible to find a positive correlation between these variables if interest rates and equity markets move in the same direction following changes in macroeconomic factors such as inflationary expectations or economic prospects.
A broad consensus emerges from this body of literature regarding several relevant issues. Firstly, the empirical research in this area has traditionally provided evidence of a significant negative relationship between movements in interest rates and stock returns of both financial and non-financial companies (Dinenis and Staikouras, 1998; Lynge and Zumwalt, 1980; Prasad and Rajan, 1995). However, some more recent studies, such as those of Czaja et al. (2009) and Korkeamäki (2011), show that the impact of interest rate fluctuations on equity returns has declined over time primarily due to the increased availability of improved tools for managing interest rate risk. In particular, the extraordinary growth in interest rate derivative markets and the expansion of corporate bond markets may have played a key role in this context. Secondly, stock returns tend to be more sensitive to movements in long-term interest rates than to short-term rates (Bartram, 2002; Czaja et al., 2009; Ferrer et al., 2010; Oertmann et al., 2000). Thirdly, nonfinancial firms in regulated and/or highly indebted industries such as Utilities, Real Estate, Basic Resources, and Technology and Telecommunications are commonly recognized as the most interest rate sensitive (Bartram, 2002; Reilly et al., 2007; Sweeney and Warga, 1986). Two basic reasons help to explain this result. First, profits and, hence, stock prices of heavily indebted corporations are strongly dependent on interest rate developments insofar as the cost of their debt is directly related to the level of interest rates. Second, regulated companies such as utilities adjust the prices of their products and services with some lag behind cost increases due to the constraints imposed by regulators. This rigidity in prices contributes to strengthening the negative impact of interest rate rises on share prices of these firms as the increased financial costs are not offset by a higher income.
So far, the empirical literature on the link between interest rates and stock prices has developed primarily in the time domain by using a broad range of time series methods, including OLS regression (Korkeamäki, 2011; Reilly et al., 2007; Sweeney and Warga, 1986), VAR techniques (Campbell and Ammer, 1993; Laopodis, 2010), cointegration analysis (Chan et al., 1997; Das, 2005; Hatemi-J and Roca, 2008), Granger causality tests (Alaganar and Bhar, 2003; Panda, 2008; Shah et al., 2012), non-linear models (Ballester et al., 2011; Bartram, 2002), and GARCH-type models (Elyasiani and Mansur, 1998; Faff et al., 2005; Kasman et al., 2011).
Nevertheless, there are a few recent papers examining the interest rate-equity market nexus through the use of wavelet techniques (Çifter and Ozun, 2008; Hamrita and Trifi, 2011; Kim and In, 2007; Tiwari, 2013). These studies focus on aggregate stock markets of various countries and show that the connection between interest rates and share prices is dependent on the time horizon, increasing in importance at longer horizons. These authors, with the only exception of Tiwari (2013), employ a variant of the discrete wavelet transform known as the maximal overlap discrete wavelet transform (hereafter referred to as MODWT). This transform is the most widely used wavelet in economic applications due to various attractive features. In particular, it can handle any sample size (not restricted to a power of two), it is translation or shift invariant as a shift in the signal does not change the pattern of wavelet coefficients, and it provides increased resolution at coarser time scales. Despite this, as noted by Jammazi (2012b), the MODWT also has some drawbacks. First, it is affected by boundary effects that arise from applying the wavelet transform near the edge of finite signals due to the lack of data beyond the boundary. Since the number of boundary elements increases with scale there will be many more boundary-affected coefficients at higher scales. The boundary problems may lead to biased estimates of the wavelet variance and, hence, to spurious and misleading results (Percival and Walden, 2000). In order to get an unbiased estimator of the wavelet variance, the exclusion of all the wavelet coefficients affected by boundary conditions has become a very common practice. This loss of edge information inherent to the MODWT may, therefore, make it difficult the correct characterization of the real interactions between variables, especially at the coarsest scales. Second, the MODWT is typically implemented with the Daubechies least asymmetric (LA) wavelet filter of length L=8, denoted by LA(8), as it allows an accurate alignment in time between wavelet coefficients at various scales and the original signal. However, the LA(8) filter is not appropriate to capture the non-linear and chaotic behavior typical of many economic and financial time series (i.e. oil price, inflation, stock returns, etc.).
The present study differs from the above mentioned papers in the use of the HTW transform, a new discrete and robust wavelet technique that overcomes the major constraints of the MODWT and has been rarely applied to date in economic and finance areas. In fact, Jammazi and Aloui (2010) and Jammazi (2012a,b) are the only ones who have used the HTW within a financial framework, particularly with the purpose of exploring the dynamic relationship between oil price changes and stock returns.
Most of the literature on the interest rate-stock market link has focused on a few countries with highly developed financial markets, especially the U.S. and more recently Germany, the U.K. or Australia. Concerning the Spanish case, there are some studies (Ferrer et al., 2010; Jareño, 2008; Soto et al., 2005), based primarily on multifactor linear regression models, which document a significant linkage between interest rate movements and firms’ stock returns, confirming the high interest rate sensitivity of the Spanish equity market.
Data setThis study deals with the relationship between movements in interest rates and stock returns in the Spanish case over the period from January 1993 to December 2012. The starting date of our analysis is January 1993 to avoid possible distortions in the interest rate-equity market nexus caused by the turbulences in financial markets in the context of the crisis of the European monetary system during the second half of 1992. Along the lines of, among others, Campbell (1987), Kim and In (2007), Korkeamäki (2011) and Reilly et al. (2007), monthly data series are employed (a total of 240 observations). Monthly data (end-of-the month observations) are preferred to weekly or daily data for several reasons. Firstly, monthly data are less contaminated by noise and can therefore better capture interactions between interest rates and equity prices. Secondly, monthly data have smaller biases due to non-synchronous trading of some stocks. Thirdly, the results in terms of smoothness and differentiation among time horizons generated by the application of wavelet analysis on monthly data are much harder to obtain with higher frequency data. In fact, it would be necessary to use a very large number of decomposition levels when considering weekly or daily data in order to find comparable results to those achieved with monthly data in terms of the time range covered.
In line with previous research on the interest rate-stock market link (Bartram, 2002; Ferrer et al., 2010; Reilly et al., 2007; Sweeney and Warga, 1986), this analysis is carried out at the industry level. Various reasons are usually put forward to justify an industry-based approach. First, the formation of industry portfolios provides an efficient way of condensing a sizable amount of information regarding stock price behavior. Second, the use of portfolios helps to smooth the noise in the data produced by transitory shocks in individual stocks, which leads to more precise estimates. Thus, all firms listed on the Spanish Stock Exchange for at least one full year of the sample period (a total of 249 companies) are assigned to any of the industries considered. Then, value-weighted industry stock indices are constructed from stock prices, adjusted for splits and dividends, of individual firms within each industry portfolio.
The fourteen industries covered are: Consumer Goods, Consumer Services, Technology and Telecommunications, Real Estate, Banking, Financial Services, Utilities, Construction, Chemicals and Paper, Basic Resources, Health Care, Food and Beverages, Industrials, and Energy. This industry breakdown is similar to the well-known Industry Classification Benchmark (ICB), but adapted to the singular features of the Spanish equity market. For example, the Construction and Real Estate industries have been added since they were one of the major growth engines of the Spanish economy over the period 1996–2007, representing almost 18% of Spanish GDP in 2007. The use of the official industry classification of the Spanish Stock Exchange has been discarded in this study for two main reasons. First, the Spanish industrial classification has undergone several restructuring processes over the last two decades, with January 2005 being the most recent. This implies that there are no sufficiently long time series of industry stock indices for conducting a credible empirical analysis with monthly data. Second, the current industry classification of the Spanish market only distinguishes six basic industries and, therefore, it seems more appropriate to use more disaggregated industry level data. The Indice General de la Bolsa de Madrid (IGBM), the broadest index of the Spanish equity market, is utilized as an indicator of the stock exchange as a whole. Equity market data are collected from the Madrid Stock Exchange database.
Interest rates used in this study are the yields on 10-year Spanish government bonds, which have been taken from the Bank of Spain's website. This choice has become increasingly popular in the literature on the linkage between interest rates and stock market (Ballester et al., 2011; Elyasiani and Mansur, 1998; Faff et al., 2005; Oertmann et al., 2000) and is justified for several reasons. First, long-term interest rates contain market expectations about future prospects for the economy and determine to a large extent the cost of borrowing funds. Thus, long-term rates are likely to have a critical influence on investment decisions and profitability of firms and, hence, on their stock market performance. Second, long-term government bonds are often considered as closer maturity substitutes to stocks, which may presumably increase the extent of linkage between the two financial assets. Industry returns are calculated as the first log difference of industry stock indices. Changes in interest rates are computed as the first differences in the level of interest rates between two consecutive observations.
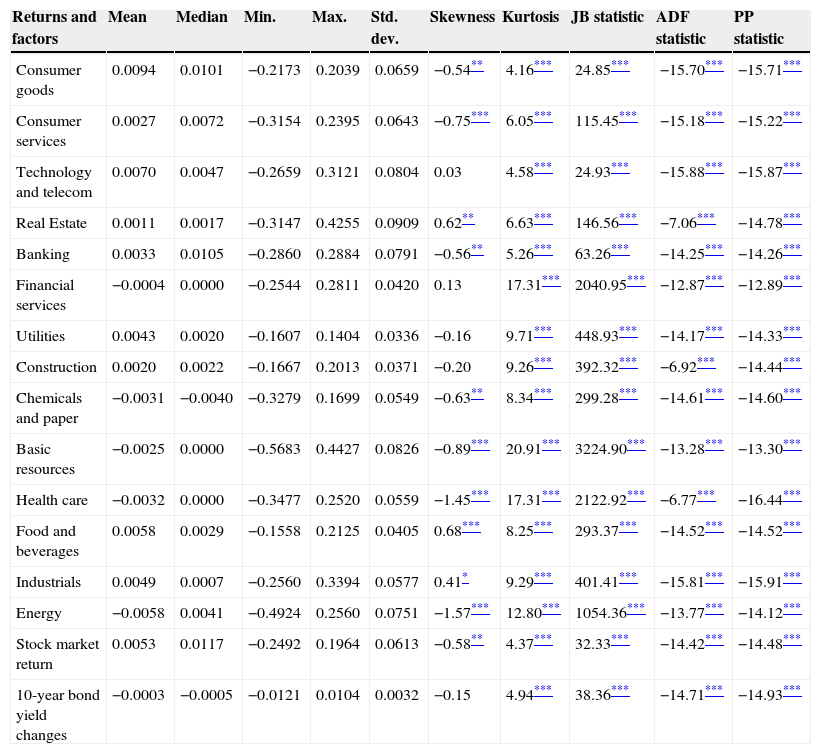
Table 1 presents descriptive statistics for the data. The average monthly return is positive for most industries as well as the overall stock market in line with the general increasing trend in stock prices. The average monthly change in 10-year government bond yields is, however, negative, reflecting the clear downward trend in Spanish long-term rates during the sample period. Based on the standard deviation, all industry and market returns have, as expected, higher volatility than the series of changes in 10-year Spanish bond yields. The measures of skewness indicate that the majority of industry returns are negatively skewed, meaning that negative shocks are more common than positive ones. Furthermore, all industry return series exhibit a kurtosis significantly larger than three, thereby implying leptokurtic behavior as compared to the Gaussian distribution. The Jarque–Bera test statistics corroborate this finding, rejecting the null hypothesis of normality in all cases at the 1% level. This result is consistent with that reported for the Spanish stock market by Miralles et al. (2011). A similar distributional picture emerges for the 10-year government bond yield change series. The Augmented Dickey–Fuller (ADF) and Phillips–Perron (PP) unit root tests indicate that the series of changes in 10-year bond rates and market and industry equity returns are all stationary (integrated of order zero). This finding is in line with that of earlier work on financial return data (Badillo et al., 2010; Czaja et al., 2009; Miralles et al., 2012).
Sample descriptive statistics of industry equity returns and 10-year Spanish government bond yield changes. January 1993–December 2012.
| Returns and factors | Mean | Median | Min. | Max. | Std. dev. | Skewness | Kurtosis | JB statistic | ADF statistic | PP statistic |
|---|---|---|---|---|---|---|---|---|---|---|
| Consumer goods | 0.0094 | 0.0101 | −0.2173 | 0.2039 | 0.0659 | −0.54** | 4.16*** | 24.85*** | −15.70*** | −15.71*** |
| Consumer services | 0.0027 | 0.0072 | −0.3154 | 0.2395 | 0.0643 | −0.75*** | 6.05*** | 115.45*** | −15.18*** | −15.22*** |
| Technology and telecom | 0.0070 | 0.0047 | −0.2659 | 0.3121 | 0.0804 | 0.03 | 4.58*** | 24.93*** | −15.88*** | −15.87*** |
| Real Estate | 0.0011 | 0.0017 | −0.3147 | 0.4255 | 0.0909 | 0.62** | 6.63*** | 146.56*** | −7.06*** | −14.78*** |
| Banking | 0.0033 | 0.0105 | −0.2860 | 0.2884 | 0.0791 | −0.56** | 5.26*** | 63.26*** | −14.25*** | −14.26*** |
| Financial services | −0.0004 | 0.0000 | −0.2544 | 0.2811 | 0.0420 | 0.13 | 17.31*** | 2040.95*** | −12.87*** | −12.89*** |
| Utilities | 0.0043 | 0.0020 | −0.1607 | 0.1404 | 0.0336 | −0.16 | 9.71*** | 448.93*** | −14.17*** | −14.33*** |
| Construction | 0.0020 | 0.0022 | −0.1667 | 0.2013 | 0.0371 | −0.20 | 9.26*** | 392.32*** | −6.92*** | −14.44*** |
| Chemicals and paper | −0.0031 | −0.0040 | −0.3279 | 0.1699 | 0.0549 | −0.63** | 8.34*** | 299.28*** | −14.61*** | −14.60*** |
| Basic resources | −0.0025 | 0.0000 | −0.5683 | 0.4427 | 0.0826 | −0.89*** | 20.91*** | 3224.90*** | −13.28*** | −13.30*** |
| Health care | −0.0032 | 0.0000 | −0.3477 | 0.2520 | 0.0559 | −1.45*** | 17.31*** | 2122.92*** | −6.77*** | −16.44*** |
| Food and beverages | 0.0058 | 0.0029 | −0.1558 | 0.2125 | 0.0405 | 0.68*** | 8.25*** | 293.37*** | −14.52*** | −14.52*** |
| Industrials | 0.0049 | 0.0007 | −0.2560 | 0.3394 | 0.0577 | 0.41* | 9.29*** | 401.41*** | −15.81*** | −15.91*** |
| Energy | −0.0058 | 0.0041 | −0.4924 | 0.2560 | 0.0751 | −1.57*** | 12.80*** | 1054.36*** | −13.77*** | −14.12*** |
| Stock market return | 0.0053 | 0.0117 | −0.2492 | 0.1964 | 0.0613 | −0.58** | 4.37*** | 32.33*** | −14.42*** | −14.48*** |
| 10-year bond yield changes | −0.0003 | −0.0005 | −0.0121 | 0.0104 | 0.0032 | −0.15 | 4.94*** | 38.36*** | −14.71*** | −14.93*** |
Notes: The table presents some descriptive statistics of the monthly industry equity returns and 10-year government bond yield changes, including mean, median, standard deviation (Std. dev.), minimum (Min.) and maximum (Max.) values and also skewness and kurtosis measures. JB denotes the statistic of the Jarque–Bera test for normality. The last two columns present the results of the augmented Dickey–Fuller (ADF) and Phillips–Perron (PP) unit root tests, respectively.
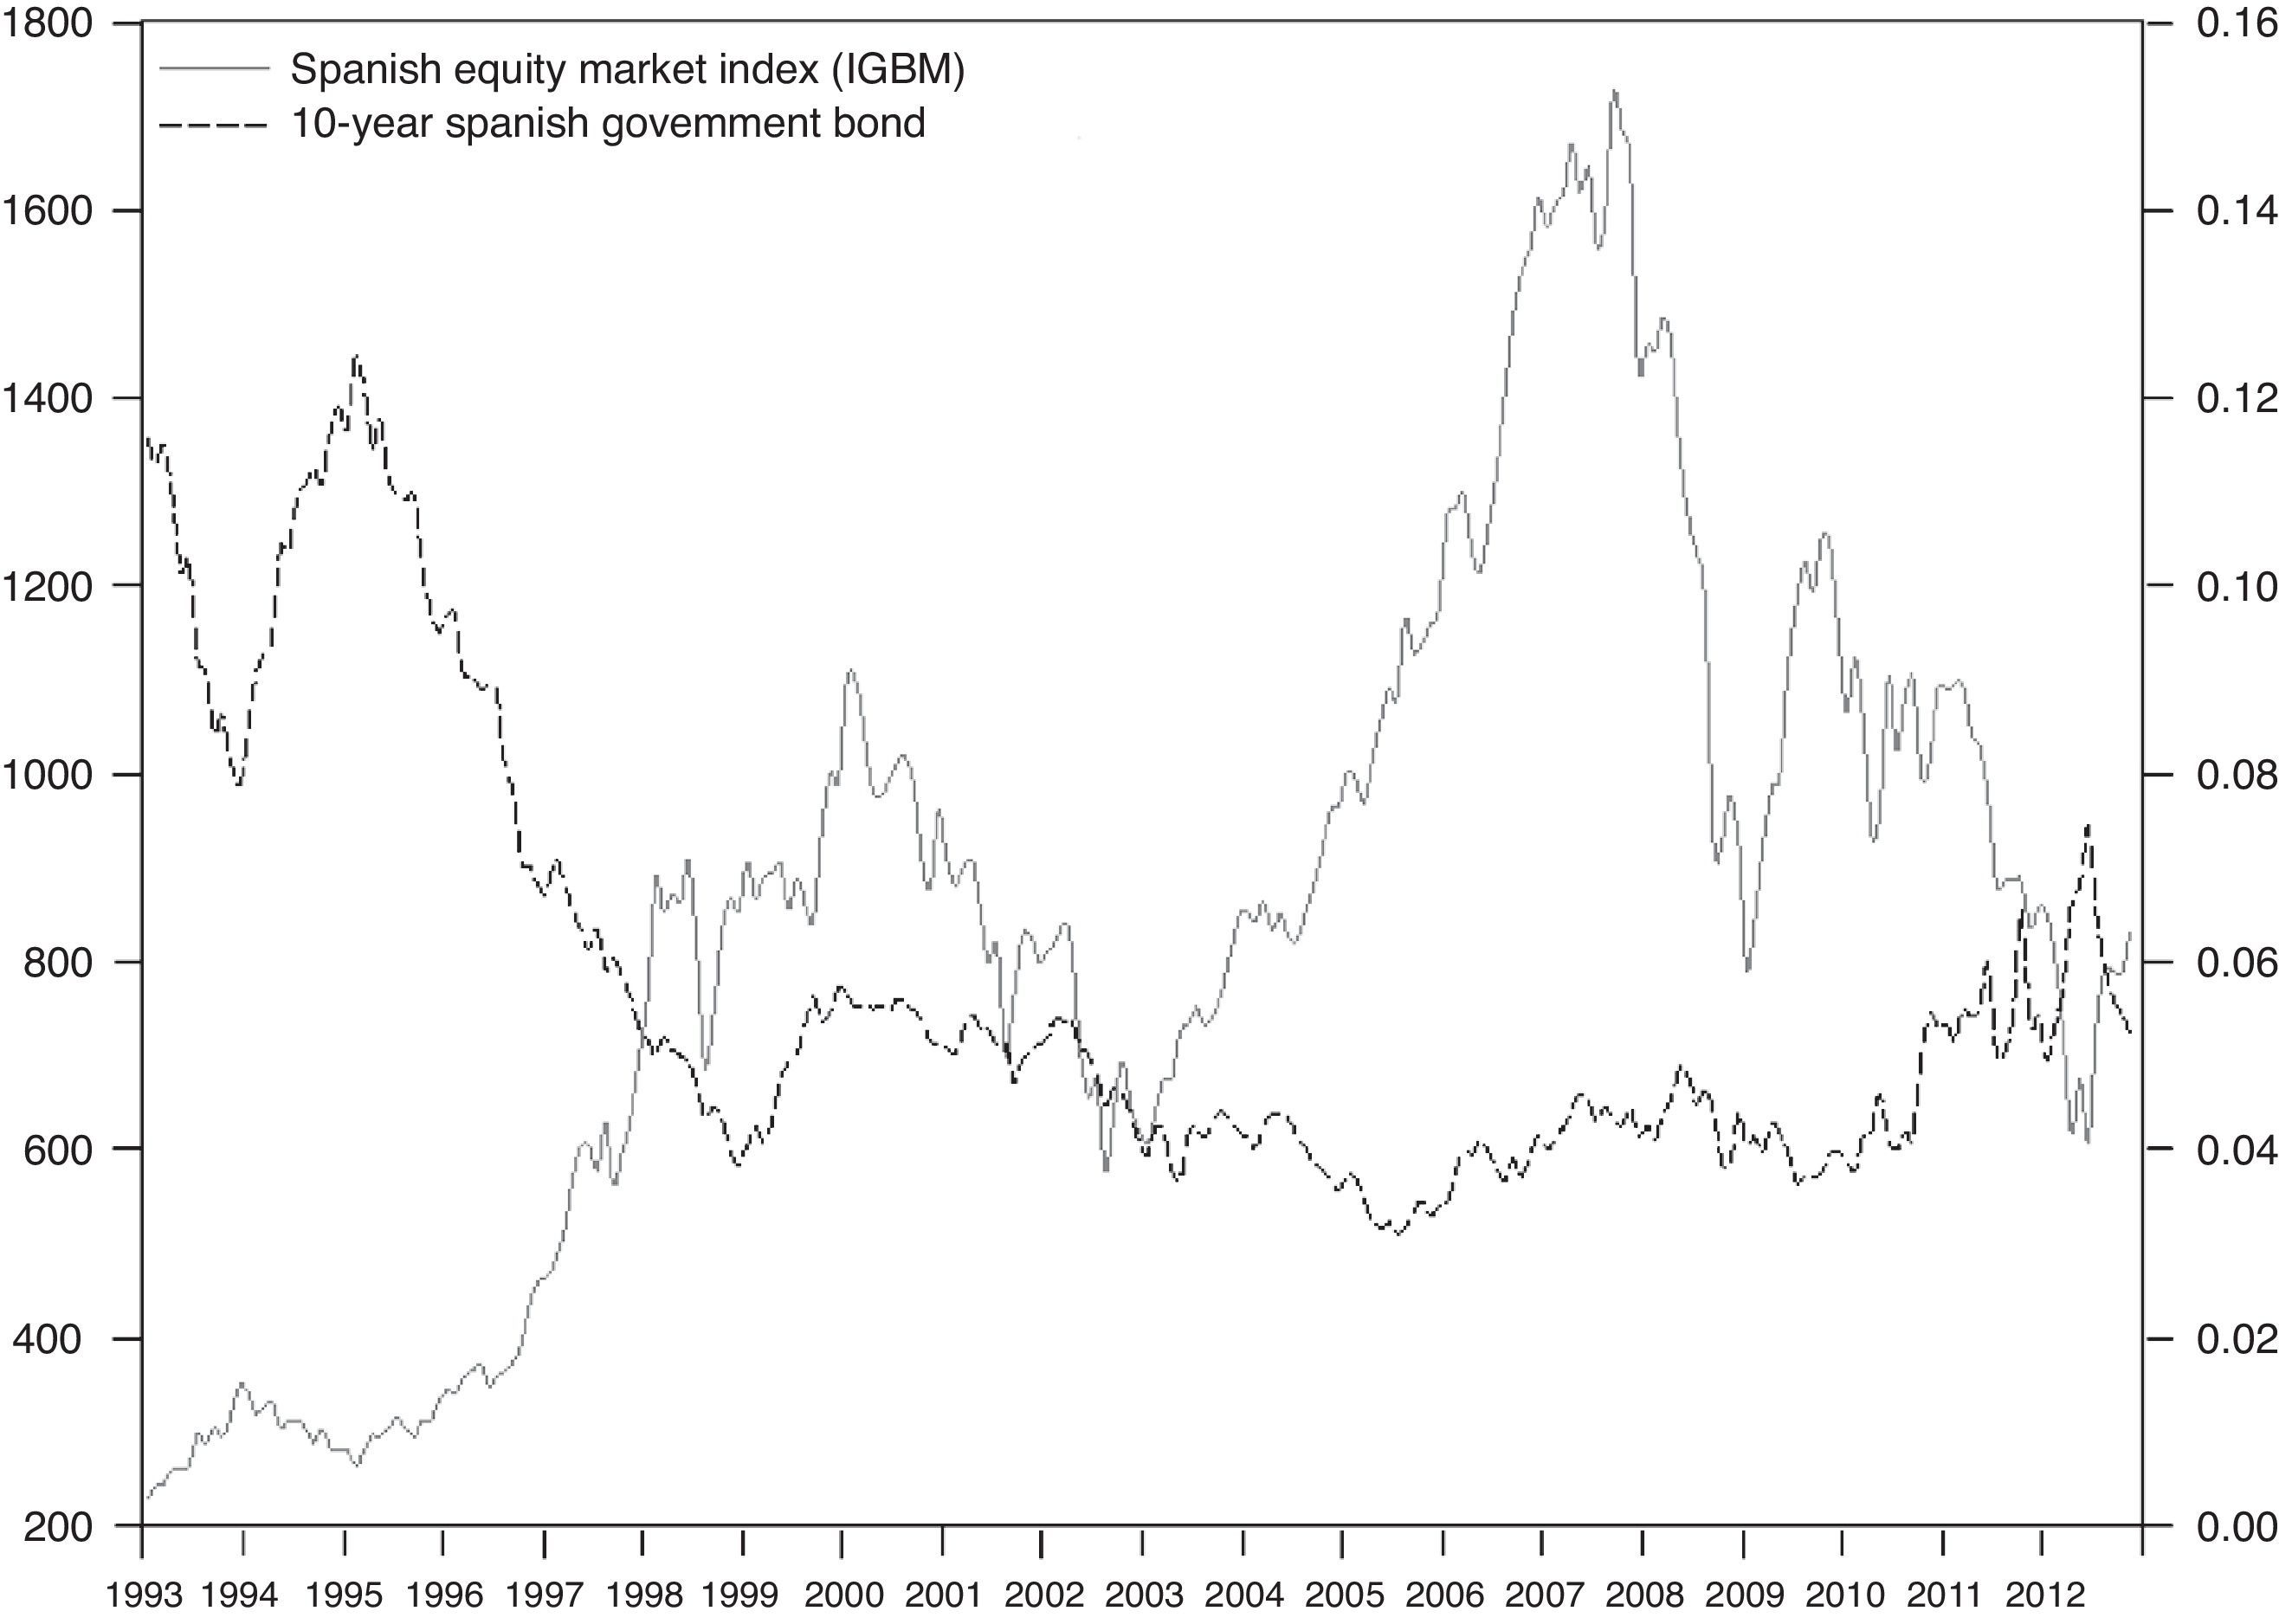
Fig. 1 presents the dynamics of the Spanish equity market index, proxied by the IGBM, and the yield on Spanish 10-year government bonds over the period 1993–2012. The stock market exhibits a general upward trend during most of the study period, only interrupted by the Internet bubble burst in March 2000 and the global financial crisis from late 2007. On the contrary, the yields on 10-year government securities display a downward trend up to the start of the sovereign debt crisis in the euro zone during the spring of 2010. This figure shows that the interest rate-stock market link over the full sample period is somewhat unclear. In particular, the Spanish market index and 10-year government bond yields have moved predominantly in opposite directions until approximately mid-1998. Since then, the connection between both variables is more ambiguous, although a positive correlation seems to exist for most of the 2000s.
Econometric methodologyWavelet analysis: basic considerations and the 10-year Spanish government bond yield from January 1993 to December 2012.")
Wavelet analysis is a technique for signal decomposition that was born in the 1980s and overcomes the major limitations of the Fourier transform. The wavelet transform combines information from both time and frequency domains and, therefore, preserves time information. Moreover, it does not require the stationarity of signals. This greater flexibility has fostered the rapid expansion of the wavelet approach in disciplines such as geophysics, engineering, climatology or medicine, although its application in economics and finance is only a relatively novel phenomenon (i.e. Gençay et al., 2002; Ramsey and Lampart, 1998a,b). Given its ability to partition any signal into components associated to different time scales, wavelet analysis provides a simple and intuitive way to study interactions between time series on a scale-by-scale basis, helping to uncover relationships that standard time series methods are not able to detect.
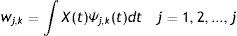
Wavelets are small waves that grow and decay in a limited time period. The wavelet transform is based on two special functions: the father wavelet (or scaling function) Φ(t) and the mother wavelet Ψ(t). Based on the mother wavelet, a family of daughter wavelets, Ψu,s(t), can be generated by simply scaling and translating Ψ:
where s is a scaling or dilation parameter that controls the length of the wavelet, while u is a location parameter which determines its position in the time domain. The father wavelet integrates to one and is good at representing the smooth and low-frequency parts of a signal, whereas the mother wavelet integrates to zero and is useful in capturing the detail and high-frequency components.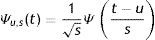
There are two types of wavelet transform: the continuous wavelet transform (CWT) and its discrete counterpart (DWT). The DWT is a compact representation of the data and is particularly suitable for noise reduction and data compression, whereas the CWT is better for feature extraction purposes. For a long time, wavelet applications in economics have concentrated on the DWT due to its greater simplicity and more parsimonious nature. The DWT produces only the minimal number of coefficients necessary to reconstruct the original signal. This reduction is achieved by discretizing the parameters u and s, so that u=k2−j and s=2−j, where j and k are integers representing the set of discrete dilatations and translations. In the DWT the number of observations has to be dyadic, i.e. an integer power of two.
By applying the DWT, any time series can be projected onto a sequence of father and mother wavelets from a specific family. A number of discrete wavelet families have proven their usefulness in financial data analysis, for example the Haar, Daubechies, Morlet, Mexican Hat, Symmlets, etc. Thus, a time series Xt can be represented as a linear combination of wavelet functions as follows:
where J is the number of multiresolution levels or scales and k ranges from 1 to the number of coefficients in each level.
sJ,k and wj,k are scaling or smooth and detail or wavelet coefficients, respectively, and are given by:
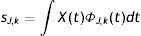
wj,k coefficients capture the high frequency content of the time series, while sJ,k coefficients represent the smooth behavior of the series. The magnitude of these coefficients offers a measure of the contribution of the corresponding wavelet function to the total series.
Thus, the original time series can be reconstructed as:
where SJ=∑ksJ,kΦJ,k(t) and Wj=∑kwj,kψj,k(t) for j=1,…,J are the smooth (or approximation) and detail (or wavelet) components of the signal, respectively. This reconstruction is known as multiresolution analysis.
In practice, the DWT is implemented via the pyramid algorithm derived by Mallat (1989). This technique consists of recursively applying a high-pass filter, which is based on the mother wavelet, and its counterpart low-pass filter to a given time series. The high-pass filter corresponds to a differencing operation and extracts the detail (high frequency) information of the signal, while the low-pass filter is associated to an averaging operation and extracts the coarse (low frequency) information. Specifically, the original Xt series is decomposed into approximation S1(t) and detail W1(t) components by convolving the series with the low-pass and high-pass filters, respectively. The approximation component S1(t) becomes the input for the next iteration step, so that two new approximation S2(t) and detail W2(t) components are obtained. This recursive procedure is continued until the decomposition level J is reached. Despite its great popularity, the standard DWT has several drawbacks. First, it is subject to boundary effects, which may produce unreliable results in the edge regions. Second, it is not shift invariant. Third, it requires time series with a dyadic length.
The Haar à trous wavelet (HTW) transformIn this study, the HTW transform developed by Murtagh et al. (2004) is applied as an alternative to traditional DWT. The HTW combines the à trous wavelet, which is a type of redundant wavelet transform, with the Haar wavelet, which is one of the simplest wavelets. The HTW transform offers a number of advantages over standard wavelet transforms. First, the use of the Haar wavelet function respects the asymmetric nature of the time-varying signal, so that scaling and wavelet coefficients are calculated only from data obtained previously in time. Therefore, the HTW does not suffer from boundary problems caused by the application of wavelet analysis on finite data sets. This absence of edge effects in the HTW transform allows the conservation of the whole information contained in the original series. Second, the HTW transform is flexible enough to accurately reflect the non-linear and chaotic dynamics of many financial time series. Third, the redundancy inherent in the à trous wavelet function implies that all wavelet components have the same length as the original time series, so it is easy to relate information at each resolution scale for the same time point. This property of redundancy of also means that the HTW is shift invariant.2
The HTW is a redundant version of the popular Haar wavelet transform that uses a non-symmetric low-pass filter h equal to 12,12 and can be described as follows. The scaling coefficients sj+1,k of a time series Xt at any scale can be obtained by convolving the smoothed version of the signal at the previous scale with the low-pass filter h=12,12:
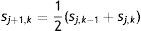
The detail coefficients can be calculated as the difference between the smoothed versions of the signal at two consecutive scales:
HTW-based variance, correlation and cross-correlation
The wavelet coefficients can be manipulated to obtain several statistical wavelet-based tools, such as the wavelet variance, wavelet correlation, and wavelet cross-correlation, which provide an alternative representation of the variability and association structure between time series on a scale-by-scale basis. These three tools are defined analogously to the usual variance, correlation and cross-correlation measures in time series analysis.
The wavelet variance decomposes the variance of a time series on a scale-by-scale basis and helps to identify what time scales are the dominant contributors to the overall variability of the series. As noted by Gallegati (2008), the wavelet variance at scale τj of a stationary stochastic process Xt, σX2(τj), is given by:
where τj=2j−1 and wj,t denote the wavelet coefficients of Xt at scale τj.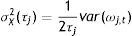
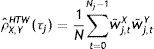
According to Jammazi (2012b), the HTW-based variance estimator can be also expressed in terms of the normalized sum of the squared wavelet coefficients:
where σˆX,HTW2(τj) is the estimated wavelet variance at scale τj,Nj=N/2j the number of wavelet coefficients at the resolution level j and N the sample size. Since the HTW transform is not affected by boundary conditions, the HTW variance estimator allows to analyze a signal by using all the wavelet coefficients.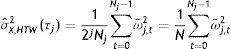
The HTW framework also enables us to derive the wavelet correlation and cross-correlation. These wavelet-based tools make it possible to quantify the degree of association between two stochastic processes on a scale-by-scale basis. Analogously to the usual correlation coefficient in time series analysis, the wavelet correlation coefficient at scale τj, ρX,Y(τj), can be calculated as the ratio of the wavelet covariance between Xt and Yt, denoted by γX,Y(τj), and the square root of their wavelet variances:
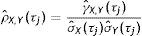
The HTW-correlation at scale τj can be also expressed in terms of wavelet coefficients:
Just as the classical cross-correlation is used to determine lead/lag relationships between two time series in the time-domain, the wavelet cross-correlation gives information on lead/lag relationships on a scale-by-scale basis. The HTW cross-correlation coefficient estimator for scale τj and time lag λ, denoted by ρˆX,Y,λHTW(τj), can be calculated as:
Empirical findingsEstimated HTW-based variance, correlation and cross-correlation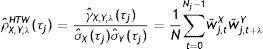
This section examines the linkage between changes in 10-year Spanish government bond yields and industry equity returns at different time horizons by using the HTW transform with 6 time scales.3 Each scale is associated with a particular time period. Thus, since monthly data are used, the scale 1 represents the highest frequency and is associated with a time horizon from 2 to 4 months. In turn, scales 2 to 6 correspond to 4–8, 8–16, 16–32, 32–64 and 64–128 month periods, respectively.
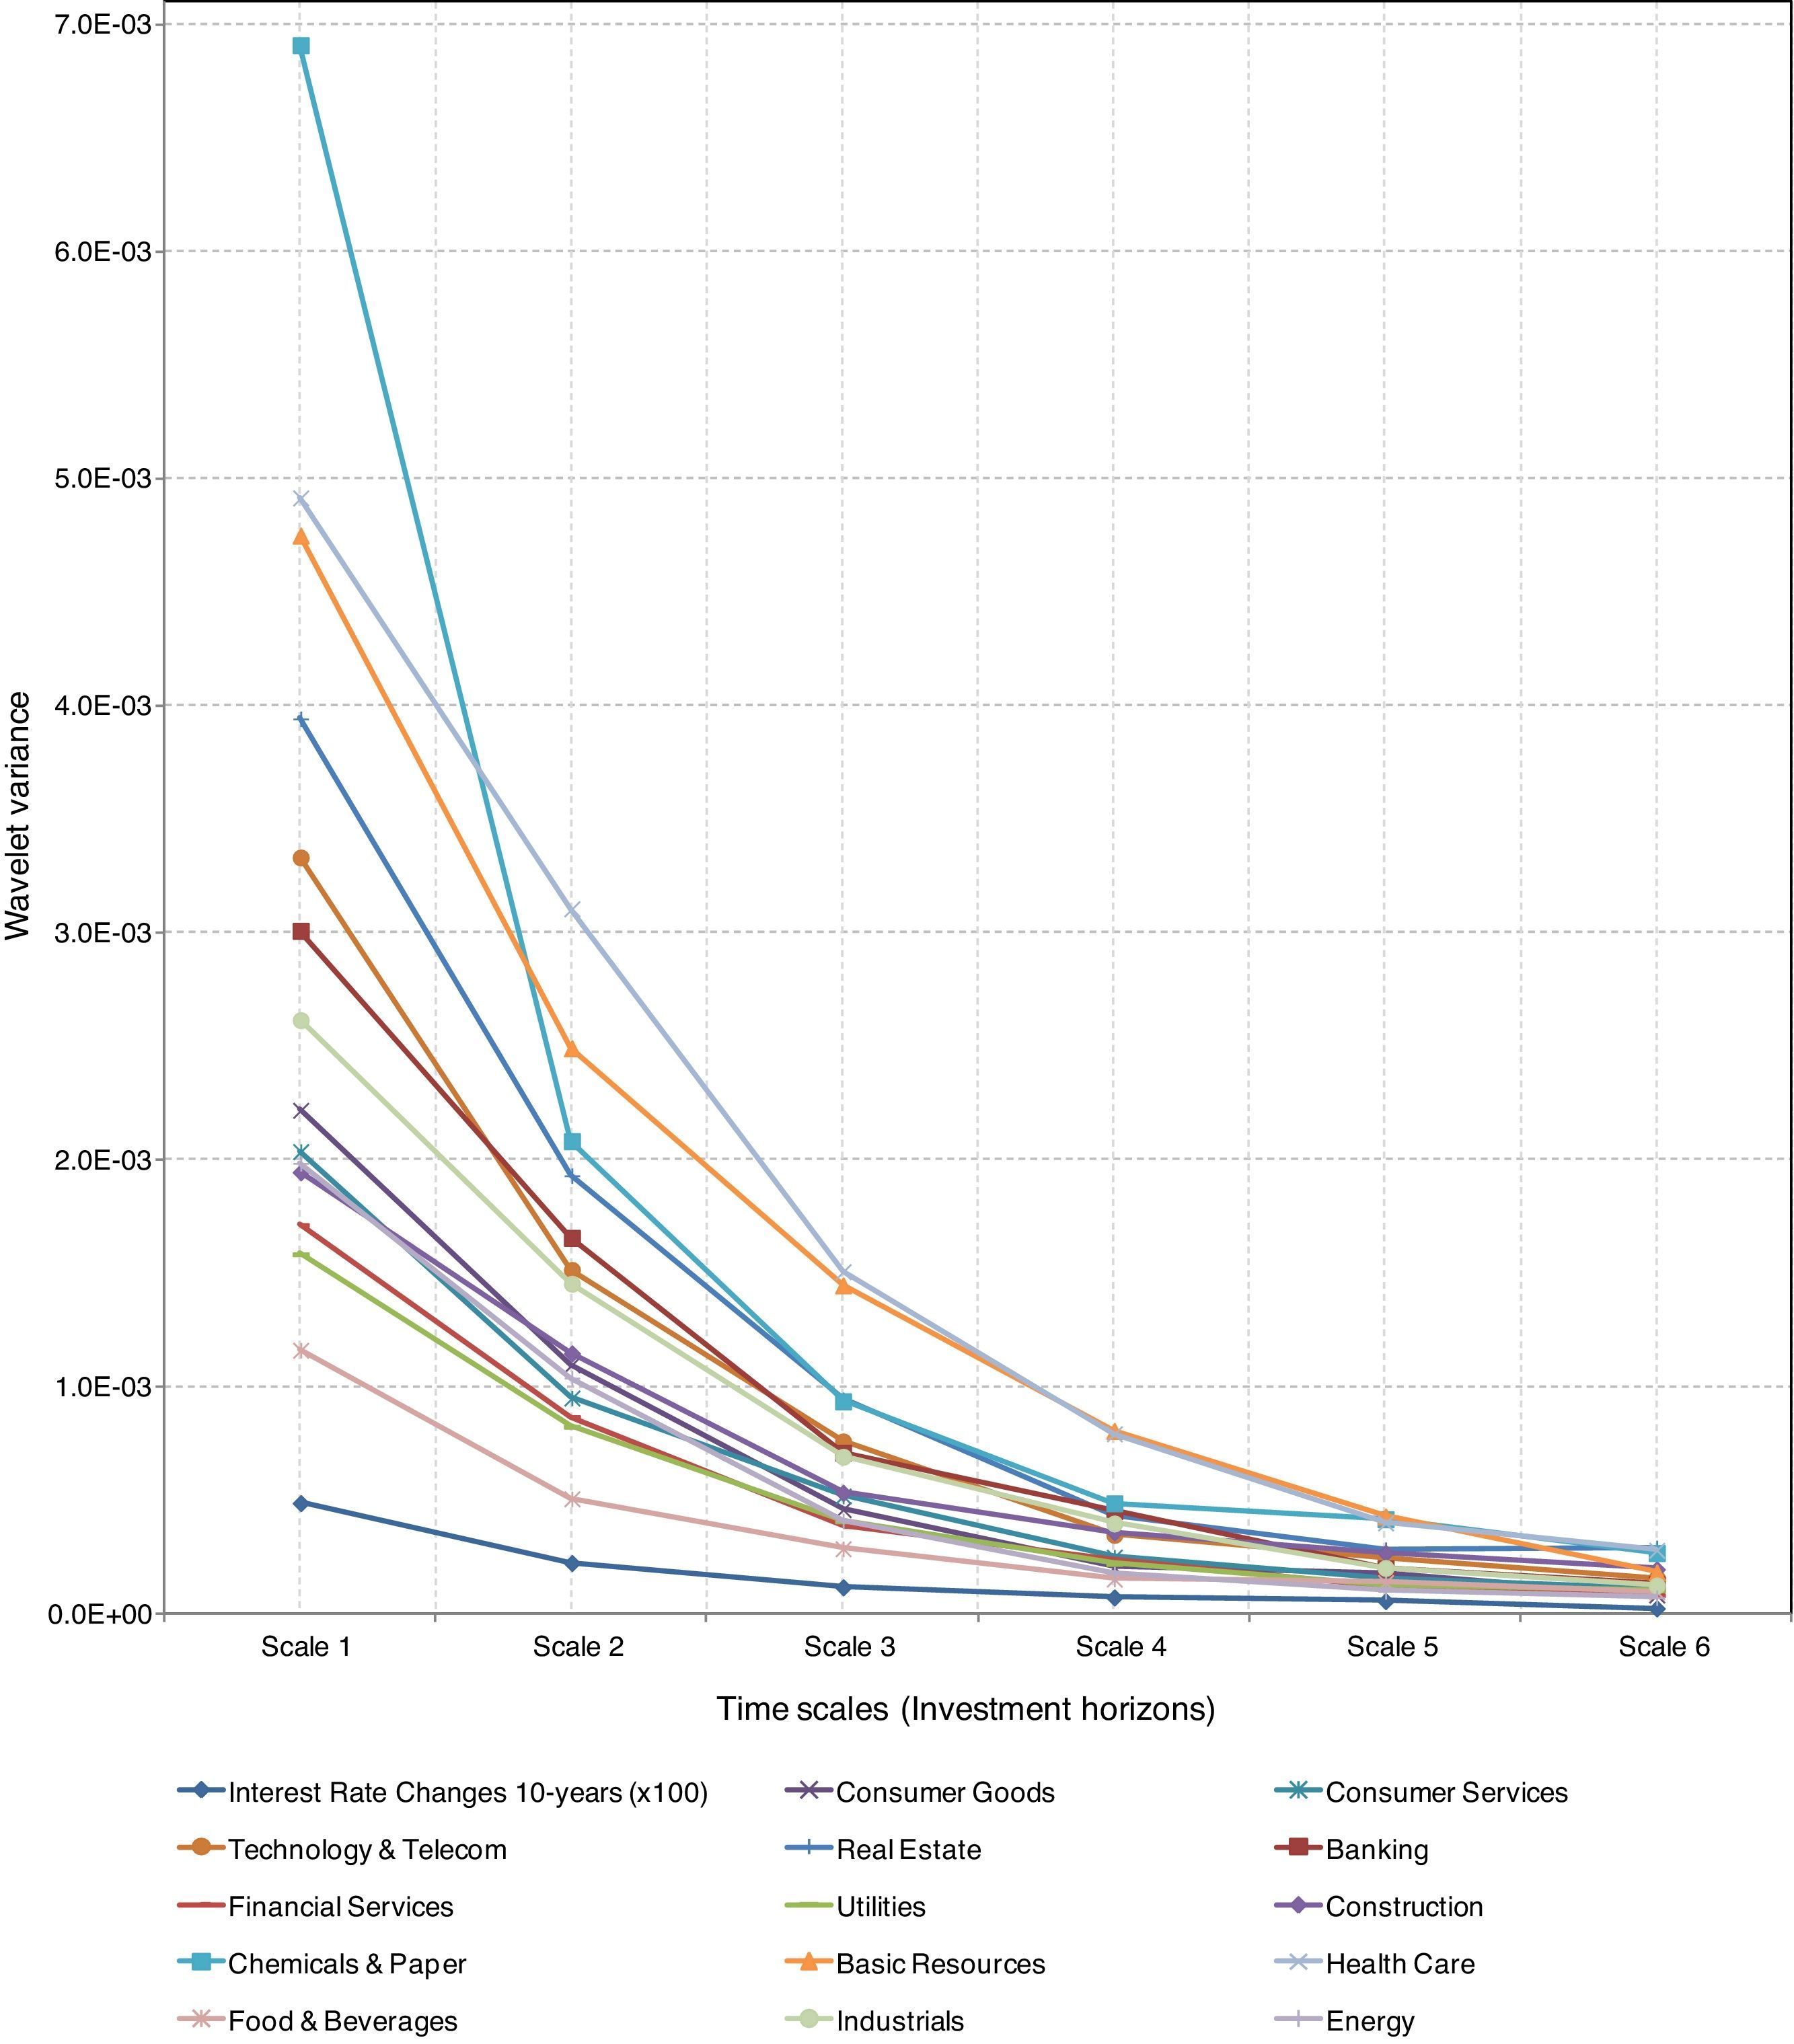
Fig. 2 illustrates the wavelet variances of industry returns and changes in 10-year bond rates derived from the HTW decomposition. The straight lines represent the estimated wavelet variances at different time horizons. Two things are noteworthy from this figure. First, the greatest variability of all time series is observed at shorter time horizons, suggesting that movements in industry equity returns and 10-year interest yields are mainly caused by short-term fluctuations. There is an approximate negative linear relationship between the wavelet variance and the scale, so that the HTW-based variances of 10-year bond yield changes and industry returns decline as the scale increases. This decreasing trend in variability indicates that investors with short-term horizons face higher risks than their longer horizon counterparts. Second, as expected, the HTW-based variances of all industry stock returns are larger than those of 10-year bond rate changes over all time horizons. This finding is consistent with that reported by Kim and In (2007) for the G7 countries, confirming that the stock market is more volatile than the long-term public debt market regardless of the investment horizon. Further, all industry returns exhibit a similar behavior in terms of wavelet variances.
 transform.")
HTW-based variance of changes in 10-year Spanish government bond yields and industry equity returns. Notes: This figure reports the wavelet variances of Spanish industry equity returns and changes in 10-year Spanish government bond yields for the different time horizons or scales estimated with the Haar à trous wavelet (HTW) transform.
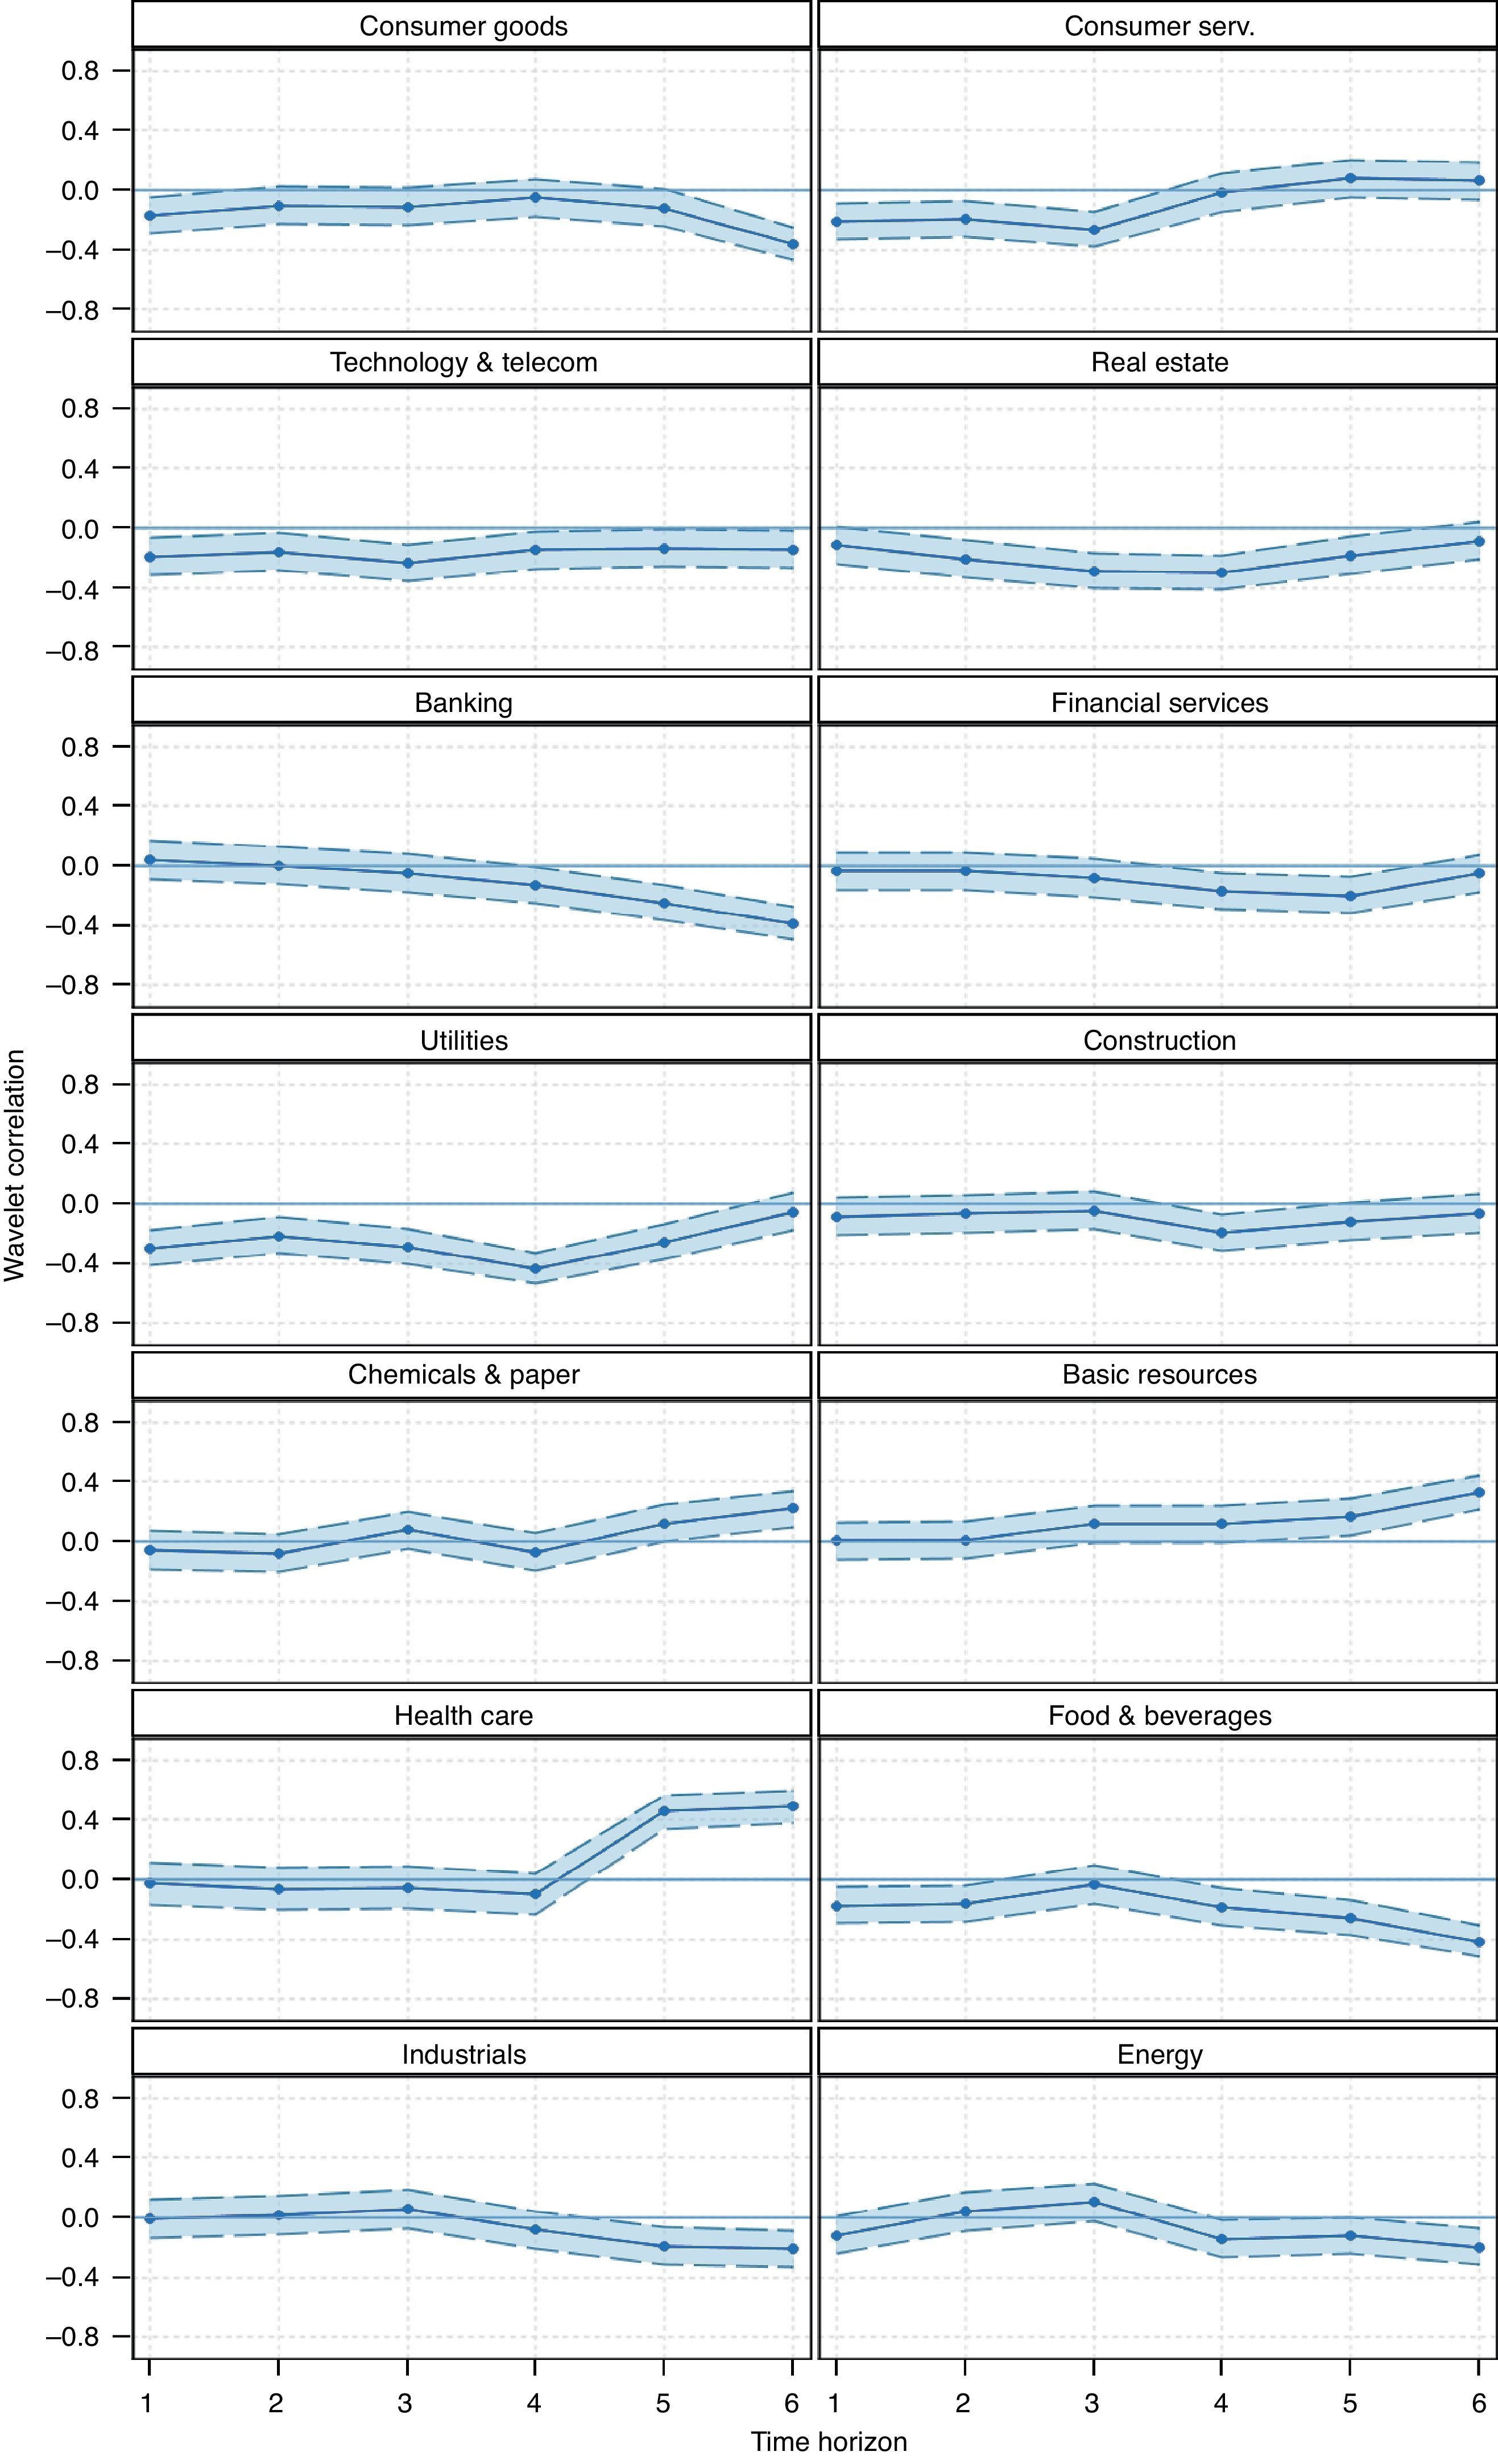
The results of the wavelet correlation analysis for the pairs composed of changes in 10-year government bond rates and each of industry returns over the six time horizons are displayed in Fig. 3 The estimated HTW-based correlation coefficients are represented by a solid line. The 95% confidence intervals are also shown through dashed lines and they permit reliable statistical inference as to whether the correlations are significantly different from zero.4 It is found that the wavelet contemporaneous correlation between 10-year bond yield fluctuations and industry returns varies according to the time horizon considered, suggesting that the interest rate-stock market link is a multiscale phenomenon. The highest level (in absolute value) of HTW-correlation tends to be detected at longer horizons, indicating that long time horizons are the most important contributors to the association between yields on 10-year bonds and stock market performance. In fact, the wavelet correlation is not significantly different from zero at shorter horizons, i.e. scales 1 and 2, for a large number of industries. On the contrary, the HTW-based correlation is significant at longer horizons, i.e. scales 5 and 6, for most industries. This result is in line with that of Çifter and Ozun (2008), Hamrita and Trifi (2011) and Kim and In (2007) for different countries also using wavelet methodology.

HTW-based correlation between 10-year Spanish government bond yield changes and industry equity returns. Notes: Estimates of the HTW-based correlation coefficients between changes in 10-year government bond yields and each of industry equity returns at the different time horizons are shown with a solid line. The 95% confidence intervals around the wavelet correlation estimates constructed by using the Fisher's transformation are drawn with dashed lines.
Moreover, the wavelet correlation results reveal that there is considerable heterogeneity among industries in terms of the degree of connection between movements in 10-year bond rates and stock returns. In particular, Utilities, Food and Beverages, Real Estate, Technology and Telecommunications, and Banking emerge as those industries most closely linked to changes in 10-year bond yields. This evidence supports the commonly held view that regulated, heavily indebted and banking sectors are the most interest rate sensitive. Again, this is consistent with earlier work focused on different countries and periods of time and using a variety of methodologies (Bartram, 2002; Reilly et al., 2007; Sweeney and Warga, 1986). In contrast, a broad group of industries such as Financial Services, Health Care, Consumer Goods, Chemicals and Paper, Industrials, and Construction are identified as sectors hardly linked to 10-year bond yield movements. This finding is not surprising since firms in these industries are typically perceived as more sensitive to other risk factors such as business cycle fluctuations.
The sign of the HTW-based correlation is mostly negative, implying that Spanish firms tend to benefit from interest rate falls. This is due to the fact that reductions in long-term interest rates lead to a decrease in the borrowing costs of companies, with the consequent positive effect on their profits and share prices. In addition, lower interest rates increase the attractiveness of stocks as an investment compared with bonds and might induce a shift into stocks, pushing up equity prices. This finding is also in keeping with prior research conducted in other developed countries (Kim and In, 2007; Korkeamäki, 2011; Reilly et al., 2007). Nevertheless, a significant positive contemporaneous correlation between changes in 10-year bond yields and industry returns is observed at longer horizons for some industries such as Health Care, Basic Resources, and Chemicals and Paper. One possible explanation is related to the pro-cyclical nature of these sectors. It is well known that the long-term stock market performance of pro-cyclical industries is highly dependent on economic growth. In turn, in environments of low interest rates, such as that in force since the late 1990s, increases in interest rates can be associated with an improving economic situation. Therefore, it is not surprising that 10-year government bond rates and equity returns of these industries move in tandem over long time horizons mainly driven by the economic outlook.
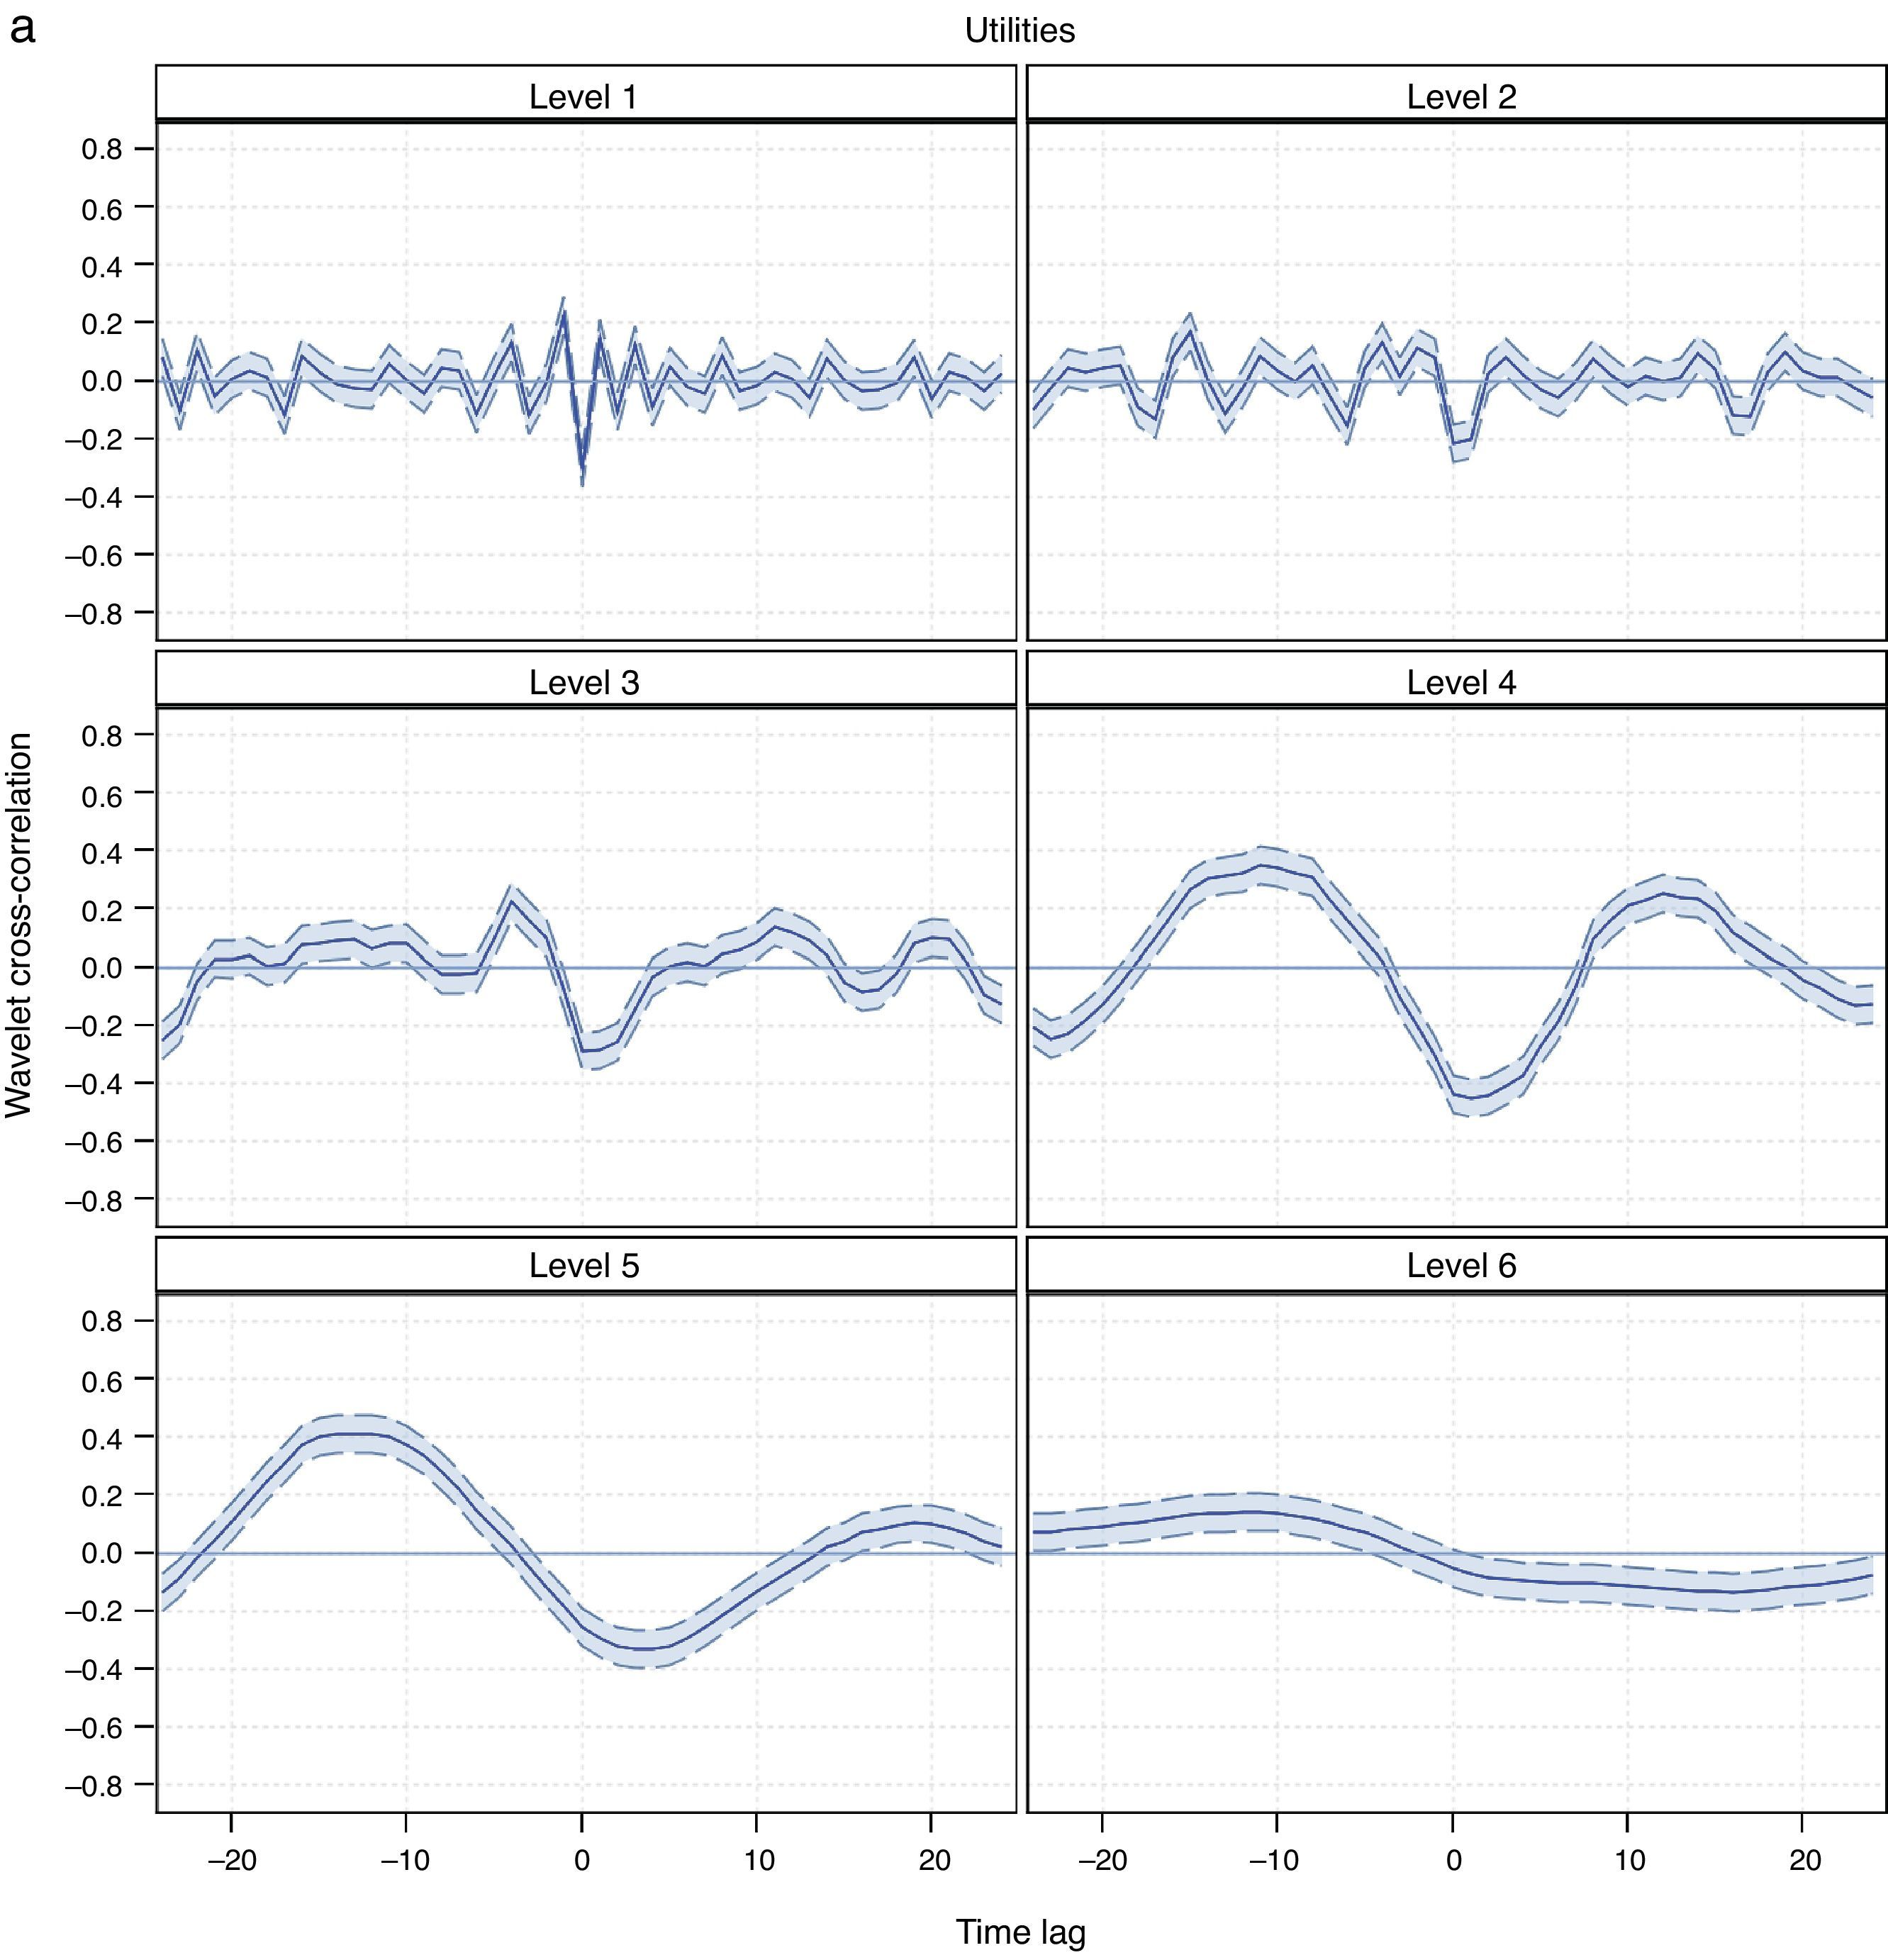
Since the wavelet correlation does not take into account possible lagged interest rate effects on industry returns or vice versa, the wavelet cross-correlation is calculated to shed light on the lead-lag relationships between these variables at different investment horizons. Fig. 4 plots the estimated HTW-based cross-correlation coefficients between 10-year bond yield fluctuations at time t and industry returns at time t−λ and t+λ up to 24-month time lags for the six time horizons.5 The corresponding approximate confidence intervals at 95% level are also displayed in order to assess the statistical significance of the estimated wavelet cross-correlation.
. The 95% confidence intervals around the wavelet cross-correlation estimates constructed by using the Fisher's transformation are drawn with dashed lines.")
. The 95% confidence intervals around the wavelet cross-correlation estimates constructed by using the Fisher's transformation are drawn with dashed lines.")
. The 95% confidence intervals around the wavelet cross-correlation estimates constructed by using the Fisher's transformation are drawn with dashed lines.")
HTW-based cross-correlation between 10-year Spanish government bond yield changes and industry equity returns. Notes: Estimates of the HTW-based cross-correlation coefficients between changes in 10-year government bond yields and industry equity returns against time leads and lags for the six time horizons considered are represented by a solid line. The range of leads/lags is 24 months. The cross-correlation is calculated by shifting the second time series in the pair (in this case the industry equity return). The 95% confidence intervals around the wavelet cross-correlation estimates constructed by using the Fisher's transformation are drawn with dashed lines.
Similarly to the HTW contemporaneous correlation, the estimated HTW cross-correlation shows that the magnitude of the association between changes in yields on 10-year bonds and industry returns increases with the time horizon. At shorter horizons, i.e. scales 1 and 2, the lead-lag link between both variables is insignificant for virtually all leads and lags regardless of the industry. However, the cross-correlation dynamics becomes more apparent at longer horizons. The wavelet cross-correlation coefficients reveal a significant bidirectional relationship between movements in 10-year bond yields and industry returns at scales 5 and 6 for most industries. In particular, the lags of industry returns are statistically significant, thereby meaning that industry returns lead changes in 10-year bond rates, and the leads of industry returns are also significant, which implies that 10-year bond yield fluctuations lead industry returns. Further, the leading as well as the lagging periods increase as does the time scale.
Overall, the results of the wavelet correlation and cross-correlation indicate that the interest rate-stock market link is not fixed over various time horizons, but it increases with the time frame, a result well documented in the empirical literature on this issue (Çifter and Ozun, 2008; Hamrita and Trifi, 2011; Kim and In, 2007). The presence of a stronger connection between 10-year bond rate changes and industry returns as the investment horizon increases has a convincing explanation. At shorter horizons, the linkage between these variables is practically non-existent as the short-term dynamics of stock returns is mainly driven by ephemeral phenomena such as sporadic events, changes in market sentiment, and psychological factors (Zhou, 2012). In contrast, at longer horizons the relationship becomes stronger as macroeconomic variables such as interest rates exert a more predictable influence on the stock market. In addition, long-term bonds and equities are close substitutes for investors with long horizons, so it seems natural that they move together and influence each other over long time horizons.
Robustness checksTwo robustness tests are performed to check the validity of the above results. In the first test, the wavelet analysis has been repeated by replacing the yields on 10-year government bonds with a shorter-term interest rate such as the yield on 1-year Treasury bills. For the vast majority of industries the HTW-based correlation coefficients have lower statistical significance, irrespective of the time horizon considered, than those obtained from 10-year bond rates. Moreover, the HTW cross-correlation estimated by using 1-year Treasury bill yields tends to be lower in magnitude and statistical significance over the different time horizons than that previously provided using 10-year bond yields. These findings support the widespread view that the interest rate-stock market link is closer when considering long-term interest rates. 6
In the second robustness check, a multiscale Granger causality test is performed in order to validate the results of the wavelet cross-correlation. This test investigates the causal relationships in the Granger sense between changes in yields on 10-year bonds and industry returns at various time horizons. It consists of applying a Granger causality test on a scale-by-scale basis between the wavelet details of changes in 10-year bond rates and industry returns. To this end, the following VAR model of order K is estimated:
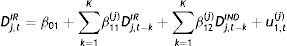
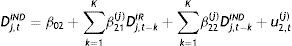
where Dj,tIR is the HTW-based detail component of the series of changes in 10-year bond yields at scale τj, Dj,tIND is the HTW-based detail component of the series of returns of the industry considered at scale τj. The number of lags of the model, K, is chosen according to the Schwarz information criterion and Akaike information criterion.
In order to investigate whether industry equity returns Granger cause movements in 10-year government bond yields, we test whether the null hypothesis that all of the β12(j) parameters are zero can be statistically rejected. And vice versa, in order to ascertain whether changes in 10-year bond rates Granger cause industry equity returns we test whether the null hypothesis that all of the β21(j) parameters are zero can be statistically rejected. Both null hypotheses are tested by using a F-test.
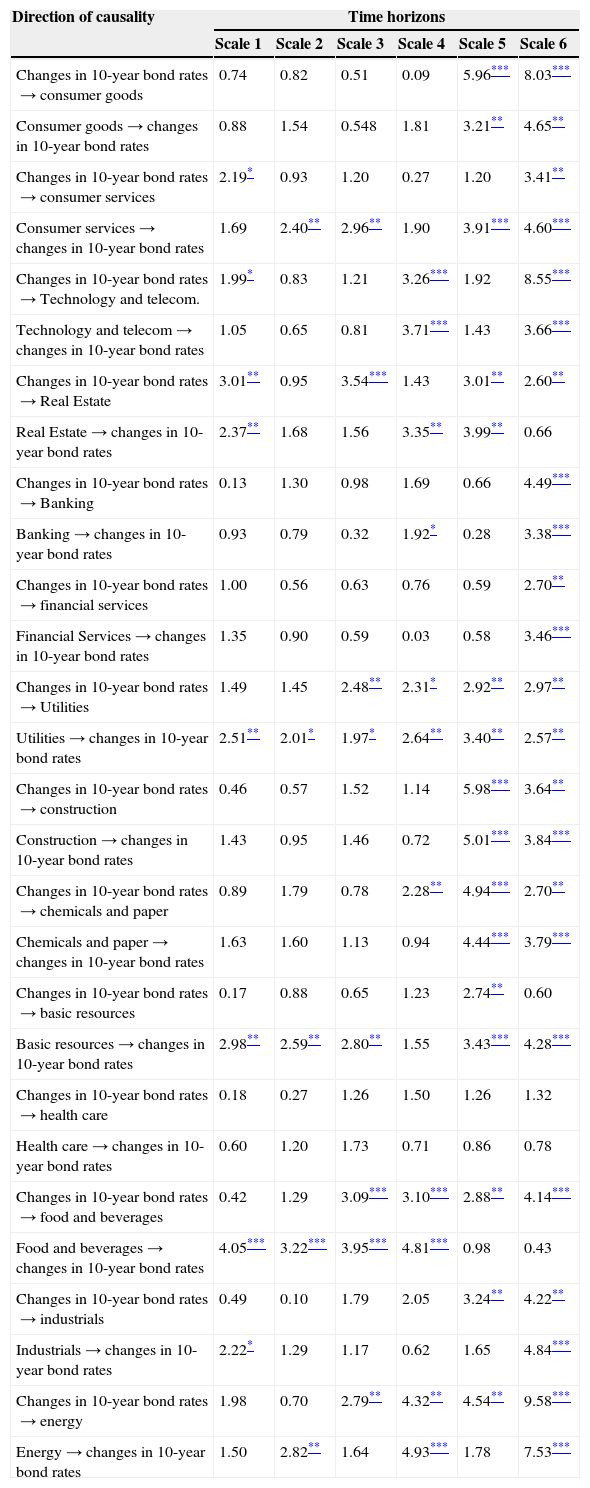
The findings of the Granger causality tests at different time horizons, reported in Table 2, are broadly consistent with those of the wavelet analysis outlined above in terms of the multiscale nature of the interest rate-stock market link and the industries with higher and lower levels of connection with 10-year government bond rates. Thus, the evidence of Granger causality is in general quite weak at shorter horizons. However, the causality is dramatically strengthened at long horizons. Significant bidirectional causal relationships between movements in 10-year bond yields and industry returns are found at longer horizons for most industries, confirming that the association between 10-year bond yield fluctuations and Spanish stock market increases with the investment horizon.
Granger causality tests between changes in 10-year government bond yields and industry equity returns at various time horizons.
| Direction of causality | Time horizons | |||||
|---|---|---|---|---|---|---|
| Scale 1 | Scale 2 | Scale 3 | Scale 4 | Scale 5 | Scale 6 | |
| Changes in 10-year bond rates→consumer goods | 0.74 | 0.82 | 0.51 | 0.09 | 5.96*** | 8.03*** |
| Consumer goods→changes in 10-year bond rates | 0.88 | 1.54 | 0.548 | 1.81 | 3.21** | 4.65** |
| Changes in 10-year bond rates→consumer services | 2.19* | 0.93 | 1.20 | 0.27 | 1.20 | 3.41** |
| Consumer services→changes in 10-year bond rates | 1.69 | 2.40** | 2.96** | 1.90 | 3.91*** | 4.60*** |
| Changes in 10-year bond rates→Technology and telecom. | 1.99* | 0.83 | 1.21 | 3.26*** | 1.92 | 8.55*** |
| Technology and telecom→changes in 10-year bond rates | 1.05 | 0.65 | 0.81 | 3.71*** | 1.43 | 3.66*** |
| Changes in 10-year bond rates→Real Estate | 3.01** | 0.95 | 3.54*** | 1.43 | 3.01** | 2.60** |
| Real Estate→changes in 10-year bond rates | 2.37** | 1.68 | 1.56 | 3.35** | 3.99** | 0.66 |
| Changes in 10-year bond rates→Banking | 0.13 | 1.30 | 0.98 | 1.69 | 0.66 | 4.49*** |
| Banking→changes in 10-year bond rates | 0.93 | 0.79 | 0.32 | 1.92* | 0.28 | 3.38*** |
| Changes in 10-year bond rates→financial services | 1.00 | 0.56 | 0.63 | 0.76 | 0.59 | 2.70** |
| Financial Services→changes in 10-year bond rates | 1.35 | 0.90 | 0.59 | 0.03 | 0.58 | 3.46*** |
| Changes in 10-year bond rates→Utilities | 1.49 | 1.45 | 2.48** | 2.31* | 2.92** | 2.97** |
| Utilities→changes in 10-year bond rates | 2.51** | 2.01* | 1.97* | 2.64** | 3.40** | 2.57** |
| Changes in 10-year bond rates→construction | 0.46 | 0.57 | 1.52 | 1.14 | 5.98*** | 3.64** |
| Construction→changes in 10-year bond rates | 1.43 | 0.95 | 1.46 | 0.72 | 5.01*** | 3.84*** |
| Changes in 10-year bond rates→chemicals and paper | 0.89 | 1.79 | 0.78 | 2.28** | 4.94*** | 2.70** |
| Chemicals and paper→changes in 10-year bond rates | 1.63 | 1.60 | 1.13 | 0.94 | 4.44*** | 3.79*** |
| Changes in 10-year bond rates→basic resources | 0.17 | 0.88 | 0.65 | 1.23 | 2.74** | 0.60 |
| Basic resources→changes in 10-year bond rates | 2.98** | 2.59** | 2.80** | 1.55 | 3.43*** | 4.28*** |
| Changes in 10-year bond rates→health care | 0.18 | 0.27 | 1.26 | 1.50 | 1.26 | 1.32 |
| Health care→changes in 10-year bond rates | 0.60 | 1.20 | 1.73 | 0.71 | 0.86 | 0.78 |
| Changes in 10-year bond rates→food and beverages | 0.42 | 1.29 | 3.09*** | 3.10*** | 2.88** | 4.14*** |
| Food and beverages→changes in 10-year bond rates | 4.05*** | 3.22*** | 3.95*** | 4.81*** | 0.98 | 0.43 |
| Changes in 10-year bond rates→industrials | 0.49 | 0.10 | 1.79 | 2.05 | 3.24** | 4.22** |
| Industrials→changes in 10-year bond rates | 2.22* | 1.29 | 1.17 | 0.62 | 1.65 | 4.84*** |
| Changes in 10-year bond rates→energy | 1.98 | 0.70 | 2.79** | 4.32** | 4.54** | 9.58*** |
| Energy→changes in 10-year bond rates | 1.50 | 2.82** | 1.64 | 4.93*** | 1.78 | 7.53*** |
Notes: This table reports the results of the multiscale Granger causality tests between changes in 10-year Spanish government bond yields and industry equity returns at different time horizons. Scale 1 represents the finest time horizon and captures dynamics with a period length of 2–4 months. Scales 2, 3, 4, 5 and 6 capture dynamics with a period of 4–8, 8–16, 16–32, 32–64 and 64–128 months, respectively.
This paper investigates the interrelationships between changes in 10-year government bond yields and the Spanish stock market from an industry perspective across time and frequency by using a wavelet approach. Because financial markets are composed of a variety of agents who have different investment horizons, it is postulated that the interest rate-stock market link may differ across time horizons or scales. Wavelet analysis is based on decomposing time series into different time scales and provides a natural platform for characterizing interactions between time series on a scale-by-scale basis. Specifically, the Haar à trous wavelet transform, a novel technique proposed by Murtagh et al. (2004) which overcomes the main limitations of conventional wavelet transforms, is applied. In order to gain a deeper understanding of the relationship between interest rate changes and industry equity returns, three wavelet-based tools are implemented, namely wavelet variance, correlation and cross-correlation.
The empirical results show that the Spanish stock market is tightly connected with the development of long-term interest rates, although the extent of linkage varies markedly across industries and depending on the time horizon considered. On the one hand, Utilities, Food and Beverages, Real Estate, and Banking are identified as the industries most closely linked to changes in 10-year bond rates. In contrast, long-term bond yields seem to have very little influence on the stock market performance of a broad range of industries such as Health Care, Financial Services, Chemicals and Paper, Construction, and Industrials. This heterogeneous pattern of connection is in line with previous research in this field (Bartram, 2002; Reilly et al., 2007; Sweeney and Warga, 1986).
Moreover, the relationship between movements in 10-year bond rates and industry returns is a function of the measurement horizon. The nexus between these variables is weak at shorter time horizons (high frequencies), but it becomes stronger at longer horizons (low frequencies). In this regard, significant feedback effects between 10-year bond yield fluctuations and industry returns are detected only at longer horizons. This finding agrees with the notion that investors with long-term horizons (i.e. pension funds, mutual funds or insurance companies) are more likely to follow macroeconomic fundamentals, such as interest rates, in their investment decisions than investors with a shorter time frame such as speculative traders. Therefore, the widely held belief that interest rates represent a major driving force of stock market performance appears to be true in the Spanish case only over long time horizons and for some industries. As expected, the sign of the interest rate-stock market link is primarily negative, suggesting that Spanish companies are, on average, benefited by falls in interest rates.
The horizon-dependence of the linkage between movements in 10-year bond yields and industry returns indicates that time horizon-conscious investors should consider the variations in the degree of connection between these variables for portfolio selection and risk management purposes. In fact, the effectiveness of portfolio selection and risk management strategies could be significantly enhanced by incorporating the horizon-dependent link between interest rates and equity market. In addition, the evidence presented here clearly shows that the traditional correlation coefficient in the time domain cannot be used as a universal measure of the degree of linkage between changes in interest rates and stock returns.
The authors wish to express their sincere gratitude to Rania Jammazi for their valuable comments and suggestions to improve this paper. The authors wish to acknowledge the comments of two editors of the BRQ journal, Lucio Fuentelsaz and Susana Menéndez, as well as two anonymous referees. The authors are also indebted to Jose Miguel Ferrer for his detailed and critical reading of the paper.
As noted by Schleicher (2002), the wavelet decomposition of a signal can be compared to the activity of a camera-lens. Zooming out the lens brings a broad landscape, while zooming in the lens allows to find details that are not observable in the landscape portrait.
For a more complete and detailed discussion of the Haar à trous wavelet transform, see Murtagh et al. (2004) and Jammazi (2012b).
All computations of the HTW algorithm in this study have been performed by using the Excel utility developed by ForeTrade Technologies based on the work of Murtagh et al. (2004) and available at the website http://www.foretrade.com/Wavelet.htm. This software has been employed in a number of previous studies such as those of Jammazi (2012a,b) and Jammazi and Aloui (2010).
Given the inherent non-normality of the correlation coefficient for small sample sizes, the confidence intervals for the HTW-based correlation and cross-correlation have been constructed by using the Fisher's transformation. Through this transformation, the correlation coefficient tends to become normal quickly as the sample size increases.
Due to space restrictions and given that the HTW-based cross-correlation analysis shows a similar pattern for all industries, Fig. 4 only displays the cross-correlation coefficients corresponding to Utilities, Banking, and Food and Beverages industries. The full set of results from the wavelet cross-correlation analysis is available from the authors upon request.
For the sake of brevity, Figures which report the results from these robustness tests are not presented here, by they are available upon request from the authors.