


We revisit the recently revived concept of social economic progress. We take a microeconomic perspective and address economic progress where it originates, with value creation at individual businesses. We begin with a brief history of thought on the concept. We continue by analyzing how a business creates private value through productivity growth, which is a necessary but not sufficient condition for a business to create social value. We then adopt an analytical approach to value creation from the perspective of a business, by analyzing how the creation of private value has implications for the distribution of income and creates social costs and benefits. We argue that a business creates social value, thereby contributing to social economic progress, only if it creates private value, it distributes the value it creates in a balanced way, and it generates social benefits having greater value than the value of the social costs it generates.
The concept of economic progress was a popular but divisive subject in the depression and inter-war period of the 1930s and 1940s, with Ayres (1944), Clark (1940), Davis (1947), Fagan (1935), Hansen (1939) and Moulton (1937) all using the phrase in the titles of their studies. It resurfaced in the 1970s with the Nordhaus and Tobin (1972) “measure of economic welfare”, which adjusts aggregate output for environmental and other impacts, and the interest in the subject has been rekindled recently by the related studies of Stiglitz et al. (2009), who contrasted economic performance as a national accounting concept with social progress as a welfare-oriented concept, and of the OECD (2014), which characterized inclusive growth as incorporating the concepts of improving living standards and sharing the benefits of increased prosperity more evenly across social groups.1 Our objective is to couch the analysis of economic progress in a formal analytical framework amenable to subsequent empirical analysis and hypothesis testing.
At issue is how narrowly or broadly economic progress is to be defined. Some writers define economic progress narrowly as a productivity-driven increase in some measure of aggregate output, such as national income or gross domestic product (GDP). For these writers productivity growth is a sufficient condition for economic progress. Other writers define economic progress more broadly to include the impacts if productivity growth on the distribution of income, unemployment and re-employment, health, and the environment. For these writers productivity growth is a necessary condition for economic progress, but it is not sufficient because it ignores the social dimensions of economic progress.
A second issue concerns the level of aggregation at which economic progress is analyzed. Most writers adopt a macroeconomic perspective, presumably because the components of economic progress are macroeconomic issues. We take a diametrically opposed microeconomic perspective, on the ground that productivity growth, and its social impacts, originate in business models, management strategies and the production activities of individual businesses.
Related to the second issue is the question of whether the social issues arising from productivity growth are to be addressed by macroeconomic policies or by business behavior. Stiglitz et al. (2009) and the OECD (2014) focus on the design of public policies to promote social progress and inclusive growth. While we agree that social issues are appropriately addressed by macroeconomic policies, we take the view that they are created by business, and management can adopt strategies that enhance the beneficial social consequences, and mitigate the adverse social consequences, of productivity growth before they become macroeconomic policy issues.
In this paper we revisit, extend and operationalize the broad concept of economic progress, in which a range of stakeholders participate. This concept of economic progress is aligned with the concept of social progress proposed by Stiglitz et al. (2009), an alignment that motivates our integration of the two into a single concept that we call social economic progress. The term social economic progress captures the idea that measures of economic performance, such as sales revenue or profit at the level of an individual business and GDP or GDP per capita at the aggregate economy level, are not sufficiently inclusive to describe the social economic progress of an economy. An inclusive measure of social economic progress acknowledges the impacts of productivity growth on income distribution, unemployment and re-employment, and the environment.2
Our contributions are (i) to provide a definition of social economic progress, (ii) to move the analysis of social economic progress from the economy-wide level of aggregation studied by most scholars down to where it originates, with business models, management strategy and decision making at the level of the individual business, (iii) to highlight economic inequality as a potential consequence of the dimensions of social economic progress, and (iv) to develop an analytical framework within which the business origins of social economic progress and each of its dimensions can be studied.
The paper is organized as follows. In Section Social Economic Progress we revisit the economic progress debate, much of which occurred in the 1930s and 1940s during and subsequent to the Great Depression. At the core of the debate was the identification of necessary conditions, and sufficient conditions, for what was then called economic progress. In Section Private Value Creation we analyze the productivity-driven process of value creation in business. We analyze from Section four to six three dimensions of social economic progress. In Section Balanced Distribution of Privately Created Value we analyze the distribution of the value created among various stakeholders. In Section Private and Social Value Creation we analyze the social costs and benefits associated with productivity growth. In Section Re-employment of Displaced Resources we discuss re-employment of resources displaced by productivity growth in growing and contracting economies. In Section Compensation Mechanisms we acknowledge that socially responsible behavior may impose private costs on a business, and we consider alternative mechanisms by which a business might compensate for its decline in cost competitiveness. The last section concludes.
Social economic progressThe concept of social economic progress has received a wide range of interpretations. Under a narrow definition productivity growth is sufficient for social economic progress; everything else will take care of itself. Under a broader definition productivity growth is necessary but not sufficient for social economic progress, and additional considerations need to be addressed.
Hansen (1939) defined economic progress narrowly to include inventions, the discovery and development of new territory and new resources, and population growth. We interpret this as productivity growth (i.e., inventions) augmented by growth in productive resources, the combination generating output growth. Writing in the wake of the Great Depression, Hansen expressed concern that output growth might not be sufficient to generate full employment, but his concerns stopped at this narrow definition of economic progress. Somewhat later Ayres (1944) offered an even narrower definition of economic progress as productivity-driven output growth, asserting that the benefits of productivity growth eventually would be distributed broadly and displaced resources eventually would be re-employed (as indeed they were after World War II), and ignoring the social costs of productivity growth. Later still Friedman (1970) proposed a business interpretation of Ayres’ narrow definition of social economic progress by arguing that a business’ social responsibility is to increase its (private) profits.
Fagan (1935) defined economic progress broadly, to include increased production per unit of labor and natural resources (i.e., productivity growth), and an “ever wider” distribution of the resulting wealth. Clark (1940) proposed a similarly broad definition, augmenting productivity growth with a “just” distribution of its fruits and adding maintenance of the sanctity of livelihoods, mitigation of economic fluctuations and increased leisure. Clark also admitted the possibility of conflict among the components of economic progress.
More than a half century later Stiglitz et al. (2009) continued to focus on the behavior of the national economy and contrasted “narrow measures of market performance” with “broader measures of welfare.” The former are analogous to private value creation driven by business productivity growth. The latter also include the remaining components of economic progress identified by Fagan and Clark. Stiglitz, Sen and Fitoussi (p. 4) mentioned “additions and subtractions that can and should be made to provide a better measure of welfare,” among them unemployment, inequality, health, leisure, environmental degradation and natural resource depletion. OECD (2014) cited many of the same concerns, with an emphasis on inclusive growth, defined multi-dimensionally as growth that combines increased prosperity with reduced inequality, of opportunity as well as outcomes. Each of these macroeconomic considerations originates in business productivity growth.
Davis (1947; 56) redirected the study of economic progress to a less aggregated industry level, acknowledging that “…consideration will have to be given to plant and company experience.” Davis was concerned with the equity of the distribution of the fruits of business productivity growth among a range of stakeholder groups, stressed the significance of the re-employment of resources displaced by business productivity growth, and studied a range of other social and environmental impacts of business performance, while at the same time emphasizing the financial dimension of business performance. In light of his holistic approach to the evaluation of business performance, we consider Davis an unfortunately overlooked early contributor to the corporate social responsibility (CSR) literature that was popularized by Bowen (1953) and has blossomed since. Davis’ work has influenced the analytical framework we develop in this study, although our analytical approach is very different from the primarily institutional approach adopted in much of the CSR literature that has been surveyed by Crane et al. (2008) and Schreck (2009).
With his emphasis on the social dimensions of business performance, Davis rejected Ayres’ narrow definition of economic progress. He considered business productivity growth, which he called “greater productive efficiency,” that creates value to be the sole driver, but not the only component, of aggregate economic progress. Davis considered economic progress, driven by productivity growth, to incorporate (i) a “balanced” distribution of the wealth created by productivity growth; (ii) “relatively rapid” re-employment of resources displaced by productivity growth, labor in particular, sufficient to expand output; (iii) provision of seed capital for future value-creating production; and (iv) imposition of minimum social costs, such as insecurity of employment, industrial accidents and disease, automation and the wasteful use of natural resources. Each component is necessary for business productivity growth to translate into aggregate social economic progress.
Inspired by writers favoring a broad concept of social economic progress, largely from a macroeconomic perspective, and by Davis from an industry and business perspective, we offer the following business-oriented definition of socially responsible business behavior:
Definition 1 (Social economic progress): A business contributes to social economic progress only if it creates private value, the created private value is distributed in a balanced way, and the social costs of the production activities that create private value are mitigated.
This definition is deliberately vague, and open to alternative interpretations. We follow Davis by assuming that private value is created by business productivity growth (and destroyed by productivity decline), and we interpret the second and third requirements in subsequent sections. We acknowledge, however, a line of research that attributes business value creation to a strategy of replication, as in fast food and coffee chains for example, that does not require productivity growth. Winter and Szulanski (2001) provided an influential exposition of replication as a business strategy, and Grifell-Tatjé and Lovell (2015) contrast analytical models of business value creation driven by productivity growth, with and without replication.
Private value creationPrivate value creation through productivity growth is a necessary condition for a business to contribute to social economic progress. We introduce some notation and an analytical framework, adapted from Grifell-Tatjé and Lovell (2015), within which to study value creation.
We express a business’ output quantity and price vectors as y=(y1, …, yM)∈ R+M and p=(p1, …, pM)∈ R++M, and its input quantity and price vectors as x=(x1, …, xN)∈ R+N and w=(w1, …, wN)∈ R++N. The set of technologically feasible combinations of output vectors and input vectors is given by the production set T={(y,x): x can produce y}, which is assumed to be closed and bounded, and to satisfy no free lunch and monotonicity conditions. We consider two time periods indicated by superscripts t and t+1 on variables.
The Nth input is capital, and we write its quantity xN=K and its price wN=r, the gross rate of return to capital. We define operating profit π as the difference between sales revenue pTy=Σpmym and non-capital expense wN−1TxN−1=∑n=1N−1wnxn, and so π=Σpmym−∑n=1N−1wnxn><0.
Operating profit, also known as the gross return to capital and gross operating surplus, was called investor input by Davis (1955), which complements his earlier work. The idea behind the term is that the operating profit of a business is considered a return, positive or negative, to investors who provide capital to the business, and which management allocates to depreciation, amortization, interest, taxes, dividends and retained earnings.3 This allocation of operating profit influences the financial structure of the business (its debt/equity ratio), and prompts us to use the neutral term “investor” rather than stockholder or bondholder.
Since operating profit is defined as the gross return to capital, π=pTy−wN−1TxN−1=rK⇒r=(pTy−wN−1TxN−1)/K=π/K⋛0. The common accounting practice of expensing investor input generates π−rK=pTy−wN−1TxN−1−rK=pTy−wTx=0. Even though the change in (π−rK) between periods t and t+1 is zero by construction, it can be expressed and decomposed as
in which K0t+1 is the deflated value of period t+1 capital. The first term on the right side of (1) consists of price weighted quantity changes and so we call it a quantity effect, while the second term consists of quantity weighted price changes and so we call it a price effect. Since the change in (π − rK) is zero by construction, the price effect is the negative of the quantity effect.
The quantity effect has Laspeyres form, with quantity changes weighted by period t prices (one of which is rt, the period t gross rate of return to capital), and the price effect has Paasche form, with price changes weighted by period t+1 quantities (one of which is K0t+1, the deflated period t+1 capital stock). We can express the Laspeyres quantity effect as
in which YL =ptTyt+1/ptTyt is a Laspeyres output quantity index, XL =wtTxt+1/wtTxt is a Laspeyres input quantity index, and YL/XL is a Laspeyres productivity index. YL/XL ⋛1 signals productivity growth, stagnation or decline, and scaling [(YL/XL)−1] by wtTxt+1 generates a measure of the private value created or destroyed by productivity change that was first proposed by Méraud (1966), who called it “surplus de productivité”.
An alternative to (1) for the change in (π − rK) between periods t and t+1 is
in which the quantity effect has Paasche form and the price effect has Laspeyres form. The Paasche quantity effect can be expressed asin which YP =pt+1Tyt+1/pt+1Tyt is a Paasche output quantity index, XP =wt+1Txt+1/wt+1Txt is a Paasche input quantity index, and YP/XP is a Paasche productivity index. YP/XP ⋛1 signals productivity growth, stagnation or decline, and scaling [1−(YP/XP)−1] by wt+1Txt generates a second measure of the private value created or destroyed by productivity change. The two measures of private value creation are not generally equal.
It is possible to avoid the Laspeyres-Paasche spread by calculating the arithmetic mean of (1) and (3), which yields a Bennet (1920) expression for the change in (π − rK) between periods t and t+1 given by
in which arithmetic mean prices (p¯, w¯N−1, r¯) weight quantity changes and arithmetic mean quantities (y¯, x¯N−1, K¯) weight price changes. The Bennet quantity effect can be expressed asin which the quantity effect is the arithmetic mean of the Laspeyres and Paasche productivity effects, and provides a third measure of the private value created or destroyed by productivity change. Using (6), the first necessary condition in Definition 1 for a business to contribute to social economic progress by creating private value through productivity growth is expressed as ½{wtTxt+1[(YL/XL)−1]+wt+1Txt[1−(YP/XP)−1]}>0. Condition (6) can be evaluated using data mainly available in business financial reports.

The accounting practice of expensing investor input ensures that the quantity effect is a productivity effect, which eliminates the business strategy of replication as a potential source of business value creation.4 This practice also makes the negative of the price effect a dual productivity effect. Siegel (1952, 1961) introduced the concept of a dual price-based productivity index; the French economist Fourastié (1957, 1962) was a prolific user of a dual productivity index. The value of a dual productivity index to Fourastié and many subsequent writers was that it provided a price-based measure of productivity change in environments in which prices are easier to measure than quantities. The value of a dual productivity index to us is that it provides a framework for analyzing how the private value created by business productivity growth is distributed among its various stakeholders, a process we examine in the next section.
Balanced distribution of privately created valueThe second condition for social economic progress requires the distribution of the privately created value to be “just” (Clark, 1940) or “balanced” (Davis, 1947), two imprecise terms. Davis (1947) deliberately defined the term loosely, consistent with his clearly expressed desire that each recipient group receive a positive share of the value created. In Section Productivity and Distribution, we focus narrowly on a balanced distribution of the value created by productivity growth. In Section Distribution and Inequality, we focus on the linkage between a balanced distribution of created value and the broader concept of economic inequality.
Productivity and distributionDavis identified six recipient groups, or stakeholders: customers, wage and salary workers, suppliers, investors, the business itself and the government. We simplify his stakeholder structure to four recipient groups for expository clarity. Expression (6) shows how productivity change is transformed to private value by the business. Substituting the right side of (6) into (5) and recalling that the change in (π − rK) is zero by construction, we obtain an expression showing how privately created value is distributed as
in which x¯l(wlt+1 −wlt)+x¯N−1\lT(wN−1\lt+1 −wN−1\lt)=x¯N−1T(wN−1t+1 −wN−1t), with subscripts l and N−1\l indicating wage and salary workers and suppliers of other non-capital inputs. The productivity effect measures the value created by productivity growth to be distributed to the four groups of stakeholders appearing on the right side of (7). The first group of beneficiaries is consumers of M products, whose expenditure change is −y¯T(pt+1−pt). The second group is wage and salary workers, whose earnings change is x¯l(wlt+1 − wlt). The third group is suppliers of other inputs, whose earnings change is x¯N−1\lTwN−1\lt+1−wN−1\lt. The fourth group is investors who provide capital to the business, whose income change is K¯rt+1−rt. Expression (7) also can be evaluated using data mainly available in business accounts.
This process of distribution occurs through changes in output prices, wages and salaries, other input prices, and the gross rate of return to capital, a point eloquently made by Kendrick (1961; 111), the father of modern productivity analysis, who wrote “[i]f productivity advances, wage rates and capital return necessarily rise in relation to the general product price level, since this is the means whereby the fruits of productivity gains are distributed…”. Kendrick and Creamer (1961) and Eldor and Sudit (1981) developed similar analyses of the distribution of the fruits of productivity change, which they applied to five case studies and to data from the accounts of “a major corporation”, respectively. Their analytical frameworks were expanded, with an emphasis on the role of productivity, by Genescà Garrigosa and Grifell-Tatjé (1992). It is worth noting that changes in prices, including the gross rate of return to capital, can be driven by the forces of competition, distorted by market power, regulations and asymmetric information, and influenced by business strategy.
The second necessary condition in Definition 1 for a business to contribute to social economic progress is that it distributes the value it creates in a balanced manner. Our definition of a balanced distribution of privately created value is consistent with Davis’ desire:
Definition 2: The distribution of privately created value is balanced when each group of stakeholders receives a positive share of the economic value created by the business, so that −y¯T(pt+1−pt) >0, x¯l(wlt+1 −wlt)>0, x¯N−1\lTwN−1\lt+1−wN−1\lt >0 and K¯ (rt+1−rt)>0.
We do not interpret this definition as requiring that all output prices decline or that all input prices increase.5 It requires only that each stakeholder group benefits from productivity growth, consumers through generally lower product prices, labor through higher wages and salaries, other resource suppliers through generally higher prices, and investors through a higher gross rate of return to capital. However since the gross return to capital has to cover depreciation, amortization, interest, taxes, dividends and retained earnings, the definition does not guarantee that a higher gross rate of return to capital will generate an increase in retained earnings sufficient to provide seed capital for future expansion. Nonetheless Davis anticipated that a balanced distribution of created value, by raising the gross rate of return to capital, would spur an increase in investment by the business, which in turn would increase the demand for goods and services throughout the economy and lead to re-employment of resources displaced by productivity growth, which is the subject of Section Re-employment of Displaced Resources.
The requirements of Definition 2 may appear to be relatively undemanding, but they can easily conflict with a successful business model. For example, Brea-Solís et al. (2015) have documented that Walmart's “Everyday Low Prices” strategy produced generally lower real product prices during Sam Walton's tenure (1971–1988) as CEO, but it also produced generally lower real wages and salaries for its employees, thereby creating an unbalanced distribution of privately created value.
The four stakeholder groups in (7) each contribute to the production activity that creates or destroys value. However it is important to note that each stakeholder group can be disaggregated as desired to expand the analytical framework to analyze a range of policy issues. Two current policy-relevant examples come quickly to mind. First, earnings of wage and salary workers x¯l(wlt+1 − wlt) can be categorized by gender to incorporate the widely-discussed gender wage gap as an element of a balanced distribution of created value. Garcia-Prieto and Gómez-Costilla (2017) have used a large Spanish database extracted from the 2011 wave of the EU Statistics on Income and Living Conditions to quantify the gender wage gap. After controlling for various human capital and occupational characteristics they found an 11% female wage gap, which they attributed to discrimination and differential knowledge about the labor market. OECD (2017) provides a detailed examination of gender (in)equality throughout the OECD. Second, investor income K¯ (rt+1 − rt) can be allocated to its components, thereby allowing special interest to focus on corporate taxes. These tax liabilities are arguably the most important component of investor income, as they fund government provision of infrastructure and other services, much of which benefits business. They are also central to the ongoing international debate on the impact of lowering corporate tax rates on economic growth.6
We conclude by noting that even a balanced distribution does not guarantee a reduction in inequality because, for example, an increase in wage and salary income is not inconsistent with rising inequality in wage and salary income. Moreover, expression (7) and Definition 2 refer to inequality in the distribution of income within a business. Song et al. (2018a) have used a large US database to contrast within-firm earnings inequality with among-firms earnings inequality, and they attributed most of the growth in earnings inequality from 1978 to 2013 to increasing dispersion among firms. We explore this issue in next section and Section Private and Social Value Creation.
Distribution and inequalityThe distribution of the value created by business productivity growth, even if it is balanced, has an impact on economic inequality. Inequality played a role in early treatments of economic progress, and it was a prominent component of the concept of social progress of Stiglitz et al. (2009) and of that of inclusive growth of OECD (2014). Here we explore the linkage between a balanced distribution of created value and economic inequality.
Even a balanced distribution of privately created value does not guarantee that the business contributes to a reduction in economic inequality. The analytical explanation is that our definition of a balanced distribution, derived from (7) and, ultimately, from Davis (1947), refers to the functional distribution of income among those groups who perform a function that contributes to private value creation.7 In contrast, the size distribution of income refers to the distribution of income among individuals, households, age groups or other groups of individuals, regardless of the function they perform, and it is this distribution that forms the basis for most writing about income inequality or economic inequality, including that of the OECD (2014). The classic reference is Garvy (1954), who relates the two concepts. Nonetheless it is possible to assume that the business distributes created value in a balanced way and to use (7) as an initial framework for an analysis of economic inequality.
Consider consumers, who purchase necessities and luxuries. Even if the prices of luxuries decline by the same proportion as those of necessities, inequality increases as living standards of the generally high earning consumers of luxuries improve more than those of consumers of essentials.
Consider labor, which we have defined as wage and salary workers. Salary workers generally earn more than wage workers, and so even if the incomes of salary workers increase by the same proportion as those of wage workers, inequality increases. The same logic applies to the widely chronicled gender wage gap, which Oostendorp (2009) has related to various indicators of globalization.8 Indeed the OECD (2014; 71) attributes much of the increase in inequality since the 1980s, and particularly since the global financial crisis, to income from work, as earnings of the highest paid employees have increased relative to those of median income employees. It calls increasing dispersion in wages and salaries “…the single most important driver of rising income inequality,” and asserts further that “…the impact of globalization on inequality has been minor compared with that of changes in technology,” which have been skill-biased in favor of higher-skilled workers.
The skill bias of new technology has been widely documented, and its effects on inequality widely debated. Card and DiNardo (2002; 735) reviewed the evidence on the impact of the skill bias of new technology on rising wage inequality, and found that the skill bias “…falls short as a unicausal explanation for the evolution of the US wage structure…” Bartel et al. (2007) estimated the bias for a focused sample of US valve-making plans, and they found strong complementarities between the adoption of various information technologies and a variety of human resource management practices. This finding of complementarities has reappeared frequently in the literature; for example, Bayo-Moriones et al. (2017) explore complementarities among human resource management practices, information and communication technologies, and advanced manufacturing technologies in Spanish manufacturing plants. However Autor (2015) reviewed the evidence linking automation and employment, and found a polarizing effect, with wage gains having gone primarily to the top and bottom of the wage and skills distribution, although polarization is likely to diminish. He also noted that tasks are more likely to disappear than jobs. Similarly, PwC (2018) has characterized artificial intelligence (AI) as a disruptive technology whose impacts are predicted to vary widely across sectors of the economy, and will involve both job (or task) displacement and creation, the latter through demand shifts and within the value chain of AI itself.9
Consider investors who provide capital to the business and receive dividends. Investors generally have higher incomes than wage earners. Even if investors receive the same share of created value as wage earners, inequality in the size distribution of income is likely to rise. The OECD (2014) notes that investor income itself is unequally distributed, with those with the highest incomes receiving the largest shares.
Consider finally the retained earnings component of the gross return to capital. If management allocates much of the increase in the gross return to capital to retained earnings, this part of the value it has created is saved rather than spent, economic growth is dampened and re-employment opportunities are diminished. This possibility worries The Economist (26 March, 2016, 03 June, 2017), which observes that the fruits of economic growth are being hoarded, and that free cash flow (the gross return to capital left over after investment expenditures) of American businesses currently is running at 4% of GDP, while that of the big-five tech firms alone exceeds USD300 billion.
Private and social value creationThe productivity-driven process of private value creation can generate positive as well as negative social impacts that generally do not appear in a business’ accounts. These impacts do, however, appear as a component of social economic progress, in which they augment or detract from a business’ private value creation. Davis (1947; 11) included “lowest social costs” resulting from business productivity growth as the fourth component of economic progress. Among social costs to be mitigated Davis (1947; Ch. VIII) mentioned automation (which causes displacement), insecurity of jobs and income (which results from displacement, and which Jerome (1932, 1934) investigated in detail and Stiglitz et al. (2009) noted has negative consequences for businesses as well as workers), industrial impairment of worker health (which was chronicled on a monthly basis during the 1920s and 1930s in Monthly Labor Review, and which leads to displacement), and wasteful use of natural resources (to which Stiglitz et al. (2009) added environmental degradation, which they augmented with an “environment-inequality nexus”). Davis did not mention social benefits, but our analytical method allows for both social costs and social benefits accruing from business productivity growth. It is difficult to find a business annual report that fails to advertise the social benefits it generates.10
The notion that a business might incorporate its social costs and benefits in its decision-making process is directly related to the enormous literature on corporate social responsibility (CSR), which incorporates all stakeholders, not just owners, in business decision-making. This in turn has generated numerous studies of the effect of CSR on corporate financial performance (CFP). Orlitzky (2008) surveyed the extant literature and concluded that CSP and CFP are mutually reinforcing organizational activities. Subsequent research findings are more nuanced. Baron et al. (2011) found a positive relationship in consumer markets and a negative relationship in industrial markets in the US, Rodríguez-Fernández (2016) found a positive relationship for a sample of companies registered on the Madrid Stock Exchange, and Lee and Hu (2018) found that CFP enhances CSR in a large international sample of 39 companies in 15 countries.
Exploring the environmental and other social impacts of business activity remains a timely research topic.11 A particularly interesting thread that has elicited a flood of empirical research involves business environmental proactivity and its impact on business performance. González-Benito and González-Benito (2005) found environmental proactivity to have a positive effect on some measures of business performance, a negative effect on others, and no effect on financial performance as measured by return on assets. Allen and Craig (2016) argued that ever since the Paris Agreement on climate change, CSR has evolved from a business luxury to a business necessity. Ardito and Dangelico (2018) and Song et al. (2018b) have expanded the scope of the relationship by analyzing the linkages between CSR and business strategic and organizational orientations, green supply chain management, and green product development. Beltramello et al. (2013) and Diaz Lopez et al. (2018) used large numbers of case studies to analyze the impacts of business model eco-innovations and barriers to the implementation of green business models on green growth and environmental resource management.
Here we develop an analytical approach to the investigation of the social costs and benefits of business activity. It is analytically convenient to treat social costs and benefits as appendages to operating profit, and to define social operating profit as πS= pTy − wN−1TxN−1+sTe, where e=(e1, …, eQ) ∈ R+Q is a quantity vector of social effects and s=(s1, …, sQ) ∈ RQ is a price or unit cost vector associated with the social effects. We partition the social effects into desirable social benefits such as philanthropy, community development programs and sponsorships, and undesirable social costs such as worker displacement and emissions of greenhouse gases that contribute to global warming. The corresponding partitions of e and s are written e=(eb, ec) and s=(sb, sc). Social benefits sbTeb augment operating profit, and social costs scTec detract from operating profit. If, as is the case with many environmental effects, neither price nor unit cost exists for a particular social effect, the corresponding element of s is an implicit valuation, or a shadow price that must be estimated.12
Augmenting the quantity effect in (5) and (6) with social benefits and costs yields
in which EhL= shtTeht+1/shtTeht and EhP= sht+1Teht+1/sht+1Teht, h=b,c, are Laspeyres and Paasche quantity indices of social benefits and social costs. The left side of (8) combines the private and social value components of the business’ contribution to social economic progress. The right side of (8) apportions the left side to private value creation through productivity change (the first term) and social value creation through the social benefits and costs of the production activities that generate private value creation (the second and third terms). Davis’ desire for “lowest” social costs resulting from a business’ production activities would then be expressed in terms of the social value created by the business, since we incorporate social benefits as well as social costs. Our interpretation of Definition 1 requires both components of (8), private and social value creation, to be positive. The magnitude of the social value created by the business depends on three factors: the quantities of the social benefits and social costs given by eb and ec, the implicit valuations assigned to the benefits and costs given by sb and sc, and the growth or decline in the values of the aggregate social benefits and social costs given by the quantity indices EbL, EbP, EcL and EcP.
Incorporation of social value creation expands the distribution equation (7) to

We know from (6) and (7) that the private components of the left and right sides of (9) are equal. However equality of the social components [s¯bT (ebt+1 − ebt) − s¯cT (ect+1 − ect)] and [e¯bT (sbt+1 − sbt) − e¯cT (sct+1 − sct)] requires sbgTebg–scgTecg=λ, g=t, t+1, λ ≠ 0. This requires the net value of social effects to be time-invariant.13
Definition 2 requires a balanced distribution of private value created, but imposes no restriction on [e¯bT (sbt+1 − sbt) − e¯cT (sct+1 − sct)], the structure of social value created. However our interpretation of Definition 1 requires [s¯bT (ebt+1 − ebt) − s¯cT (ect+1 − ect)] >0, which is equivalent to −[e¯bT (sbt+1 − sbt) − e¯cT (sct+1 − sct)] >0 under the time-invariant condition. The interpretation of this equivalence is that, for a business to create social value, prices (or unit costs or shadow prices) of social effects should rise in absolute value on balance, which makes it more expensive for the business to generate social costs and more rewarding to generate social benefits. Neither inequality above requires quantities of all social effects to decline or their prices to increase.
Most of the requisite data in the augmented quantity effect (8) and the augmented balanced distribution expression (9) are available in business accounts. However the quantity vector of social effects e is unlikely to be found in (publically available) business accounts, although it may be available in accounts maintained privately by businesses or by the relevant regulatory bodies and statistical agencies. Finally the price (or unit cost or shadow price) vector s of the social effects is unlikely to be available in any accounts, and must be estimated using econometric or mathematical programming techniques. Dakpo et al. (2016) discuss alternative strategies for estimating shadow prices of social effects.
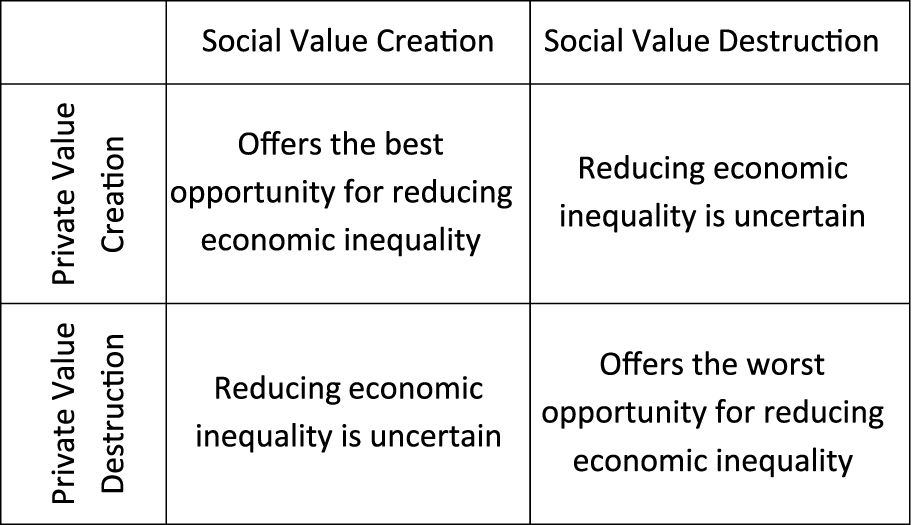
Fig. 1 summarizes the four different situations that can occur concerning the contribution of a business’ private and social value creation to a reduction in aggregate economic inequality. The most desirable outcome has private value creation generated by productivity growth, augmented by social value creation attributable to an increase in social benefits and/or a decline in social costs. This outcome offers the best opportunity for the business to contribute to a reduction in economic inequality. An important example is provided by green chemistry, which involves the use of less toxic chemicals and chemical processes to reduce waste and minimize adverse environmental impacts.14 A second example is provided by a business opening a child care facility at no cost to employees that increases their morale and productivity, and allows their partners to enter the workforce.15

The least desirable outcome has private value destruction, reinforced by social value destruction. This outcome offers the least opportunity for reducing economic inequality. An example is provided by a failing minerals company that destroys private value, leaving unpaid creditors and hundreds of employees out of work, and dumps toxic waste into the environment.16
In the two remaining situations private value creation (destruction) is offset by social value destruction (creation), with an uncertain contribution to economic inequality. An example of the former is provided by the practice of offshoring, which increases productivity and private value creation, but also displaces domestic labor, creating unemployment that contributes to economic inequality. This analysis abstracts from the ability of the business to satisfy the remaining requirement for it to contribute to social economic progress, namely that it have a balanced distribution of the private value it creates. An example of the latter is provided by India's Tata Group, which includes many loss-making businesses that destroy private value, and which has a long history of corporate social responsibility, which creates social value. The Economist (24 September, 2016) tells the story.
We have interpreted Definition 1 as requiring that a business contributes to social economic progress only if (i) it creates positive private value; (ii) its distribution of privately created value is balanced; and (iii) it creates positive social value. This interpretation has generated the analyses in (7)–(9). However Definition 1 is demanding and can be relaxed in a variety of ways. For example, (i) and (iii) can be relaxed to (iv) the sum of private and social value it creates is positive, which permits, for example, a business to adopt labor-saving technologies such as robotics and artificial intelligence that increase private productivity and displace workers. Many would applaud this practice as an example of social economic progress, assuming that the private value created exceeds the social cost of displacement. In addition, Definition 2 allows a business to return value to all stakeholders in a balanced but highly skewed manner that increases inequality within the business, as we discuss in Section Distribution and Inequality.
Re-employment of displaced resourcesSuppose a business displaces resources, reducing its contribution to social value. Here we propose an analytical framework within which to examine the process by which the business treats these resources.
Davis viewed displaced resources as an important component of the social cost of business that he wanted mitigated, and he also wanted resources displaced by productivity growth to find re-employment as rapidly as possible. This condition was a matter of utmost concern during and subsequent to the Great Depression. Beginning in 1927 and continuing through the 1930s the US Department of Labor's Monthly Labor Review published literally scores of studies under titles such as “Displacement of Labor by Machinery…,” “Mechanization…as a Factor in Labor Displacement,” “Effects of Technological Changes Upon Employment…,” and “Productivity and Labor Displacement…”. Then Secretary of Labor J.J. Davis (1927; 496, 498) asked “[w]hat are we doing with the men displaced?” He proposed ways of employing workers displaced by labor-saving technologies, “…otherwise our new machinery does not ‘save’ labor, but wastes it.” Baker (1930, 1932) investigated the impacts of technological change and trade unions on labor displacement in commercial printing in the US. Displacement also was the subject of an exhaustive empirical study of mechanization and displacement in American industry by Jerome (1932, 1934). Even John Maynard Keynes (1930; 364) worried about re-employment of workers then in a situation of technological unemployment arising from “…our discovery of means of economizing the use of labor outrunning the pace at which we can find new uses for labor.”17
We consider the experience of the 1930s to have been the first stage of displacement of labor, in this instance by machines. In the second stage, labor has been and continues to be displaced by less expensive labor, in the form of outsourcing and offshoring; see, for example, Bournakis et al. (2018). In the current and future third stage labor displacement is caused by new technology, including robotics and artificial intelligence; Acemoglu and Restrepo (2018) document the “robust negative” displacement effect of the industrial use of robots, although The Economist (25 June, 2016 and 26 August, 2017) foresees a less gloomy impact of artificial intelligence on labor displacement.
Displacement is not simply a downturn phenomenon, and it is not an exclusively American phenomenon. It occurs as a consequence of the introduction and diffusion of new technology during periods of prosperity as well, as Frey and Osborne (2017) have documented with American data, and displacement is at least as serious a problem in Europe, as OECD (2013) has documented. Moreover, much technological change is skill-biased, with virtually all recent research showing strong capital-skill complementarity. This increases the demand for skilled labor and depresses the demand for less-skilled labor, contributing further to economic inequality. OECD (2014) has examined “skills mismatch” in Europe, and Krussell et al. (2000) provided evidence of capital-skill complementarity and its impact on inequality in America. OECD (2013) has documented post-2000 displacement by category of worker (gender, age group and education), examining likelihood of displacement, length of displacement, and earnings losses after re-employment. Each of these technology-driven outcomes is exacerbated by pervasive product- and labor-market regulations cataloged in OECD (2018), because such regulations restrict the reallocation of resources, particularly labor, to more productive uses. All contribute to historically high unemployment rates and increasing inequality documented by OECD (2014), particularly since the global financial crisis. However Arntz et al. (2016) emphasized tasks rather than occupations and found that just nine percent of OECD jobs to be at risk from being automated out of existence, a finding consistent with that of Autor (2015). And historical evidence, from Lemann (1992) through OECD (2013, 2014), shows that the vast majority of displaced workers find re-employment, although generally with a lag and at reduced incomes. The lag in particular supports implementation of public policies aimed at providing public employment services and training for displaced workers; some recommended policies appear in OECD (2013).18
Indeed the focus of many studies, ranging from the early studies of Myers (1929), Clague and Couper (1931) and others, to the recent detailed analyses of Frey and Osborne (2017) and OECD (2013), has gradually shifted from displacement to re-employment, although the emphasis has remained on the labor input. We analyze the change in employment, xlt+1 − xlt, between periods t and t+1, during which time the business has created or destroyed value through productivity growth or decline. To do this we distinguish actual input use x from cost-efficient input use x(y,w) ⋛ x that minimizes the cost of producing output vector y at input prices w. This generates a distinction between actual cost wTx and efficient cost wTx(y,w)=c(y,w) ≤wTx, the difference between the two being attributable to misallocation and waste. In the case of the labor component of the input vector x, actual employment xl can differ from cost-efficient employment xly,w for any number of reasons, including labor market regulations that make it prohibitively expensive to adjust the workforce to the adoption of new labor-saving technology.
The change in employment in the business can be attributed to four sources:

The first term in (10) is an efficient re-employment effect, showing the change in employment attributable solely to output change in period t+1, holding technology and input prices constant at their period t+1 values. We expect xlt+1yt+1,wt+1 − xlt+1yt,wt+1 ⋛ 0 as yt+1 ⋛ yt, an expectation that is guaranteed except in the unlikely event that labor is an inferior input. If productivity growth encourages business investment that stimulates demand, we expect yt+1 >yt. The magnitude of the output growth depends on the market power of the business, which influences the magnitude of the demand-inducing price reduction, and on the price elasticity of demand of consumers, which determines the magnitude of the output response to any given price change. Finally, the magnitude of the efficient re-employment effect also depends on the elasticity of demand for labor with respect to a change in business output. OECD (2013) has documented variation in re-employment across categories of workers.
The second term in (10) is an efficient displacement effect, showing the change in efficient employment due to an improvement in technology that drives productivity growth between periods t and t+1, holding output quantities and input prices constant at their period t values. Consistent with the studies cited above, we expect xlt+1yt,wt − xltyt,wt <0, on the assumption that productivity growth takes a labor-saving orientation. Of course it is not necessary that productivity growth be labor-saving; it could be labor-using and output-enhancing, a distinction stressed by Jerome (1932, 1934). And labor is not homogeneous; much new technology uses skilled labor and saves less skilled labor. OECD (2013) has also documented variation in displacement across categories of workers.
The third term in (10) is an input price change effect, showing the impact on efficient employment of a change in input prices between periods t and t+1, holding technology constant at its period t+1 level and output quantities constant at their period t values. We expect xlt+1yt,wt+1 − xlt+1yt,wt ⋛ 0 as wt+1 ⋚ wt, although our main interest is on the impact of a change in labor's wage wl, and we expect xlt+1yt,wt+1 − xlt+1yt,wt ⋛ 0 as wlt+1 ⋚ wlt. Considerable evidence has accumulated, during the Great Depression by Baker (1930, 1932) among others, and since 2000 by OECD (2013) among others, that those displaced workers who are re-employed, do so at a reduced wage, the magnitude of which is determined by the size of the change in labor's wage and the ease with which other inputs can be substituted for labor. OECD (2013) has documented higher displacement rates in all countries except the UK following the global financial crisis than in previous years. Also, this source of labor displacement has been attributed to offshoring motivated by the exploitation of overseas contract labor having lower wages.
In fact neither re-employment nor displacement nor response to input price changes is necessarily carried out efficiently, which leads to the final term in the decomposition of employment change. The final term in (10) is an employment misallocation change effect, capturing any change in the efficiency of labor use between periods t and t+1. We expect [(xlt+1 − xlt+1yt+1,wt+1) − (xlt − xltyt,wt)] >0 for a socially responsible business, which is likely to displace fewer than the efficient number of workers, to re-employ more than the efficient number of workers, and to react to input price changes in an inefficient manner favorable to workers. One example of employment misallocation occurs with the practice of labor hoarding discussed by The Economist (07 October, 2010) with reference to Germany during the global financial crisis. Any such inefficiency is costly, however, and we consider how the socially responsible business can compensate for its inefficiency in Section Compensation Mechanisms.
In contrast to the private value creation expression (6) and the balanced distribution expression (7), both of which can be evaluated using data mainly available in business accounts, the actual employment change expression (10) contains cost-efficient employment levels, which are not available in business accounts. Cost-efficient employment levels must be estimated using econometric or mathematical programming techniques such as stochastic frontier analysis (Kumbhakar and Lovell, 2000) or data envelopment analysis (Färe et al., 1994).
Summarizing, employment changes over time for a number of reasons. One is displacement brought on by labor-saving technical change that drives productivity growth. However productivity growth is also cost-reducing, which encourages output growth, which in turn induces re-employment. Davis (1947) included rapid re-employment as a component of the contribution of a business to economic progress. OECD (2013) has provided empirical evidence on labor displacement and the rapidity of re-employment in fourteen countries during 2000–2010. To the extent that input prices, particularly labor's wage, change over time, employment can be adversely or favorably affected. Finally, the business may become more or less efficient in its employment practices with the passage of time.
Compensation mechanismsA socially responsible business incurs costs not incurred by a cost-minimizing business, and for it to remain cost-competitive it must compensate somehow. The extra cost incurred by a socially responsible business arises from its efforts to create social economic value. Although the ability to compensate for the extra cost of social responsibility is not a condition for social economic progress, it may be a survival condition for a socially responsible business, as Davis (1947; 127) noted in writing that “…less efficient plants would have a lower wage scale than more efficient.”
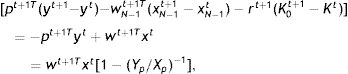
We consider two businesses, a socially responsible business and a cost-minimizing business that serves as a benchmark. We concentrate on period t+1, after the former has contributed to social economic progress. We consider output quantity levels Yt+1 and YCEt+1 for the socially responsible and cost-efficient businesses (Eichhorn and Voeller, 1976), and we consider a vector of input-output ratios zt+1={x1t+1/Yt+1,…,xN−1\lt+1/Yt+1, xlt+1/Yt+1, K0t+1/Yt+1} for the socially responsible business that creates social economic value. The corresponding vector for the cost-minimizing benchmark has subscript CE attached to all input-output ratios. Both vectors zt+1 and zCEt+1 are of dimension N. The creation of input-output vectors allows us to analyze compensation mechanisms using unit costs uct+1= wt+1Tzt+1 and ucCEt+1= wt+1TzCEt+1.
The socially responsible business is at a competitive disadvantage relative to the cost-minimizing benchmark given by the unit cost differential uct+1 − ucCEt+1 >0. However it is possible for the socially responsible business to become cost competitive by adopting an input price vector wˆt+1≠wt+1 such that ucˆt+1= wˆt+1Tzt+1= wt+1TzCEt+1=ucCEt+1. This enables us to write, following Grifell-Tatjé and Lovell (2015, Ch 7),

Expression (11) identifies the alternative compensation mechanisms available to the socially responsible business for achieving cost competitiveness with a cost-efficient benchmark. In the second equality the first term states that if either inefficiency and/or waste associated with excessive re-employment of labor, or the use of additional labor inputs to reduce undesirable social effects and/or promote desirable social effects exists, i.e., if zlt+1> zCElt+1, then compensation requires wˆlt+1< wlt+1 in the same proportion. This is exactly what has happened historically; as chronicled in the displacement/re-employment literature discussed above, excessive re-employment required a correspondingly reduced wage. The second term identifies the same mechanism for compensating for inefficiency and/or waste in the non-labor input. The third term identifies the same mechanism for compensating for excessive investment in capital, pollution abatement capital for example, which requires a correspondingly reduced gross rate of return to capital.
In all cases the compensating price adjustments are bounded. The balanced distribution of created value conditions in Definition 2 impose lower bounds wˆlt+1≥ wlt, wˆht+1 ≥wht, h=1,…,N − 1 \ l, and rˆt+1 ≥rt, so that after compensation adjustments labor, input suppliers, and investors must be at least as well off as they were prior to private value creation. Combining the compensation conditions with the balanced distribution conditions generates the double inequalities
that characterize the various price ranges that satisfy the balanced distribution conditions and the compensation conditions.
The balanced distribution conditions also require that consumers receive a positive share of the value created. We have not introduced a compensation mechanism involving adjustments to product prices because we have taken a cost competiveness approach based on a comparison of unit costs in a socially responsible business and a cost-efficient benchmark. However it is possible to augment our unit cost approach with a compensation mechanism involving consumers based on a comparison of unit revenues in a socially responsible business and a revenue-efficient benchmark. Omitting details, the analysis generates the output price compensation equation
in which φt+1=[y1t+1/Yt+1,…,ymt+1/Yt+1,…,yMt+1/Yt+1]T and φREt+1=[yRE1t+1/YREt+1,…,yREmt+1/YREt+1,…,yREMt+1/YREt+1]T are period t+1 vectors of ratios of individual outputs to aggregate output levels for the socially responsible business and a revenue-efficient business, respectively. As with cost competitiveness above, the socially responsible business becomes revenue competitive by adopting a price vector pˆt+1 ≠ pt+1 that compensates for its socially responsible output choices such that urˆt+1=pˆt+1Tφt+1=pt+1TφREt+1=urREt+1. From the definition of revenue efficiency, pt+1TφREt+1 >pt+1Tφt+1, which implies, from the previous equality, that pˆt+1Tφt+1 >pt+1Tφt+1. Thus the socially responsible business must increase revenue, which requires raising some output prices, although it does not rule out reducing some output prices if others are raised sufficiently to increase revenue. Also as with cost competitiveness above, the balanced distribution conditions impose bounds on any output price increases, with pˆmt+1 ≤pmt, m=1, …, M, which generates the double inequalities pmt+1 ⋚ pˆmt+1 ≤pmt, m=1, …, M.
Most of the variables in the compensation mechanism expressions (11)–(13) are available from business accounts, although the input-output vector and unit cost and unit revenue of the cost-efficient and revenue-efficient benchmarks must be estimated using frontier techniques.
Summarizing, social responsibility imposes a financial burden, perhaps endangering the viability of a business that contributes to social economic progress unless it compensates somehow. One compensation mechanism available is the price reductions enacted to offset excess usage of some inputs attributable to re-employment and mitigation or enhancement of social effects in (11). A second compensation mechanism is the output price increases in (13). If market competition impedes implementation of the first two compensation mechanisms, a third option, which is not a compensation mechanism, is a reduction of waste, which can appear in all four terms on the right side of (11), and presumably in (13) as well. But waste reduction is a double-edged sword. It raises productivity, and private value creation. However it also displaces resources, leading to unemployment and contributing to inequality. The practice of off-shoring provides a current example.
The socially responsible business is thus in a difficult situation. Its socially responsible undertakings impose a financial burden, which may (not must) require offsetting compensation, as described in (11)–(13). Enactment of these compensation mechanisms requires limiting the magnitudes of input price reductions and/or the magnitudes of output price increases, which may (not must) contribute to equality. Somewhat ironically, the more competitive the markets in which it operates are, the less able the socially responsible business is to use compensation mechanisms, which may (not must) limit the socially responsible activities the business undertakes. However a number of studies, including Rodríguez-Fernández (2016), have found that various indicators of corporate social responsibility are positively correlated with measures of financial performance. Consistency of these findings with our modeling requires a business strategy that is effective in shifting demand and/or making it less elastic, enabling the business to offset its cost disadvantage with superior performance on the demand side. Such behavior is consistent with the claim that the prices of at least some eco-friendly products are higher than can be justified by their higher costs.
ConclusionsThe contributions of Fagan, Clark, Davis and others to the concept of economic progress have been largely ignored for almost 70 years with the exception of Nordhaus and Tobin, having recently been revived by Stiglitz, Sen and Fitoussi and the OECD. Although the concepts are imprecise, our analysis has demonstrated that they are susceptible to analytical development.
Following Davis, and extending economic progress to social economic progress, business value creation through productivity growth is a necessary condition for social economic progress; without productivity growth no value is created. We have derived a measure of value creation based on indices of productivity growth. By consensus, created value cannot completely be retained within the business as gross operating surplus, or distributed exclusively to a single outside stakeholder group such as labor. Again by consensus, a just or balanced distribution of created value must be shared by all relevant stakeholder groups, although the sharing rule is weak, requiring a positive share for all groups.19 We have obtained a balanced distribution of created value based on this sharing rule. A host of writers have emphasized the need for re-employment of resources displaced by the (presumed resource-saving) improvements in technology that generated productivity growth. We have decomposed employment change and attributed it to a number of sources, one of which is technical progress that drives productivity growth. Very few writers have mentioned social effects arising from business activities generating productivity growth, much less analyzed their creation and valuation. We have introduced social costs and social benefits to construct a measure of social value creation, and we then derived an analytical expression for balanced distribution of social value created, including “society” as an additional stakeholder group with an interest in social effects such as environmental quality.
Summarizing, business productivity growth creates (private) value, which is necessary for social economic progress, which also requires a balanced distribution of the value created, re-employment of resources displaced by productivity growth, and creation of a positive social effect. The concept of (in)equality is embedded in each of these components of social economic progress, so contributing to social economic progress tends to reduce inequality.
Looking ahead, we have introduced an analytical framework with which to analyze social economic progress. Most of this framework can be implemented based on data available in business accounts, using conventional operations research techniques augmented with frontier techniques where necessary. The next step in the research agenda is to conduct empirical research into the contribution of businesses to social economic progress, implementing a line of research originally recommended by Cook (1973).
FundingThis research has been supported by the Spanish “Ministerio de Economía, Industria y Competitividad” (Ref.: ECO2017-86054-C3-1-R) and the “Generalitat de Catalunya” (Autonomous Government of Catalonia) (Ref.: 2017SGR 1036).
We are grateful for very helpful comments on a previous draft of this paper from the outgoing editor, Xosé H. Vázquez. We are also grateful to the audience of 2018 Taiwan Productivity and Efficiency Conference & Advance Lecture Series for their comments. Any remaining mistakes are ours.
See also the OECD website on inclusive growth http://www.oecd.org/inclusive-growth/.
The issue remains topical; see The Economist 30 April, 2016 and 11 August, 2018, the latter focusing on the governance, environmental and social goals of French food company Danone.
Davis treated depreciation and amortization as the cost of capital, and defined operating profit as earnings before interest and taxes (EBIT). We simplify the analysis by defining operating profit as earnings before interest, taxes, depreciation and amortization (EBITDA).
Our approach from (1) to (6) is structurally similar to Lieberman et al. (2017) and Garcia-Castro et al. (2018), but in absolute instead of relative terms. Garcia-Castro et al. (2018) provide an analytical framework to deal with replication, when profit is expensed.
Davis noted an exception to Definition 2: distribution can be balanced even if the price of a product increases, provided the price increase reflects an improvement in the quality of the product. The same exception applies to the three input groups; for example, distribution can be balanced if an occupational wage declines, provided working conditions are adequately improved.
A recent analysis of the debate about the impact of reducing corporate income tax rates on economic growth can be found at https://insight.kellogg.northwestern.edu/article/does-lowering-the-corporate-tax-rate-spur-economic-growth (accessed August 22, 2018).
The functional groups are those that supply the inputs used in the production process and account for the expenses in business accounts, such as labor, capital, energy and materials, and the function they perform is the production of goods and services. These functional groups coincide with Clarkson's (1995) groups of primary stakeholders in the business.
A wide range of data quantifying gender wage gaps is available at https://data.oecd.org/earnwage/wage-levels.htm (accessed August 22, 2018).
PwC define AI broadly to include automated, assisted, augmented and autonomous intelligence, depending on how new technology interacts with the workforce.
To cite just one example, global mining giant BHP Billiton's 2017 annual report includes USD80 million in “social investment” as the social component of its USD26 billion total value creation. https://www.bhp.com/-/media/documents/investors/annual-reports/2017/bhpannualreport2017.pdf (accessed August 22, 2018).
See, for example, the Business Environmental Performance Initiative (http://www.bepi-intl.org/), the Business Social Compliance Initiative (http://www.bsci-intl.org/) and similar initiatives (accessed August 22, 2018).
There is a large literature concerned with the estimation of shadow prices of environmental effects, and these estimates can be used to guide environmentally-conscious business strategy and inform public policy on appropriate levies or other regulatory strategies. Dang and Mourougane (2014) have surveyed the literature and developed an analytical model that they use to estimate shadow prices of several pollutants in OECD countries for 1990–2008. OECD (2015) discusses the policy-relevance of shadow price estimates, with an application to Dutch agriculture.
If this restrictive condition is not satisfied, we have [s¯bT(ebt+1−ebt)−s¯cT(ect+1−ect)]=[e¯bT(sbt+1−sbt)−e¯cT(sct+1−sct)]+[(sbtTebt−sctTect)–(sbt+1Tebt+1−sct+1Tect+1)].
See ACS Green Chemistry Institute (https://www.acs.org/content/acs/en/greenchemistry.html) for definitions and examples, which include the 2005 Nobel Prize in Chemistry.
Bloom et al. (2011) surveyed the literature on family-friendly workplaces. Their own calculations showed that, when variation in the quality of management practices is accounted for, family-friendly businesses do not have significantly higher sales per employee or return on capital employed.
This example is inspired by the recent experience of a minerals firm in Queensland, Australia.
Somewhat later, in the 1940s, the introduction of the mechanical cotton picker displaced five million African-American workers from rural southern plantations, many of whom migrated to new jobs in other industries in northern cities. This economic history is the subject of Lemann (1992).
Cavaco et al. (2013) report the results of a French retraining program.
Davis (1947; Chapter 7) discussed alternative sharing rules that would allocate created value “largely” to consumers or to labor or to investors who provide capital to the business.