Hypocalcemia is the most frequent complication after thyroidectomy. The aim of this work is to identify biochemical risk factors of hypocalcemia using quick perioperative (pre and post-thyroidectomy) intact parathyroid hormone (PTHi) and postoperative calcemias.
MethodsIn a consecutive series of 310 total thyroidectomies, samples of quick PTHi at the anaesthetic induction and 10 min after surgery, together with serum calcemias every 12 h were obtained. The sensitivity, specificity, positive and negative predictive value are analyzed and related to hypocalcemia. A control group of hemithyroidectomies is also analyzed to compare the effects of surgery on PTH secretion.
ResultsOf the 310 patients, 202 (65.1%) remained normocalcemic and asymptomatic (group A), 108 (34.9%) presented hypocalcemia (Group B), requiring oral calcium (79 symptomatic). After analysis of several cut-off points, combining a PTHr drop gradient of 60% or calcemia inferior to 7.4 mg/dl at 24 h, a sensitivity of 100% is achieved without leaving false negatives. Compared to the control group, there is a significant difference with respect to the post-operative calcemias and PTHr, p < 0.001.
ConclusionsTotal thyroidectomy affects parathyroid function with evident decrease in rPTH and risk of hypocalcemia. The combination of PTHr decrease of 60% or less than 7.4 mg/dl calcemia at 24 h gives a 100% sensitivity for predicting patients at risk of hypocalcemia.
La hipocalcemia es la complicación que condiciona el postoperatorio de la tiroidectomía. El objetivo de este trabajo es identificar criterios bioquímicos de riesgo de hipocalcemia analizando niveles de paratohormona rápida (PTHir) pre y postiroidectomía y de calcemias postoperatorias.
MétodosSe recoge una serie consecutiva de 310 tiroidectomías totales, obteniendo muestras de PTHr basal y tras 10 minutos postiroidectomía, junto a calcemias séricas cada 12 horas. Se estudian dos grupos, A normocalcémicos, B hipocalcémicos. Se calcula la sensibilidad, especificidad, valor predictivo positivo y negativo en relación con la hipocalcemia utilizando las curvas ROC y sus áreas bajo la curva. Se analiza un grupo control de 48 hemitiroidectomías para comparar los efectos de la cirugía sobre la secreción de PTH.
ResultadosDe los 310 pacientes, 202 (65,1%) se mantuvieron normocalcémicos y asintomáticos (grupo A), 108 (34,9%) presentaron hipocalcemia Grupo B, precisando calcio oral (79 sintomáticos). Tras el análisis de varios puntos de corte, combinando un gradiente de descenso de PTHr del 60% o una calcemia menor de 7,4 mg/dL a las 24 horas se consigue una sensibilidad del 100% sin dejar falsos negativos. Comparando con el grupo de control existe una diferencia significativa respecto de las calcemias y la PTHr postoperatorias.
ConclusionesLa tiroidectomía total afecta la función paratiroidea con descenso evidente de PTHr y riesgo de hipocalcemia. La combinación de un descenso del 60% o la calcemia inferior a 7,4 mg/dL a las 24 horas obtiene una sensibilidad del 100% para la predicción de pacientes en riesgo de hipocalcemia.
Post-thyroidectomy hypocalcemia, mainly due to a parathyroid lesion during surgery,1 determines postoperative progress and hospital stay. Finding a safe and reliable predictor is essential to prevent and control this complication. Parathyroid hormone (PTH) has been used for this purpose, but due to the heterogeneity of the studies there is still no cut-off value for PTH with 100% sensitivity to detect this complication. Rapid parathyroid hormone (PTHr) measurements were first used by Irvin in 19912 in parathyroid surgery and in thyroid surgery in the 2000s.3
The objective of this study is to evaluate the correlation between rapid PTH determination and post-thyroidectomy calcium levels with postoperative hypocalcemia, and to confirm whether the biochemical determinations available in our setting can predict which patients may be at risk, establishing an algorithm for early selective treatment.
MethodsGeneral design: a follow-up study with prospective data collection to evaluate the diagnostic utility of rapid PTH and post-thyroidectomy calcium (predictor variables), with the purpose of predicting postoperative hypocalcemia, which was considered the outcome variable. All consecutive total thyroidectomies were included from 2010 to 2015. Exclusion criteria: renal failure, parathyroid disease, and active treatment with calcium. A total of 310 cases were finally included in the study. In addition, they were compared with a control group of 48 hemithyroidectomies, using the same parameters.
The surgery was performed by two surgeons in a similar and standardized manner. Central lymphadenectomy (uni- or bilateral) was performed, depending on the tumor stage or evidence of lymph node extension.
Biochemical determinationsFor the study, the following were analyzed:
- •
Preoperative (baseline) total serum calcium
- •
Rapid baseline PTH (PTHrpre) during the induction of anesthesia
- •
Rapid post-thyroidectomy PTH (PTHrpost) 10 min after thyroid removal
- •
Postoperative total serum calcium: the first 5−8 h post-thyroidectomy (Ca1); subsequently every 12 h (7:00 am and 7:00 pm)
- •
The analyzed PTH is intact, and its rapid determination was carried out using an automated specific chemiluminescent immunoassay (PTH STAT) on an Ellipsis (Roche diagnostics dm, Manheim). Results were obtained in less than an hour.
The calcium levels analyzed were exclusively total serum due to the impossibility of urgently obtaining corrected calcium or albumin for its calculation. For the analysis, automated spectrophotometry (θ-cresolphthalein method) was used in a Dimension analyzer (Siemens Healthcare Diagnostics, DE, USA).
Definition and treatment of hypocalcemiaSymptomatic hypocalcemia was defined as the appearance of paresthesia and/or tetany. Biochemical hypocalcemia was defined by serum calcium values lower than 8 mg/dL, and sustained hypocalcemia was defined as no increase or decrease consecutively during the first 48 h. The hypocalcemia cutoff was 8 mg/dL because it is more clinically relevant4 and is the model adopted by most publications.5–7 Symptomatic patients and/or patients with sustained biochemical hypocalcemia were treated with oral calcium (calcium lactogluconate, 1500 mg/day) together with calcitriol 1 µg/day. Only the cases with severe hypocalcemia and the appearance of tetany were treated with intravenous calcium. The patients remained hospitalized until they were asymptomatic and biochemically stable (rising calcium).
Patient groupsThree groups of patients were analyzed: Group A (n = 202; 65.1%), normocalcemic, remained asymptomatic and with consecutive ascending calcium levels, did not require treatment; Group B (n = 108; 34.9%), with sustained hypocalcemia requiring calcium and calcitriol; Control Group, 48 consecutive hemithyroidectomies in the same period.
Statistical analysisWe calculated the sensitivity (S), specificity (Sp), positive (PPV) and negative (NPV) predictive values of different cut-off points for available biochemical values: absolute value and gradient of PTHr decline and calcium every 12 h. The ROC (receiver operating characteristic) curves were used to compare the area under the curve of these values as predictors of symptomatic hypocalcemia, using the DeLong test.
Categorical variables were analyzed with the chi-squared test, and the quantitative variables with the Student’s t or Mann–Whitney U according to the normality of the variable. The Anova or Kruskal Wallis tests were used if more than two groups were compared. Variables with a normal distribution were expressed as mean ± standard deviation, otherwise, as median and interquartile range (IQR).
The formula to calculate the decline has been published in other studies8,9 and in the Vía Clínica de Tiroidectomía of the Spanish Association of Surgeons: (PTHrpre-PTHrpost)/PTHrpre × 100.
The statistical analysis was carried out with the IBM SPSS 25 statistical package (IBM Corp, Released 2017; IBM SPSS Statistics for Windows, Version 25.0; Armonk, NY: IBM Corp.) and MedCalc Statistical Software version 19.1 (MedCalc Software bv, Ostend, Belgium; https://www.medcalc.org; 2019).
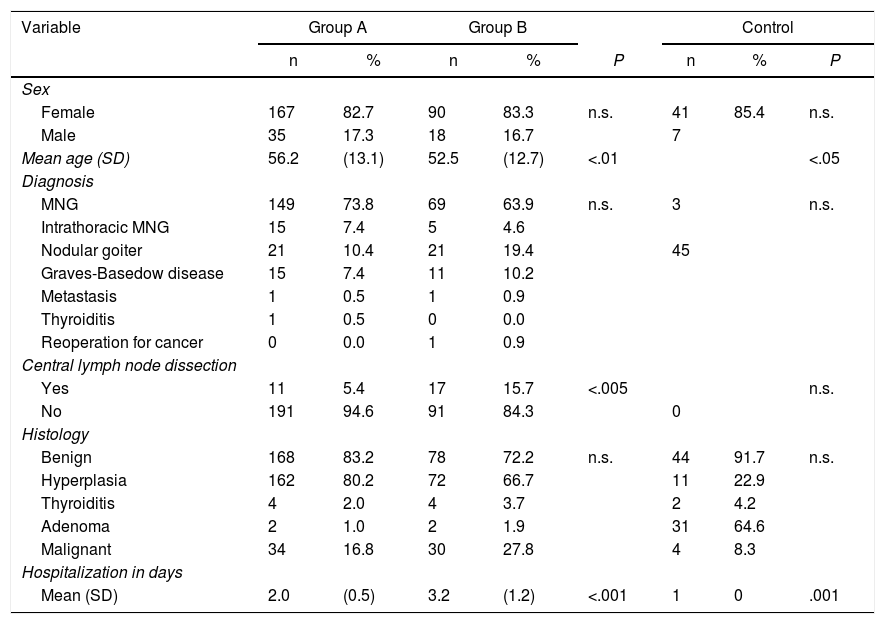
ResultsTable 1 shows the 310 cases that were included in the study, 273 of which were women, (83.2%), with a mean age of 54.5 ± 13.1 years. Multinodular goiter was the most common diagnosis (n = 239; 77.1%), followed by Graves disease in 26 cases. Due to evidence of lymph node extension, central lymph node dissection was performed in 28 patients (11 in group A and 17 in group B). Hyperplasia was the most common histological result (n = 234; 75.5%), and in 64 cases (20.6%) it was malignant pathology.
Demographic and clinical characteristics of patients from Groups A and B, as well as the control group.
| Variable | Group A | Group B | Control | |||||
|---|---|---|---|---|---|---|---|---|
| n | % | n | % | P | n | % | P | |
| Sex | ||||||||
| Female | 167 | 82.7 | 90 | 83.3 | n.s. | 41 | 85.4 | n.s. |
| Male | 35 | 17.3 | 18 | 16.7 | 7 | |||
| Mean age (SD) | 56.2 | (13.1) | 52.5 | (12.7) | <.01 | <.05 | ||
| Diagnosis | ||||||||
| MNG | 149 | 73.8 | 69 | 63.9 | n.s. | 3 | n.s. | |
| Intrathoracic MNG | 15 | 7.4 | 5 | 4.6 | ||||
| Nodular goiter | 21 | 10.4 | 21 | 19.4 | 45 | |||
| Graves-Basedow disease | 15 | 7.4 | 11 | 10.2 | ||||
| Metastasis | 1 | 0.5 | 1 | 0.9 | ||||
| Thyroiditis | 1 | 0.5 | 0 | 0.0 | ||||
| Reoperation for cancer | 0 | 0.0 | 1 | 0.9 | ||||
| Central lymph node dissection | ||||||||
| Yes | 11 | 5.4 | 17 | 15.7 | <.005 | n.s. | ||
| No | 191 | 94.6 | 91 | 84.3 | 0 | |||
| Histology | ||||||||
| Benign | 168 | 83.2 | 78 | 72.2 | n.s. | 44 | 91.7 | n.s. |
| Hyperplasia | 162 | 80.2 | 72 | 66.7 | 11 | 22.9 | ||
| Thyroiditis | 4 | 2.0 | 4 | 3.7 | 2 | 4.2 | ||
| Adenoma | 2 | 1.0 | 2 | 1.9 | 31 | 64.6 | ||
| Malignant | 34 | 16.8 | 30 | 27.8 | 4 | 8.3 | ||
| Hospitalization in days | ||||||||
| Mean (SD) | 2.0 | (0.5) | 3.2 | (1.2) | <.001 | 1 | 0 | .001 |
SD: standard deviation; n.s.: not significant; MNG: multinodular goiter.
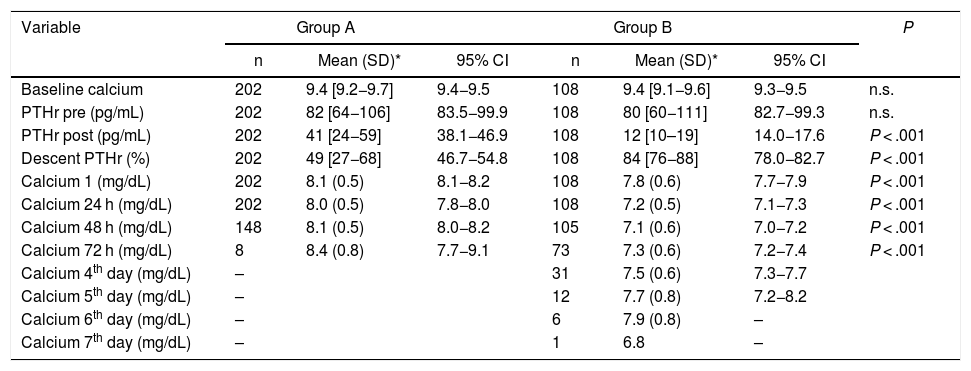
The 202 patients in Group A remained asymptomatic; in Group B, 108 (34.9%) were asymptomatic, 79 developed symptoms during hospitalization (25.4% of the total), and 29 cases remained asymptomatic despite biochemical hypocalcemia (although they received treatment during the stay). Almost all patients started replacement therapy on the second day of admission (48 ± 12 h). Fig. 1 shows these groups and the length of stay, which, as can be seen, significantly increased in group B vs. A (3.1 ± 1.5 vs. 2 ± 0.6, P < .001).
In the control group, there were 48 cases (41 women, 7 men) with a mean age of 47.1 ± 13 years. The diagnosis was solitary nodule in 45 patients, 31 of which were histologically adenomas and 4 were cancer. There were no postoperative complications, and hospitalization was 24 h. As can be seen, there was a significant decrease in baseline calcium (9.4 ± 0.2 mg/dL) to Ca24 h (8.2 ± 0.4 mg/dL) and PTHrpre (83 ± 37 pg/dL) to PTHrpost (57 ± 25 pg/dL); P < .04. The decrease in PTHr was not very relevant (29 ± 17%). Data are shown in Table 2.
Biochemical data of Groups A and B regarding calcium and PTHr, at different times in the surgical process.
| Variable | Group A | Group B | P | ||||
|---|---|---|---|---|---|---|---|
| n | Mean (SD)* | 95% CI | n | Mean (SD)* | 95% CI | ||
| Baseline calcium | 202 | 9.4 [9.2−9.7] | 9.4−9.5 | 108 | 9.4 [9.1−9.6] | 9.3−9.5 | n.s. |
| PTHr pre (pg/mL) | 202 | 82 [64−106] | 83.5−99.9 | 108 | 80 [60−111] | 82.7−99.3 | n.s. |
| PTHr post (pg/mL) | 202 | 41 [24−59] | 38.1−46.9 | 108 | 12 [10–19] | 14.0−17.6 | P < .001 |
| Descent PTHr (%) | 202 | 49 [27−68] | 46.7−54.8 | 108 | 84 [76−88] | 78.0−82.7 | P < .001 |
| Calcium 1 (mg/dL) | 202 | 8.1 (0.5) | 8.1−8.2 | 108 | 7.8 (0.6) | 7.7−7.9 | P < .001 |
| Calcium 24 h (mg/dL) | 202 | 8.0 (0.5) | 7.8−8.0 | 108 | 7.2 (0.5) | 7.1−7.3 | P < .001 |
| Calcium 48 h (mg/dL) | 148 | 8.1 (0.5) | 8.0−8.2 | 105 | 7.1 (0.6) | 7.0−7.2 | P < .001 |
| Calcium 72 h (mg/dL) | 8 | 8.4 (0.8) | 7.7−9.1 | 73 | 7.3 (0.6) | 7.2−7.4 | P < .001 |
| Calcium 4th day (mg/dL) | – | 31 | 7.5 (0.6) | 7.3−7.7 | |||
| Calcium 5th day (mg/dL) | – | 12 | 7.7 (0.8) | 7.2−8.2 | |||
| Calcium 6th day (mg/dL) | – | 6 | 7.9 (0.8) | – | |||
| Calcium 7th day (mg/dL) | – | 1 | 6.8 | – | |||
SD: standard deviation. IQR: interquartile range; n.s.: not significant.
Calcium 1: Calcium at 7:00 am on the day of surgery.
There were no statistically significant differences in terms of sex, diagnosis, or histology, but there were differences in age, lymph node dissection and hospital stay between groups A and B.
In the biochemical determinations, we did not find statistically significant differences in the values of PTHrpre (82 vs. 90 pg/mL) and baseline calcium (9.4 vs. 9.4 mg/dL), but there were in PTHrpost (41 vs. 12 pg/mL), decrease in PTHr (49% vs. 83.6%), first calcium, Ca1 (8.1 vs. 7.7 mg/dL), calcium after 24 h (Ca 24 h) (8 vs. 7.1 mg/dL), calcium after 48 h (8.1 vs. 7 mg/dL) and calcium after 72 h (8.4 vs. 7.3 mg/dL).
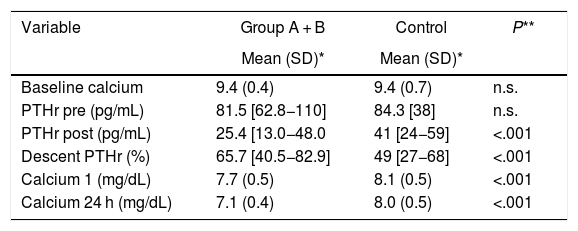
Compared to the control group, both group A and group B, the determinations of PTHrpost and decline, as well as postoperative calcium levels presented statistically significant differences, as did age (47.1 ± 13) (Table 3). With group B, the differences were more striking: PTHrpost 12 (10–19) vs. 57.7 (± 25.5), PTHr decrease 83.6 (76–87) vs. 29.7 (± 17.4), Ca 24 h 7.1 (± 0.5) vs. 8.25 (± 0.4); P < .001.
Comparison of Groups A, B and Control regarding calcium and PTHr, at different times of the surgical process.
| Variable | Group A + B | Control | P** |
|---|---|---|---|
| Mean (SD)* | Mean (SD)* | ||
| Baseline calcium | 9.4 (0.4) | 9.4 (0.7) | n.s. |
| PTHr pre (pg/mL) | 81.5 [62.8−110] | 84.3 [38] | n.s. |
| PTHr post (pg/mL) | 25.4 [13.0−48.0 | 41 [24−59] | <.001 |
| Descent PTHr (%) | 65.7 [40.5−82.9] | 49 [27−68] | <.001 |
| Calcium 1 (mg/dL) | 7.7 (0.5) | 8.1 (0.5) | <.001 |
| Calcium 24 h (mg/dL) | 7.1 (0.4) | 8.0 (0.5) | <.001 |
SD: standard deviation; n.s.: not significant.
Calcium 1: Calcium at 7:00 am on the day of the surgical procedure.
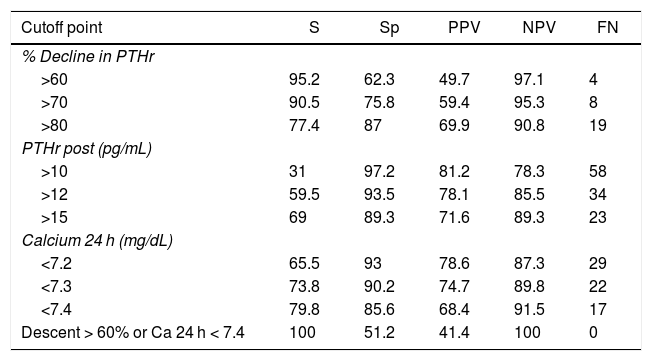
To determine which of these parameters can better predict the risk of hypocalcemia, we compared the area under the curve (AUC) of the following variables (Fig. 2): 0.89 (95% CI: 0.8−0.9) for PTHr decrease; 0.89 (95% CI: 0.8−0.9) for PTHrpost; 0.7 (95% CI: 0.6−0.9) for calcium levels in the afternoon; and 0.87 (95% CI: 0.8−0.9) for calcium after 24 h. In order to find the maximum sensitivity and the lowest number of false negatives (FN), these variables with higher AUC were compared and different arbitrary cut-off points were analyzed, based on the literature8,10–12 and on the biochemical measurements (Table 2). Table 4 summarizes: decrease in PTHr of 60%, 70% and 80%, absolute value of PTHrpost of 10, 12, 15 pg/mL, calcium between 7.2 and 7.4 mg/dL, as well as associated decrease of 60% and calcium less than 7.4 mg/dL. None of these cut-off points achieves 100% sensitivity, and there are also false negatives. Only by combining the parameters with the highest sensitivity (a decrease of more than 60% with Ca 24 h less than 7.4 mg/dL) is this 100% achieved without leaving theoretical false negatives, but at a cost of 48% of false positives. It is noteworthy that only four symptomatic patients presented a decrease of less than 60% with 24-h calcium levels below 7.4 mg/dL, meaning that the decrease in PTHr was more sensitive than calcium, except in these four patients.
Evaluation of different cut-off points of the variables: percentage of drop in PTHr, PTHr postop and calcium after 24 h.
| Cutoff point | S | Sp | PPV | NPV | FN |
|---|---|---|---|---|---|
| % Decline in PTHr | |||||
| >60 | 95.2 | 62.3 | 49.7 | 97.1 | 4 |
| >70 | 90.5 | 75.8 | 59.4 | 95.3 | 8 |
| >80 | 77.4 | 87 | 69.9 | 90.8 | 19 |
| PTHr post (pg/mL) | |||||
| >10 | 31 | 97.2 | 81.2 | 78.3 | 58 |
| >12 | 59.5 | 93.5 | 78.1 | 85.5 | 34 |
| >15 | 69 | 89.3 | 71.6 | 89.3 | 23 |
| Calcium 24 h (mg/dL) | |||||
| <7.2 | 65.5 | 93 | 78.6 | 87.3 | 29 |
| <7.3 | 73.8 | 90.2 | 74.7 | 89.8 | 22 |
| <7.4 | 79.8 | 85.6 | 68.4 | 91.5 | 17 |
| Descent > 60% or Ca 24 h < 7.4 | 100 | 51.2 | 41.4 | 100 | 0 |
S: sensitivity; PPV: positive predictive value; FN: false negatives; Sp: specificity; NPV: negative predictive value.
Out of the 310 patients, 108 (34.8%) from group B required treatment with calcium (due to symptoms or due to maintained hypocalcemia, as explained). The 29 cases that remained asymptomatic received oral calcium in order to break the downward trend of calcium levels. It is possible that these patients did not develop symptoms for this reason. In fact, there were 11 cases (3.3%) of definitive hypoparathyroidism, all in this group B and one in the asymptomatic subgroup. The mean time of suspension of treatment after discharge was 3.4 months.
DiscussionThyroidectomy is a risk factor for the viability of the parathyroid glands, and this risk is increased with more complex surgeries (lymphadenectomy, large goiters, etc.).12–14 For this reason, we believe that the most adequate parameter to predict post-thyroidectomy hypocalcemia is the determination of PTH levels, including this type of surgeries that increase the risk of glandular injury and, consequently, PTH levels.
However, there is great variability in the parameters to be studied (time, type of PTH, method of obtaining it, definitions of hypoparathyroidism, etc.), which makes it very difficult to establish a threshold, a figure or a cut-off point that determines the risk of developing post-thyroidectomy hypocalcemia,15–17 although they also support its usefulness in detecting this risk and/or stratifying patients.4,18,19 The very definition of hypocalcemia is also confusing, and in practice a figure below normal laboratory ranges is used, usually 8 mg/dL (2 mmol/L).10,20,21 It is justified because it is ‘clinically’ more relevant.4
In a review of 4 articles, the Association of Australian Endocrine Surgeons established that normal PTH after four hours predicts normocalcemia, although low PTH figures are not sensitive to predict hypocalcemia.4 In addition, Marthur, after reviewing 69 articles, concluded that ‘extreme heterogeneity’ makes it difficult to adopt a single PTH value as a predictor of hypocalcemia. The wide availability of PTH determination systems and the variability between them also contribute to this.22–24 The AEC clinical guidelines recommend analyzing the percentage of PTH decrease rather than an absolute value.25 Other reviews have established that its determination is the best method of stratifying risk, although without 100% sensitivity.18,19 There are also studies that underestimate its usefulness, for instance del Rio in a series of 1006 cases with PTH analysis after 24 h26 and Lombardi after 4 h.27
Comparison between PTH determinationsPTH measurements and their relationship with hypocalcemia can be grouped according to type (standard9,28–30 or rapid8,12,13,20,31), time of extraction (baseline, minutes,12,31–33 hours, or days post-thyroidectomy21,29,33–35), value analyzed (decline11,31,36,37 or absolute value21,28,32,33), association between different PTH determinations and/or calcium levels.8,12,38–40 All of these data rarely coincide. 100% sensitivity is not the norm,11,29,31,37,38,41 and false negatives are therefore frequent and significant.28,42 However, this circumstance does not seem to affect decision-making, alleging a low possibility of presenting symptoms, or that the cut-off points select patients without risk.32,43,44
Rapid measurements allow the results to be obtained during surgery, so risk can be predicted early, without depending on third parties later, causing less discomfort for the patient and optimizing the method.42 Lee45 compared rapid and standard determination in the immediate postoperative period and found no significant differences. Although this shorter time of the samples with the antibodies may provide more ballpark figures than the actual PTH results, the study found that a decrease of 75% had a sensitivity and specificity of 100% and 72%, respectively. The authors concluded that it is useful to predict parathyroid function and identify patients at risk.31 The Di Fabio series had 33% of cases with hypocalcemia and 25.9% symptomatic cases; for the former, a decrease in PTH (baseline-10′) of 75.7% had the highest sensitivity (81.5%), and for the latter a cutoff of 79.5% (sensitivity 76.2%).20
Roh determined that a decrease of 70% (baseline-10') and a PTHpost >15 pg/mL could discriminate which patients were at risk.
In order to improve sensitivity and the false-negative rate, different parameters have been combined. Thus, Alia uses a 62.5% decrease in PTHr and a PTHrpost <18 pg/mL, to reach a sensitivity of 90% and 17% false negatives.8 Pisanu combines a PTH value of 12 pg/mL with a decrease of 60% at 6 h to reach 100%. Galy-Bernadoy compares two PTH kits with a single determination 10 min after thyroidectomy, using different cutoffs with each to achieve 100% PPV and NPV. In this series, there were 24% asymptomatic hypocalcemia and 14%–28% of cases in a ‘gray area’ for monitoring or treatment.
In this study, we analyze the effect of total thyroidectomy on perioperative parathyroid hormone secretion (using rapid measurement) and on total serum calcium in the immediate postoperative period and its correlation with clinical and biochemical hypocalcemia.
Total thyroidectomies and hemithyroidectomies present a decrease in calcium and postoperative PTHr.8,20 To determine which analytical variable has the highest sensitivity for hypocalcemia, we compared the AUC. None of the cut-off points used achieves 100% sensitivity with false negatives. To try to improve these results, we associated two variables, as is also reflected in other articles8,29,35,38,41 (a decrease of more than 60% or calcium of less than 7.4 mg/dL after 24 h). With these criteria, despite an increase in false positives (treated unnecessarily), false negatives would be avoided (not treated when needed), which is key as a predictive factor. Undoubtedly, it is safer to treat some cases unnecessarily than to discharge without treatment when necessary.42 Much of thyroid surgery is performed in regional hospitals with less volume and fewer resources, having to adapt the means and times to their possibilities with the least possible discomfort for patients.42 Given the aforementioned variability, each hospital should use the means available to develop a prediction algorithm.
This study has several limitations: the biochemical determinations available; and asymptomatic group B patients (29 cases) were administered high oral calcium prior to discharge, although they probably would have remained asymptomatic, with calcium levels tending to normalize in a few days. The criterion for this was the gradual decrease of calcium levels,46 which prevented us from safely discharging these patients.
The conclusion of our study is that rapid PTH determination clearly reflects the effect of surgery on post-thyroidectomy parathyroid function and can be used as a predictor for hypocalcemia. The combination of the percentage decrease in PTHr (60%) with 24 h calcium (<7.4 mg/dL) reaches a sensitivity of 100%. With the selected cut-off points, patients without risk could be identified, thereby avoiding generalized treatments and an earlier discharge with scientific criteria.
FundingThis study has received no specific funding from public, commercial or non-profit entities.
Please cite this article as: Gutiérrez Fernández G, López Useros A, Muñoz Cacho P, Casanova Rituerto D. Predicción de hipocalcemia postiroidectomía mediante determinación de PTH rápida. Cir Esp. 2021;99:115–123.


