


The results previously obtained in Spain in the study of the relationship between surgical caseload and in-hospital mortality are inconclusive. The aim of this study is to evaluate the volume–outcome association in Spain in the setting of digestive oncological surgery.
MethodsAn analytical, cross-sectional study was conducted with data from patients who underwent surgical procedures with curative intent of esophageal, gastric, colorectal and pancreatic neoplasms between 2006 and 2009 with data from the Spanish MBDS. In-hospital mortality was used as outcome variable. Control variables were patient, health care and hospital characteristics. Exposure variable was the number of interventions for each disease, dividing the hospitals in 3 categories: high volume (HV), mid volume (MV) and low volume (LV) according to the number of procedures.
ResultsAn inverse, statistically significant relationship between procedure volume and in-hospital mortality was observed for both volume categories in both gastric (LV: OR=1.50 [IC 95%: 1.28–1.76]; MV: OR=1.49 (IC 95%: 1.28–1.74)) and colorectal (LV: OR=1.44 [IC 95%: 1.33–1.55]; MV: OR=1.24 [IC 95%: 1.15–1.33]) cancer surgery. In pancreatic procedures, this difference was only statistically significant between LV and HV categories (LV: OR=1.89 [IC 95%: 1.29–2.75]; MV: OR=1.21 [IC 95%: 0.82–1.79]). Esophageal surgery also showed an inverse relationship, which was not statistically significant (LV: OR=1.89 [IC 95%: 0.98–3.64]; MV: OR=1.05 [IC 95%: 0.50–2.21]).
ConclusionsThe results of this study suggest the existence in Spain of an inverse relationship between caseload and in-hospital mortality in digestive oncological surgery for the procedures analysed.
Los resultados de estudios realizados en España sobre la relación inversa entre el número de intervenciones quirúrgicas y la mortalidad intrahospitalaria no han sido concluyentes. El objetivo de este trabajo ha sido analizar la relación entre número de intervenciones quirúrgicas y mortalidad en la cirugía del cáncer digestivo en España.
MétodosEstudio analítico, transversal con datos procedentes del CMBD, de los pacientes tratados con cirugía con intención curativa de neoplasias esofágicas, gástricas, colorrectales y pancreáticas entre 2006 y 2009. Se utilizó la mortalidad intrahospitalaria como variable de resultados. Las variables de control fueron características de los pacientes, la asistencia sanitaria y los hospitales. La variable de exposición fue el número de intervenciones para cada enfermedad, dividiendo los hospitales en 3 categorías: volumen alto (VA), volumen medio (VM) y volumen bajo (VB) en función del número de intervenciones quirúrgicas realizadas.
ResultadosSe observó una relación inversa, estadísticamente significativa en ambas categorías, de volumen tanto en cirugía gástrica (VB: OR=1,50 [IC 95%: 1,28–1,76]; VM: OR=1,49 [IC 95%: 1,28–1,74]) como en cirugía colorrectal (VB: OR=1,44 [IC 95%: 1,33–1,55]; VM: OR=1,24 [(IC 95%: 1,15–1,33]). En cirugía pancreática, la diferencia solo fue estadísticamente significativa entre las categorías de menor y mayor volumen (VB: OR=1,89 [IC 95%: 1,29–2,75]; VM: OR=1,21 [IC 95%: 0,82–1,79]). La cirugía de esófago también mostró una relación inversa entre el volumen de intervenciones quirúrgicas y la mortalidad, pero no fue estadísticamente significativa (VB: OR=1,89 [IC 95%: 0,98–3,64]; VM: OR=1,05 [IC 95%: 0,50–2,21]).
ConclusionesEstos resultados indican que en España existe una relación inversa entre número de intervenciones quirúrgicas y mortalidad intrahospitalaria en la cirugía del cáncer digestivo.
In 1979, Luft et al.1 described the inverse relationship between surgical volume and mortality in cardiovascular surgery. Since then many studies have analysed this relationship for other types of surgical procedures, in the search for a method that meets the need to quantify the factors that affect the quality of healthcare. Although a great many studies including meta-analyses have linked lower case volume with poorer outcomes in oncological surgery,2–6 many other studies give different and even opposing results: practice makes perfect versus less volume means more attentive care.4
The results obtained previously in Spain are not conclusive. Díaz de Tuesta7 found no relationship in a study of more than 6000 patients treated by different cardiovascular operations. He postulated that this lack of a relationship could be attributed to the characteristics of the Spanish healthcare system, in which patients are distributed according to sectorial criteria and personalised referral is complicated. Nor did Baré et al.8 find a relationship between surgical volume and results in gastric cancer surgery, while Pla et al.9 only found a relationship between a higher volume of surgical operations and lower mortality in surgery for cancer of the oesophagus, pancreas and hepatic metastasis.
One reason that may explain these differences is the high level of heterogeneity in the design and methodology of these studies, as well as the data they analyse. This hinders comparison of them and the generalisation of their results.
Cancer is the second most common cause of death in Spain, and it is the first in terms of potential years of life lost. It is also one of the major causes of hospitalisation. The Cancer Strategy of the National Healthcare System states that several aspects connected with the organisation and management of cancer patient care in Spain could be improved. These aspects concern the continuity of care, diagnosis and staging, therapeutic decision-making, variability in practices and results and the volume of patients treated.10 It must also be said that there is a growing number of new cancer monitor registers, while existing ones are increasingly coordinated.11 One example of this is the EURECCA project, which has the aim of homogenising data gathering and analytical methods so that it will be possible to know the situation of the disease in Europe almost in real time, in terms of diagnosis, treatment and results.12 The final aim of platforms of this type is to use the resulting data to design and implement healthcare practices that improve the quality of care and guarantee patient safety.13
The question that still lacks a clear answer is whether it is possible to set a minimum number of cases that will guarantee good quality care, and even to offer information to patients and healthcare professionals so that they can select a hospital based on its results.14
The variability of the results obtained in these papers shows the need for a study that is able to clarify the doubts about the situation in our country.
The aim of this study is to evaluate the association in Spain between outcome measured in terms of in-hospital mortality and the volume of surgical operations carried out in the field of digestive cancer. It analyses the characteristics of patients, the care they receive and the aspects of hospitals that can be linked to differences in in-hospital mortality associated with surgery. 4 types of surgery were selected for this, characterised by their high levels of morbimortality and the existence of studies in other countries that support the relationship between the volume of cases and results in the context of these operations.15
MethodsAn analytical transversal study was undertaken with data for patients who had been treated surgically for cancer of the oesophagus, stomach, colon–rectum and pancreas in the hospitals included in the Minimum Basic Set of Data (MBSD) of the Ministry of Health, Social Services and Equality from 2006 to 2009.
The source of information used was the MBSD. This contains administrative data (identification of the hospital, identification of the patient, financing, the circumstances of admission, circumstances at discharge, date of admission, date of discharge, responsible doctor), patient data (date of birth, sex, place of residence) and clinical data (main diagnosis, secondary diagnoses, diagnostic, surgical and obstetric procedures).4 The records of all the patients diagnosed with cancer of the oesophagus, stomach, colon–rectum or pancreas who had records of codes corresponding to the surgical procedures with curative intent included in Appendices A and B (available online) were taken into account.
Intrahospital mortality was the results variable. The control variables were patient characteristics (age, sex, score on Charlson's index), care provided (hospital stay prior to surgery, whether the operation took place during readmission following hospitalisation in the previous 30 days). Hospital data were also recorded (number of beds, number of surgeons, intensive care specialists, internists and nursing personnel). Hospital staff data were supplied by the Ministry of Health.
The exposure variable was the number of each type of procedure recorded in each one of the hospitals in the period from 2006 to 2009. This last variable was introduced into the model as a categorical variable, and the hospitals were divided into terciles according to the number of procedures for each one of the types of cancer.
Statistical AnalysisA descriptive analysis was first carried out of all the control and exposure variables. Bivariate analysis was then undertaken for each one of the independent control variables (age, sex, hospitalisation before surgery, readmission, Charlson index, number of beds, number of surgeons, intensive care specialists, internists, and nursing staff) as well as a second χ2 for the number of cases. Finally a multivariate logistic regression model was created for each one of the 4 types of intervention, introducing the variables which in the first bivariate analysis had been found to be statistically significant, or which the authors considered clinically relevant following a revision of the literature. To determine the calibration and discrimination of the models, the Hosmer–Lemeshow χ2 was obtained for them together with the area under the ROC curve.
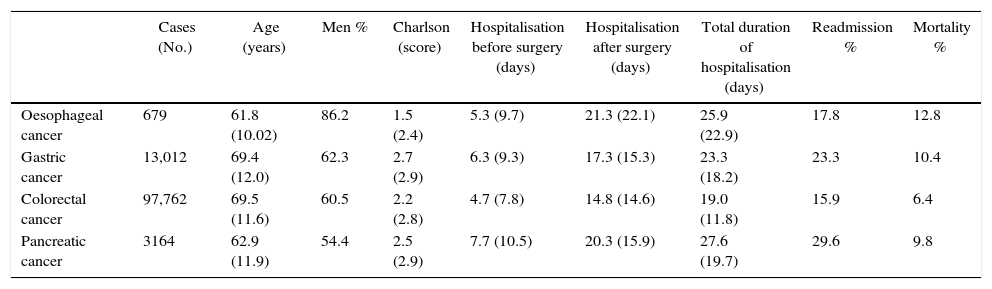
ResultsTable 1 shows the main patient characteristics analysed. The 4 types of intervention were performed more on men than on women. The average age range varied from 61.8 years old in oesophageal cancer to 69.5 years old for colorectal cancer. Readmissions ranged from 15.9% in colorectal cancer to 29.6% in pancreatic cancer.
General Characteristics of the Study Population.
| Cases (No.) | Age (years) | Men % | Charlson (score) | Hospitalisation before surgery (days) | Hospitalisation after surgery (days) | Total duration of hospitalisation (days) | Readmission % | Mortality % | |
|---|---|---|---|---|---|---|---|---|---|
| Oesophageal cancer | 679 | 61.8 (10.02) | 86.2 | 1.5 (2.4) | 5.3 (9.7) | 21.3 (22.1) | 25.9 (22.9) | 17.8 | 12.8 |
| Gastric cancer | 13,012 | 69.4 (12.0) | 62.3 | 2.7 (2.9) | 6.3 (9.3) | 17.3 (15.3) | 23.3 (18.2) | 23.3 | 10.4 |
| Colorectal cancer | 97,762 | 69.5 (11.6) | 60.5 | 2.2 (2.8) | 4.7 (7.8) | 14.8 (14.6) | 19.0 (11.8) | 15.9 | 6.4 |
| Pancreatic cancer | 3164 | 62.9 (11.9) | 54.4 | 2.5 (2.9) | 7.7 (10.5) | 20.3 (15.9) | 27.6 (19.7) | 29.6 | 9.8 |
Data are expressed as numbers (No.), percentages (%) or averages with their standard deviation (SD).
Source: MBSD (Spain, 2006–2009).
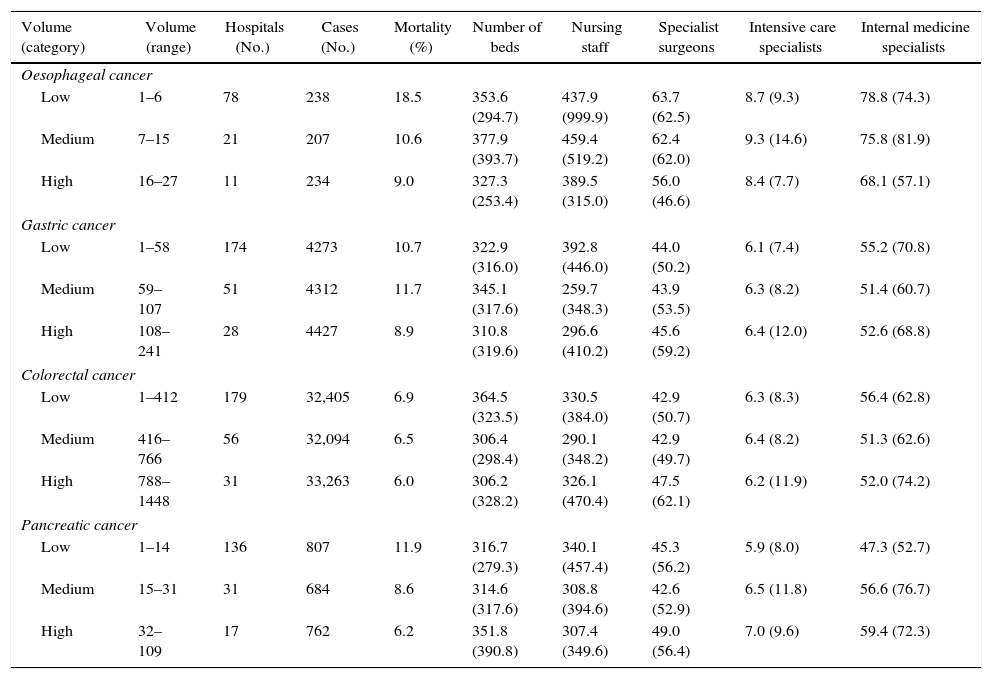
Table 2 shows the classification of the different hospitals into categories according to volume and differences in gross mortality, the number of procedures and staff numbers in the hospitals included in the analysis. Neither the number of beds or professionals–both of which could be considered indicators of hospital size–seem to have any relationship with the volume of procedures.
Characteristics of the Hospitals and Volume Categories Defined for the Analysis.
| Volume (category) | Volume (range) | Hospitals (No.) | Cases (No.) | Mortality (%) | Number of beds | Nursing staff | Specialist surgeons | Intensive care specialists | Internal medicine specialists |
|---|---|---|---|---|---|---|---|---|---|
| Oesophageal cancer | |||||||||
| Low | 1–6 | 78 | 238 | 18.5 | 353.6 (294.7) | 437.9 (999.9) | 63.7 (62.5) | 8.7 (9.3) | 78.8 (74.3) |
| Medium | 7–15 | 21 | 207 | 10.6 | 377.9 (393.7) | 459.4 (519.2) | 62.4 (62.0) | 9.3 (14.6) | 75.8 (81.9) |
| High | 16–27 | 11 | 234 | 9.0 | 327.3 (253.4) | 389.5 (315.0) | 56.0 (46.6) | 8.4 (7.7) | 68.1 (57.1) |
| Gastric cancer | |||||||||
| Low | 1–58 | 174 | 4273 | 10.7 | 322.9 (316.0) | 392.8 (446.0) | 44.0 (50.2) | 6.1 (7.4) | 55.2 (70.8) |
| Medium | 59–107 | 51 | 4312 | 11.7 | 345.1 (317.6) | 259.7 (348.3) | 43.9 (53.5) | 6.3 (8.2) | 51.4 (60.7) |
| High | 108–241 | 28 | 4427 | 8.9 | 310.8 (319.6) | 296.6 (410.2) | 45.6 (59.2) | 6.4 (12.0) | 52.6 (68.8) |
| Colorectal cancer | |||||||||
| Low | 1–412 | 179 | 32,405 | 6.9 | 364.5 (323.5) | 330.5 (384.0) | 42.9 (50.7) | 6.3 (8.3) | 56.4 (62.8) |
| Medium | 416–766 | 56 | 32,094 | 6.5 | 306.4 (298.4) | 290.1 (348.2) | 42.9 (49.7) | 6.4 (8.2) | 51.3 (62.6) |
| High | 788–1448 | 31 | 33,263 | 6.0 | 306.2 (328.2) | 326.1 (470.4) | 47.5 (62.1) | 6.2 (11.9) | 52.0 (74.2) |
| Pancreatic cancer | |||||||||
| Low | 1–14 | 136 | 807 | 11.9 | 316.7 (279.3) | 340.1 (457.4) | 45.3 (56.2) | 5.9 (8.0) | 47.3 (52.7) |
| Medium | 15–31 | 31 | 684 | 8.6 | 314.6 (317.6) | 308.8 (394.6) | 42.6 (52.9) | 6.5 (11.8) | 56.6 (76.7) |
| High | 32–109 | 17 | 762 | 6.2 | 351.8 (390.8) | 307.4 (349.6) | 49.0 (56.4) | 7.0 (9.6) | 59.4 (72.3) |
Data are expressed as numbers (No.), percentages (%) or averages with their standard deviation (SD).
Source: MBSD (Spain, 2006–2009).
Table 3 shows the risk of in-hospital mortality associated with the factors considered. A statistically significant positive relationship was found between male sex, age and mortality in all 4 types of procedure. A longer preoperative stay was associated with a higher risk of mortality in all 4 types of cancer except for pancreatic cancer surgery, which was at the limit of statistical significance (P=.052). Readmission was only statistically significant associated with colorectal cancer surgery. The Charlson index was significantly associated with mortality for gastric and colorectal cancer surgery. None of the variables related with the number of beds of professionals in the hospitals was found to be statistically significantly associated with mortality. A negative association that was quite often statistically significant was found to exist between the number of cases in each hospital and mortality.
Risk of In-hospital Mortality: OR of Patient, Care Process and Hospital Factors According to Type of Cancer.
| Oesophageal cancer | Gastric cancer | Colorectal cancer | Pancreatic cancer | |||||||||
|---|---|---|---|---|---|---|---|---|---|---|---|---|
| OR | IC 95% | OR | IC 95% | OR | IC 95% | OR | IC 95% | |||||
| Inf | Sup | Inf | Sup | Inf | Sup | Inf | Sup | |||||
| Women | 0.42 | 0.18 | 1.00 | 0.83 | 0.74 | 0.93 | 0.81 | 0.77 | 0.86 | 0.69 | 0.55 | 0.89 |
| Age | 1.05 | 1.03 | 1.08 | 1.06 | 1.05 | 1.06 | 1.07 | 1.07 | 1.08 | 1.06 | 1.05 | 1.08 |
| Preoperative stay | 1.02 | 1.00 | 1.05 | 1.03 | 1.03 | 1.04 | 1.03 | 1.03 | 1.04 | 1.02 | 1.01 | 1.03 |
| Postoperative stay | 1.00 | 0.99 | 1.01 | 1.03 | 1.03 | 1.04 | 1.03 | 1.03 | 1.04 | 1.02 | 1.01 | 1.03 |
| Total stay | 1.00 | 1.00 | 1.02 | 1.03 | 1.03 | 1.04 | 1.03 | 1.03 | 1.04 | 1.02 | 1.01 | 1.03 |
| Readmission | 0.71 | 0.37 | 1.35 | 1.08 | 0.95 | 1.24 | 1.22 | 1.14 | 1.30 | 0.81 | 0.62 | 1.05 |
| Charlson index | 0.93 | 0.83 | 1.03 | 1.02 | 1.00 | 1.04 | 1.09 | 1.08 | 1.10 | 1.00 | 0.97 | 1.05 |
| Average beds | 1.00 | 0.99 | 1.00 | 1.00 | 1.00 | 1.00 | 1.00 | 1.00 | 1.00 | 1.00 | 0.99 | 1.00 |
| Average surgeons | 0.99 | 0.98 | 1.01 | 1.00 | 0.99 | 1.01 | 1.00 | 1.00 | 1.01 | 0.99 | 0.99 | 1.00 |
| Average intensive care doctors | 0.89 | 0.79 | 1.02 | 0.99 | 0.94 | 1.05 | 1.00 | 0.95 | 1.04 | 0.97 | 0.92 | 1.02 |
| Average nursing staff | 1.00 | 1.00 | 1.00 | 1.00 | 1.00 | 1.00 | 1.00 | 1.00 | 1.00 | 1.00 | 1.00 | 1.00 |
| Average internists | 0.99 | 0.97 | 1.01 | 1.00 | 1.00 | 1.01 | 1.00 | 0.99 | 1.00 | 1.00 | 0.99 | 1.00 |
| Low volume | 2.30 | 1.32 | 4.01 | 1.24 | 1.07 | 1.42 | 1.18 | 1.11 | 1.25 | 2.04 | 1.27 | 3.27 |
| Medium volume | 1.21 | 0.64 | 2.26 | 1.36 | 1.19 | 1.57 | 1.09 | 1.02 | 1.16 | 1.42 | 0.87 | 2.31 |
| High volumea | 1.00 | 1.00 | 1.00 | 1.00 | ||||||||
Source: MBSD (Spain, 2006–2009).
IC 95%: 95% interval of confidence; Inf: lower limit of the interval of confidence; OR: odds ratio; Sup: upper limit of the interval of confidence.
Fig. 1 shows the gross mortality for each hospital in relation with the volume of surgical operations for each one of the cancers analysed. It can be seen that the greatest variation in in-hospital mortality occurs in the group of hospitals with the lowest volume of cases, and this is also the group which contains the largest number of hospitals.
 oesophageal cancer; (B) gastric cancer; (C) colorectal cancer and (D) pancreatic cancer. Source: MBSD (Spain, 2006–2009).")
Table 4 shows the results of mortality adjusted for the different categories of surgical volume, the value of the Hosmer–Lemeshow χ2 and the area under the ROC curve of each model. A large reduction was seen in the OR (odds ratio) compared with the gross figures. This probably indicates that some of the differences observed are connected with differences in the characteristics measured by the control variables. In gastric and colorectal cancer surgery a statistically significant inverse relationship was found between in-hospital mortality and the categories of low and medium surgical volume. In the case of pancreatic cancer the differences were only statistically significant between the categories of smaller and larger surgical volumes. In oesophageal cancer an inverse relationship was found between the number of surgical operations and mortality, although this was not statistically significant.
Mortality Risk Adjusted for Patient and Care Process Characteristics.
| Volume category | Volume range | OR | IC 95% | |
|---|---|---|---|---|
| Inf | Sup | |||
| Oesophageal cancer | ||||
| Low | 1–6 | 1.89 | 0.98 | 3.64 |
| Medium | 7–15 | 1.05 | 0.50 | 2.21 |
| Higha | 16–27 | 1.00 | ||
| Hosmer–Lemeshowχ2: P=.13 | ||||
| Area under ROC curve 0.70 | ||||
| Gastric cancer | ||||
| Low | 1–58 | 1.50 | 1.28 | 1.76 |
| Medium | 59–107 | 1.49 | 1.28 | 1.74 |
| Higha | 108–241 | 1.00 | ||
| Hosmer–Lemeshowχ2: P=.97 | ||||
| Area under ROC curve 0.68 | ||||
| Colorectal cancer | ||||
| Low | 1–412 | 1.44 | 1.33 | 1.55 |
| Medium | 416–766 | 1.24 | 1.15 | 1.33 |
| Higha | 788–1448 | 1.00 | ||
| Hosmer–Lemeshow χ2: P=.00 | ||||
| Area under ROC curve 0.72 | ||||
| Pancreatic cancer | ||||
| Low | 1–14 | 1.89 | 1.29 | 2.75 |
| Medium | 15–31 | 1.21 | 0.82 | 1.79 |
| Higha | 32–109 | 1.00 | ||
| Hosmer–Lemeshow χ2: P=.29 | ||||
| Area under ROC curve 0.69 | ||||
Source: MBSD (Spain, 2006–2009).
IC 95%: 95% interval of confidence; Inf: lower limit of the interval of confidence; OR: odds ratio; Sup: upper limit of the interval of confidence.
The results of this study indicate the existence in our country of an inverse relationship between surgical volume and in-hospital mortality associated with digestive cancer surgery. This relationship remains after adjusting for the characteristics of the patients as well as the care process and the hospitals. This pattern was observed in all of the 4 types of surgical operation analysed here. The results show a greater effect for the diseases treated less often by surgery, oesophageal and pancreatic cancer.
The limitations of this study mainly derive from the fact that it used clinical–administrative data. The first limitation of analysis using data of this type is connected with reliability due to possible differences in coding between hospitals. The second limitation lies in the absence of more specific variables on the clinical state of patients as well as the care they receive, as these may be relevant.
It was decided in this study to include colon and rectal cancer as a single entity. This is because an initial study of the data bases found that the vast majority of patients had codes corresponding to diagnosis of this disease in both locations. Patients with an initial diagnosis of colon cancer had received treatment for rectal cancer, and vice versa. This may be a limitation in this study and for possible comparison of the results here with those of other studies.
Additionally, it is not possible to know what happened to the patients once they had been discharged. This may lead to underestimation of the overall mortality associated with surgery. In any case, the important thing for the objectives of this work and which could affect the results of the same is whether differences in mortality exist after discharge between hospitals according to their surgical volumes.
It is also important to underline that although the associations detected represent the averaged result of hospitals with low and high surgical volumes, they do not reflect the wide variability in the results within each category, especially in the group of low volume hospitals. Some hospitals in this group present gross results that are equivalent to those of the hospitals with the best results in the high surgical volume group. Nevertheless, in the low volume group of hospitals the rates of mortality are less stable than they are in the high volume group. These results lead us to think that the volume of surgical procedures in a hospital is not the only factor associated with mortality in connection with surgery. It may therefore be hypothesised that there must be other factors which may have a relevant effect and which should be investigated. The volume of cases has therefore been said to have a combined effect, as it is an exogenic attribute which may be an independent predictor of quality (practice makes perfect), as well as an endogenic attribute which forms a part of the causal chain of the results.16
One of the possible reasons for the differences in mortality found may be the existence of differences in patient profiles.17 We have tried to resolve this problem by adjusting individual patient risk using the Charlson index. One limitation of using the MBSD is the difficulty in differentiating comorbidities from complications, given that both are coded as secondary diagnoses. Although other relevant data are gathered in studies using clinical databases, they have the drawback of making it necessary to directly consult clinical histories. In this study the Charlson index only showed an association with mortality for gastric and colorectal cancer surgery, the 2 types of surgery with the largest numbers of cases. As the Charlson index collects information on 17 variables, it is possible that the absence of statistical significance for oesophageal and pancreatic neoplasia surgery is due more to the low number of operations for these 2 conditions than it is to a true lack of association.
However, and even though the evidence supporting the relationship between the number of procedures and results is quite consistent, the underlying mechanisms for this have yet to be described. One hypothesis is that this relationship is based more on the volume of cases treated by surgeons than it is on hospital size.14,18,19 In this study information on the distribution of cases per surgeon was not available, so this cannot be analysed.
It has also been said that differences may be linked to factors such as the number of beds, staff, diagnostic services or the distribution of resources in the different specialities. In this study none of the structural variables affecting the hospitals showed any statistical significance. It may be necessary to evaluate this association with more specific data such as the number of surgical beds or the number of surgeons who work in each type of procedure for oncological surgery.
Another hypothesis is that the key to reducing in-hospital mortality is not only preventing the complications that patients may develop, but also being able to detect them early and treat them properly.20,21 What is known as ‘failure to rescue’ would be associated not only with the size of the hospital or experience–directly related to the number of procedures–but also with aspects of how care is organised.
A relevant aspect for healthcare planning is the possibility of determining the minimum number of procedures that a hospital has to perform to guarantee patient safety.22 Nevertheless, the literature on this subject does not make it possible to determine where this threshold of excellence lies. The studies are too heterogeneous and, although they divide hospitals into the categories of low, medium and high volumes of procedures, the ranges they use differ widely from one study to another. There is therefore great variation in the number of cases which define a hospital as having a high or low volume of procedures. As there is no consensus hospitals here have been classified into terciles, which is habitual in the international literature when evaluating the relationship between procedures and results. Nor is there any conclusive evidence that direct programmes for centralisation have led to benefits.23 Reductions in mortality have been detected when quality improvement programmes have been implemented.24,25
The results of these studies support the idea that surgery-related in-hospital mortality is affected by many factors. Although the volume of cases may be a proxy for the quality of care, there are many underlying processes which should be studied. These could be worked on to improve the results in terms of health.24 It would be especially interesting to have information so that the factors associated with hospitalisation prior to surgery or readmission could be examined, as they seem to have especially decisive affects on the results of this study.
Although the discriminatory power of the models is moderate, these data indicate that there is an inverse tendency in the relationship between volume and results. This suggests the need to offer these procedures in sufficiently specialised settings that have the necessary infrastructure.
The need to improve evaluation systems should also be pointed out. This is so in terms of information systems as well as analytical methodologies, so that it would be possible to know the actual situation of oncological surgery in Spain. This information could then be passed on to those in charge–medical and management personnel alike–as well as the patients, so that informed decisions could be taken to guarantee health care of the highest quality as well as patient safety.
FinancingThis study received financing from RETIC RD12/0001.
Conflict of InterestsThe authors have no conflict of interests to declare.
This work was presented as an end of course project for the Master's Degree in Public Health and Preventative Medicine of the Universidad de Alcalá-Escuela Nacional de Sanidad.
Please cite this article as: Pérez-López P, Baré M, Touma-Fernández Á, Sarría-Santamera A. Relación entre volumen de casos y mortalidad intrahospitalaria en la cirugía del cáncer digestivo. Cir Esp. 2016;94:151–158.
articles

Cirugía Española (English Edition) follows the Recommendations for the Conduct, Reporting, Editing and Publication of Scholarly Work in Medical Journals