


Background: Lower limb coronal alignment was thought to be a predictive factor for Unicompartmental Knee Arthroplasty (UKA) result. The tibial bony resection and implant position lead to joint line change postoperatively. Analysis was done to find out the correlation between these factors.
Methods: From 2019 to 2021, 90 medial Oxford UKA were implanted by a single surgeon. Hip Knee Ankle Angle (HKAA), Lateral Distal Femoral Angle (LDFA), Medial Proximal Tibial Angle (MPTA), and intraoperative bony resection thickness were measured. The medial joint line change was calculated. The correlation between joint line change and alignment change was evaluated.
Results: The mean tibial resection thickness was 4.3 mm. The mean tibial joint line was elevated by 2.3 mm, while the mean femoral joint line proximalized by 0.8 mm. HKAA changed from 8.4° varus preoperatively to 3.6° varus postoperatively. LDFA changed from 89.0° to 86.7°. MPTA changed from 85.6° to 86.6°. Preoperative HKAA showed a strong correlation with postoperative HKAA (p < 0.001), and preoperative MPTA showed a positive correlation with postoperative HKAA (p < 0.001). While preoperative LDFA had a negative correlation with postoperative HKAA (p < 0.001). The femoral joint line change and LDFA change had a significant correlation with HKAA change (p < 0.05).
Conclusion: The change of joint line had no correlation with postoperative HKAA in Oxford UKA. Preoperative HKAA strongly correlated with postoperative HKAA; while preoperative smaller LDFA and larger MPTA had a moderate correlation with postoperative HKAA. The femoral joint line change and LDFA change had a weak to moderate correlation with HKAA change.
Unicompartmental Knee Arthroplasty (UKA) serves as a viable solution for isolated compartmental knee osteoarthritis. UKA is characterized by the preservation of bone and ligaments, faster recovery, improved function, and reduced invasiveness [1,2]. The current phase 3 Oxford medial Unicompartmental Knee Arthroplasty (OUKA) has demonstrated positive survivorship, with a 94% success rate at 10 years across various populations [1-3]. In the realm of UKA, the most common failure modes include aseptic loosening, osteoarthritis progression in the contralateral compartment, and bearing dislocation in mobile-bearing systems [1-4].
Valgus malalignment, which places excessive load on the lateral compartment, has been identified as a risk factor for lateral cartilage damage and the progression of knee osteoarthritis [5]. The coronal alignment of the lower limb, particularly the hip-knee-ankle angle, has been reported as a more critical determinant of UKA outcomes than tibial component alignment [6]. In fact, postoperative minor to moderate varus alignment has been associated with positive long-term outcomes, in contrast to severe undercorrection or overcorrection [7,8]. Furthermore, it has been reported that the degree of tibiofemoral angle correction positively correlates with the thickness of the tibial implant in fixed-bearing UKA systems [9]. Postoperative limb alignment in OUKA has also been found to correlate more with the thickness of the insert rather than the alignments of the femoral and tibial components [10].
On another note, variations in implant size and the thickness of intraoperative bony resection could lead to changes in the medial joint line, potentially affecting limb alignment [9,11,12]. To our knowledge, no study has yet evaluated the relationship between changes in the medial joint line and limb alignment in mobile-bearing UKA. This study hypothesized that joint line changes induced by OUKA correlate with limb coronal alignment and may be associated with the development of valgus deformity.
Materials and methodsPatient characteristicsThis study was approved by the local medical foundation institutional review board with IRB Approval n° 202001568B0C101. Between February 2019 and January 2021, a consecutive series of 103 Oxford UKAs performed by a single senior surgeon was retrospectively reviewed.
UKA was indicated for patients with radiographic evidence of Anteromedial Osteoarthritis (AMOA), functionally intact cruciate and collateral ligaments, passively correctable varus deformity of less than 15°, flexion contracture of less than 15°, a range of motion exceeding 90°, and an asymptomatic patellofemoral joint. Patients with inflammatory arthritis were contraindicated. For comprehensive knee assessment and preoperative surgical planning, each patient underwent Magnetic Resonance Imaging (MRI) to evaluate cartilage loss, anterior cruciate ligament condition, and meniscal lesions. Functional outcomes were assessed postoperatively at two years using the Lysholm score, Oxford Knee Score, and Western Ontario and McMaster University Arthritis (WOMAC) index. The endpoint was set for July 2023.
Surgical procedureAll surgeries were conducted under general anesthesia using the minimally invasive technique with the mobile-bearing medial Oxford UKA (Zimmer Biomet, Warsaw, IN, USA). Both femoral and tibial components were cemented in each case. The intraoperative tibial resection thickness was measured with a caliper during the operation and recorded in the operative record. Specifically, the anteromedial part of the resected tibia was measured, as this area typically exhibits full-thickness cartilage wear in AMOA. The actual tibial resection thickness was determined by adding 0.89 mm to the recorded thickness to account for the saw blade thickness.
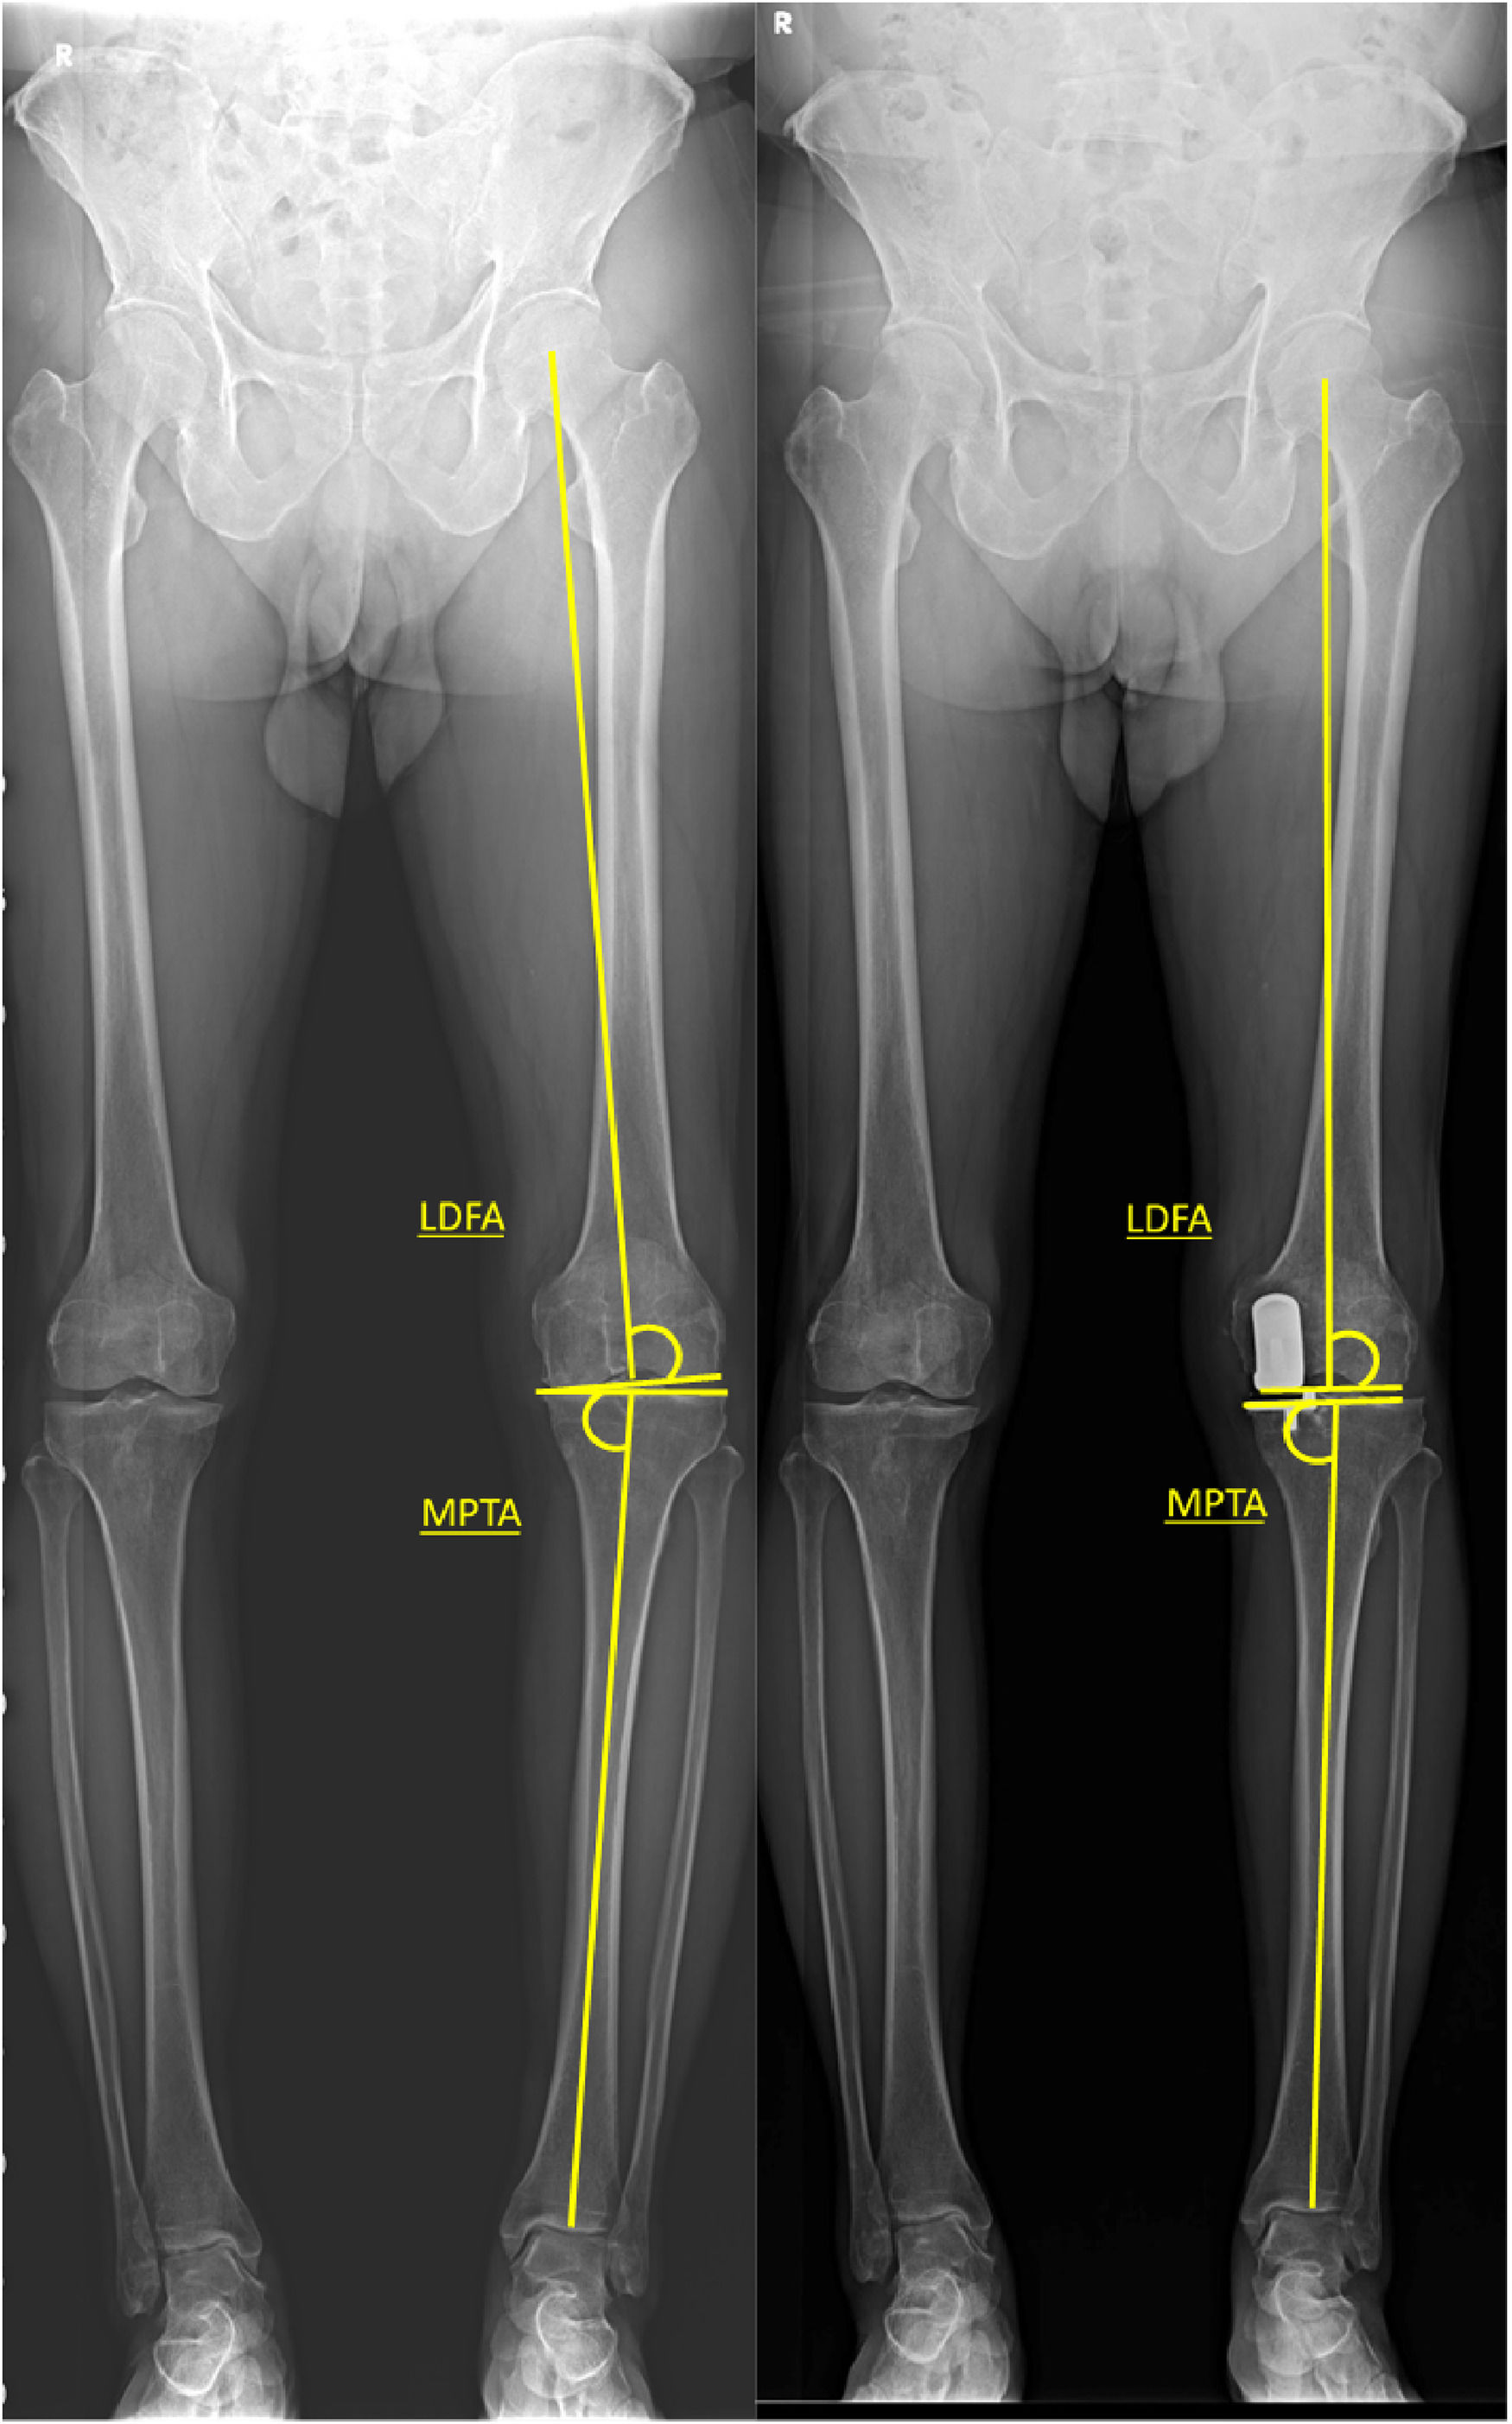
Radiographic evaluationPlain films included lower extremity split scanography, knee anteroposterior, lateral, and Merchant radiographs. Preoperatively, a valgus stress view was routinely used to assess deformity correctability and Medial Collateral Ligament (MCL) tension [13,14]. For lower limb coronal alignment, the following indices were measured: 1) Hip Knee Ankle Angle (HKAA), 2) Mechanical Lateral Distal Femoral Angle (LDFA), 3) Mechanical medial Proximal Tibial Angle (MPTA). HKAA was measured by the angle between the mechanical axes of the femur and tibia, with valgus deformity defined as HKAA > 180°. LDFA was determined by the lateral angle between the distal femoral joint line and the mechanical axis of the femur, while MPTA was defined as the medial angle between the tibial joint line and the mechanical axis of the tibia. Postoperatively, the tibial joint line was measured as a line parallel to the tibial tray (Figs. 1 and 2). Coronal alignment change was calculated by subtracting the preoperative value from the postoperative value [15-17].


Demonstration of pre-OP and post-OP LDFA and MPTA measurement. LDFA was determined by the lateral angle between the distal femoral joint line and the mechanical axis of the femur, while MPTA was defined as the medial angle between the tibial joint line and the mechanical axis of the tibia.
Medial Tibial Joint Line Change (MTJLC) was defined as the tibial implant thickness (comprising the tibial tray and insert) minus the actual tibial resection thickness. All tibial trays had a uniform thickness of 2.95 mm, and all inserts had an additional thickness of 0.5 mm, according to the manufacturer's specifications. A positive MTJLC value indicated joint line elevation or proximalization. Medial Femoral Joint Line Change (MFJLC) was defined as the distal femoral implant thickness minus the final spigot number. A positive MFJLC value indicated joint line distalization, while a negative value indicated joint line proximalization or reduction [12,18].
The lateral tibial and femoral cartilage thickness was measured on the preoperative MRI at the T2 coronal slice where intact full-thickness cartilage could be identified (Fig. 3). The authors also calculated the simulated joint line, taking cartilage thickness into account, to represent the healthy condition of the operated knee. The simulated Medial Tibial Joint Line Change (sMTJLC) was defined as MTJLC minus the simulated medial tibial cartilage thickness, which was calculated as the preoperative lateral tibial thickness divided by 1.37, following the study by Eckstein F et al. [19] The simulated Medial Femoral Joint Line Change (sMFJLC) was defined as MFJLC minus the preoperative lateral femoral cartilage thickness since no significant difference between medial and lateral femoral cartilage thicknesses was found in previous studies [19,20].

Demonstration of MRI measurement. The lateral femoral and tibial cartilage thickness was measured on T2 coronal slice where cartilage-to-cartilage contact point was noticed. The measurement was made from the contact point to individual subchondral bone plate as red line. Note that medial compartment full cartilage wear with meniscus extrusion was highlighted by the yellow circle.
Data were reported as means ± Standard Deviations (SDs). The Shapiro-Wilk test was used to assess data normality [21]. Pearson's correlation coefficient (r) was applied for normally distributed data, while Spearman's rank correlation was used for nonparametric data. A threshold of α = 0.05 was set for statistical significance. Data analysis was conducted using SPSS 20 (IBM Corp., Armonk, NY, USA).
ResultsPatient characteristicsA total of 90 knees from 81 patients with complete data were eligible for analysis. The average follow-up duration was 3.3 years (range: 2.5 to 4.4 years). The average age of the patients was 68.8±7.56 years (range: 50 to 85 years). One patient experienced bearing dislocation at two years, which necessitated conversion to total knee arthroplasty. Demographic details are presented in Table 1.
Descriptive statistics.
SD, Standard Deviation; BMI, Body Mass Index; HKAA, Hip-Knee-Ankle Angle; LDFA, Lateral Distal Femoral Angle; MPTA, Medial Proximal Tibial Angle.
The HKAA changed from a preoperative average of 171.6°±3.96° to 176.4°±3.84° postoperatively. The average preoperative and postoperative MPTAs were 85.6°±2.80° and 86.6° ± 2.98°, respectively. The LDFA changed from 89.0° ± 2.50° preoperatively to 86.7° ± 3.03° postoperatively (Table 1). All patients showed significant changes in HKAA, LDFA, and MPTA (p < 0.05) (Table 2). Twelve patients had a postoperative HKAA greater than 180°, but no early failures were recorded.
Joint line assessmentThe mean medial tibial joint line elevation was 2.3 ± 0.68 mm, and the mean medial femoral joint line proximalization was 0.8 ± 1.38 mm. The simulated tibial joint line elevation was 0.9 ± 0.72 mm, and the simulated femoral joint line reduction was 2.6 ± 1.44 mm (Table 1).
In terms of correlation with postoperative HKAA, preoperative HKAA showed a strong correlation (r = 0.777, p < 0.001). Preoperative LDFA had moderate negative correlations with postoperative HKAA (r = -0.549, p < 0.001). Preoperative MPTA demonstrated positive correlations with postoperative HKAA (r = 0.637, p < 0.001) (Table 3).
Correlation analysis between different factors and post-op HKAA.
| Coefficient of correlation (r) | p-value | |
|---|---|---|
| Tibial resection with saw blade thicknessa | -0.072 | 0.502 |
| Insert sizea | -0.048 | 0.654 |
| Tibial implant thicknessa | -0.048 | 0.654 |
| Spigota | -0.012 | 0.909 |
| Femoral implant distal thicknessa | -0.096 | 0.367 |
| Medial Tibial Joint Line Change (MTJLC)a | 0.062 | 0.563 |
| Medial Femoral Joint Line Change (MFJLC) | 0.005 | 0.962 |
| Simulated Medial Tibial Joint Line Change (sMTJLC) | 0.162 | 0.127 |
| Simulated Medial Femoral Joint Line Change (sMFJLC) | 0.052 | 0.623 |
| Pre-OP HKAA | 0.777 | <0.001 |
| HKAA change | 0.293 | 0.005 |
| Pre-OP LDFA | -0.549 | <0.001 |
| Post-OP LDFA | -0.389 | <0.001 |
| LDFA change | 0.063 | 0.555 |
| Pre-OP MPTA | 0.637 | <0.001 |
| Post-OP MPTA | 0.297 | 0.005 |
| MPTA change | -0.254 | 0.016 |
BMI, Body Mass Index; HKAA, Hip-Knee-Ankle Angle; LDFA, Lateral Distal Femoral Angle; MPTA, Medial Proximal Tibial Angle.
Regarding the correlation with HKAA change (Table 4), spigot size, medial femoral joint line change, postoperative LDFA, and LDFA change were statistically significant factors (r = -0.272, p = 0.009; r = 0.300, p = 0.004; r = -0.251, p = 0.017; r = -0.252, p = 0.016, respectively).
Correlation analysis between different factors and HKAA change.
| Coefficient of correlation | p-value | |
|---|---|---|
| Tibial resection with saw blade thicknessa | -0.143 | 0.178 |
| Insert sizea | -0.069 | 0.518 |
| Tibial implant thicknessa | -0.069 | 0.518 |
| Spigota | -0.272 | 0.009 |
| Femoral implant distal thicknessa | 0.137 | 0.199 |
| Medial tibial joint line change (MTJLC)a | 0.098 | 0.360 |
| Medial femoral joint line change (MFJLC) | 0.300 | 0.004 |
| Simulated medial tibial joint line change (sMTJLC) | 0.020 | 0.852 |
| Simulated medial femoral joint line change (sMFJLC) | 0.300 | 0.004 |
| Pre-OP HKAA | -0.375 | <0.001 |
| Post-OP HKAA | 0.293 | 0.005 |
| Pre-OP LDFA | -0.003 | 0.980 |
| Post-OP LDFA | -0.251 | 0.017 |
| LDFA change | -0.252 | 0.016 |
| Pre-OP MPTA | -0.024 | 0.822 |
| Post-OP MPTA | -0.075 | 0.483 |
| MPTA change | -0.044 | 0.679 |
BMI, Body Mass Index; HKAA, Hip-Knee-Ankle Angle; LDFA, Lateral Distal Femoral Angle; MPTA, Medial Proximal Tibial Angle.
In this study, changes in the medial tibial and femoral joint lines, implant size, and tibial resection thickness were not significant factors for the postoperative Hip Knee Ankle Angle (HKAA). However, both preoperative mechanical Lateral Distal Femoral Angle (LDFA) and Mechanical Medial Proximal Tibial Angle (MPTA) correlated with postoperative HKAA. Additionally, spigot size, medial femoral joint line change, and LDFA change were identified as factors correlated with HKAA change.
The joint line represents the physiological status of an individual knee. Malposition of the knee joint line during arthroplasty can result in instability, decreased range of motion, and altered stress in other knee compartments [18]. Finite element models on mobile-bearing UKA have shown that contact stress in the insert and lateral articular cartilage was sensitive to changes in the joint line [22]. Furthermore, Takayama K et al. reported that medial tibial joint line elevation over 5 mm could restrict knee extension and may cause postoperative flexion contracture [23].
The hypothesis that medial tibial joint line elevation correlated with postoperative coronal limb alignment, potentially leading to valgus alignment, was disproven by the present results. It was assumed that MCL tension was the most important factor, as the flexion-extension gap and joint stability after UKA were primarily affected by the MCL. If the tibial joint line was elevated by the implant, femoral milling must be adjusted to achieve optimal MCL tension, thereby keeping the postoperative HKAA within the patient's neutral knee condition. In some cases, a 0.5 mm increment of spigot was used, though not in an officially proven way, to attain optimal gap balance. The overall dislocation rate was 1.1% in the limited case series, which is satisfactory compared to the average 2.4% in the East Asian population who have a higher prevalence of dislocation [24].
Lower limb coronal alignment has been found to be a more determining factor for UKA outcomes than implant component alignments [6]. In terms of mobile-bearing UKA, Kim KT et al. reported that a postoperative femorotibial angle of 4 to 6 degrees of valgus had the highest survival rate [25]. In previous studies, Kuwashima et al. concluded that femorotibial angle change and medial joint line elevation of the tibia (MJLET) had a significant correlation [11]. Kuroda et al. reported that a 5.0° change in HKAA was moderately correlated with an MJLET of 4.4 mm [12]. The results differed from the present study; however, the measurement methods for joint line elevation varied. In Kuwashima's study,[11] the measurement was based solely on radiographic findings, which could be affected by image quality, angular projection, and measurement bias. In Kuroda's study,[12] although intraoperative bony resection thickness was measured as in this study, they did not specify which part of the resected bone was measured, leading to potential measurement bias. In these cases, the authors measured the anteromedial part of the tibia, where full-thickness cartilage wear was noted.
The differences in joint line change measurements, and the fact that the studies by Kuroda and Kuwashima were conducted on fixed-bearing UKAs,[11,12] were noteworthy. While both procedures resurface the damaged compartment, mobile-bearing UKA and fixed-bearing UKA have different traits. Inoue A et al. found that the femorotibial angle changed differently between the two UKA systems, with MCL tension being a determining factor [26]. In mobile-bearing UKA, adequate MCL tension and integrity are essential to provide knee stability and prevent insert dislocation. Using the Oxford knee instrument, incremental milling of the femur could be made to meet the optimal MCL tension and gap balance. However, the fixed-bearing design uses cutting jigs and saw blades for bony resection, which could make it difficult to make accurate adjustments for gap balance.
In this study, the medial tibial joint line elevated by approximately 2.3±0.68 mm, which was less than previously reported [11,12]. However, when accounting for healthy cartilage thickness, the simulated medial tibial joint line was only about 0.9±0.72 mm. Thus, the medial tibial joint line was reconstructed to within less than 1 mm deviation from the simulated healthy knee condition. Additionally, femoral resection in OUKA was performed by milling, allowing surgeons to adjust the depth of femoral milling in a more controlled way. It was found that spigot size, LDFA change, and femoral joint line change all correlated with HKAA change. These findings suggested that the major change in HKAA in OUKA originated from the femoral side rather than the tibial side in this limited case series, contrary to previous studies where tibial joint line change correlated with HKAA change [11,12].
In this series, the only factor that had a strong correlation with postoperative HKAA was preoperative HKAA (r = 0.777, p < 0.001), suggesting that inherent individual deformity largely determined postoperative alignment. Mullaji AB et al. reported that only preoperative HKAA was predictive of postoperative HKAA [27]. Since UKA mainly involves resurfacing, it was reasonable that more severe preoperative varus deformities tended to remain in varus alignment postoperatively. Additionally, LDFA and MPTA were found to correlate mildly to moderately with postoperative HKAA, with LDFA showing a negative correlation. LDFA and MPTA reflected individual bony morphology; smaller LDFA and larger MPTA biomechanically led to more valgus alignment. In this study, the preoperative LDFA and MPTA were both within normal ranges, but the LDFA of 89.0° was closer to the upper limit, while the MPTA of 85.6° was closer to the lower limit, indicating a preoperative imbalance [15]. Postoperatively, the MPTA and LDFA were 86.6° and 86.7°, respectively, suggesting that the imbalance and malalignment from cartilage wear were greatly reduced by bony resection and implant thickness. Zhang Q et al. also revealed that preoperative smaller LDFA, larger MPTA, and less medial tibial cut thickness were associated with postoperative valgus deformity with HKAA > 180° in mobile-bearing UKA [28]. Although similar findings were noted in this study, a comparison of the patients into postoperative valgus versus non-valgus groups was not performed, as only twelve of the patients had postoperative HKAA greater than 180°, with an average of 182.0°, representing only a small population.
There were limitations to this study. It was a non-randomized retrospective study with a relatively small sample size. Preoperative functional outcomes of the patients were not presented due to incompleteness. However, all patients underwent comprehensive preoperative studies to confirm isolated compartmental damage with full-thickness cartilage wear. Although the short-term outcomes were favorable, long-term outcomes may differ, and further follow-up is needed. Moreover, while a simulated healthy joint line was proposed through MRI measurements of cartilage thickness, there could still be significant variance. The most accurate method would involve using a three-dimensional analysis model, but this was too costly for routine use, and currently, no available model can simulate the entire healthy knee cartilage from a damaged medial compartment.
ConclusionThe medial joint line change, the thickness of tibial resection, and the tibial implant had no correlation with postoperative hip knee ankle angle in Oxford UKA. The only factor of positive strong correlation with postoperative HKAA was preoperative HKAA; while preoperative smaller LDFA and larger MPTA also had moderate correlation with postoperative HKAA. With regard to the HKAA change, femoral joint line change and LDFA change had a weak to moderate correlation.
Not applicable