


Currently, the incidence of esophageal cancer continues to rise around the world. Because of its good early prognosis, it is of great significance to establish an effective model for predicting the survival of EC patients. The purpose of this study was to predict survival after diagnosis in Esophageal Cancer (EC) patients by constructing a valid clinical nomogram. In this study, 5037 EC patient samples diagnosed from 2010 to 2015 were screened by accessing the SEER database, and 8 independent prognostic factors were screened by various methods, and Cox multivariate regression was included to construct a prognostic model and nomogram for esophageal cancer. to estimate esophageal cancer recurrence and overall survival. Calibration of the nomogram predicted probabilities of 1-year, 3-year and 5-year survival probability, which were closely related to actual survival. In conclusion, this study validated that the column-line graphical model can be considered an individualized quantitative tool for predicting the prognosis of patients with EC in order to assist clinicians in making therapeutic decisions.
Esophageal Cancer (EC) is a major global health problem, and its incidence is increasing rapidly around the world.1,2 EC is a malignant tumor originating from the esophagus, which typically presents with progressive dysphagia.3,4 EC occurs mostly in middle-aged and elderly men, and its early treatment has a better prognosis and a higher 5-year survival rate after comprehensive treatment.5,6 A successful and accurate prognostic model for EC patients is therefore vital to their treatment, but a suitable model for predicting their survival is still lacking.
Currently, the gold standard for evaluating tumor prognosis is still the TNM classification.7,8 However, the TNM system has several disadvantages: Heterogeneity in disease stages is introduced by patients with similar TNM classifications, but different survival outcomes;9,10 the TNM classification cannot treat tumors, lymph nodes, or metastases as a continuous variable, and generally, if the TNM classification is too high, the prognosis will be worse.11,12 TNM does not incorporate variables other than genetics, mitotic rate, and histology that affect prognosis, resulting in poor outcomes in general.13,14 In addition, the American Joint Committee on Cancer (AJCC) seventh edition (2010) is widely used in the prognosis evaluation and clinical treatment of embassy cancer patients.15 However, due to the lack of demographic data, the application of this system is limited.16,17 Given the limitations of the TNM classification and the AJCC cancer staging manual, nomograms serve as a simpler and more advanced approach to assessing individual risk based on patient and disease characteristics. A nomogram is a visualization of a complex statistical model. In this method, multiple predictors are integrated, and then scaled line segments are drawn on the same plane according to a certain proportion as part of the regression analysis.18,19 The fundamental concept behind the nomogram involves developing a multivariate regression model, which includes widely used models like Cox regression and Logistic regression. Scores are assigned to each value level of the influencing factors in the model, based on their impact on the outcome variable (the magnitude of the regression coefficient), and summed up to calculate an overall score. Ultimately, the forecasted value of a specific outcome event is determined by the functional transformation linking the overall score to the likelihood of that event occurring. Every variable is individually enumerated, with each sub-variable being quantified into distinct points. Subsequently, the aggregate scores (Total points) of each variable are compared with the outcome scale to derive the forecasted probabilities.
Oncology can benefit from the nomogram in many ways: preoperative nomogram can assess surgical margins and risk of lymph node metastasis to help clinicians identify those who may benefit more from a larger surgery benefit patients.20,21 In short, nomograms may assist patients and physicians in making decisions about estimating tumor recurrence, tumor-specific survival, overall survival, benefit of adjuvant therapy, and treatment impact on quality of life.22-24 Therefore, this paper used Cox multivariate regression and nomogram to construct a prognostic model of EC.
Materials selection and methodsThis study received an access research license from the Surveillance, Epidemiology and End Results (SEER) database. According to clinical consensus, demographic characteristics (including age, gender, race) and clinicopathological factors involving tumor size, tumor grade, tumor stage (Summary stage, AJCC Stage), tumor size and regional lymph node involvement, and distant metastasis were analyzed as influencing factors.25-30 The sample data of 7246 EC patients from 2004 to 2015 were determined by the software SEER*Stat 8.4.0.1. In this study, the AJCC staging criteria (Derived AJCC Stage Group, 7th ed.) were used to classify EC patients according to different stages, excluding samples with unknown diagnosis, multiple occurrences, unknown gender and empty Derived AJCC Stage Group. Since the seventh edition of the AJCC standard was released in 2010, a total of 5049 samples were screened from 2010 to 2015, and the data with NA was filtered out, leaving 5037 samples in the end. To reduce the possible bias caused by the dataset from only one data center, multi-center or national databases were used, so this paper intended to include the clinical information of EC patients in the 2010‒2015 TCGA database for external validation. However, for the information on EC patients, the data range on TCGA was only up to 2013, and the data volume was only 180 rows. In order to ensure the integrity of the data set, this study used the bootstrap sampling method, and the esophageal patient samples obtained from the SEER database were trained according to the training method. The ratio of set to validation set sample size was 7:3 and allocated to the training cohort and the internal validation cohort. This study follows the STROBE statement.
R 4.0 was used for survival analysis, python 3.8 was used for data processing and univariate analysis, as well as three methods were used to screen variables. Initially, the univariate Cox model set a threshold of p < 0.01 for screening variables. Subsequently, a comprehensive subset regression analysis was employed to modify the peak value of R2, aiming to identify the optimal variable mix. Ultimately, Lasso regression combined with cross-validation was applied to identify the pairing of variables with the respective λ value at the point where the Mean Square Error (MSE) was at its lowest. In the multivariate Cox regression, the variables evaluated by the trio of methods were incorporated, followed by a stepwise backward regression to identify those with the lowest AIC value that the three methods ultimately screened. Models developed using these three techniques rely on the ROC curve, selecting the one with the highest AUC for the nomogram's construction. Ultimately, to confirm the model's calibration, the calibration curve's C-index was established, and Decision Curve Analysis (DCA) assessed the nomogram's clinical applicability.
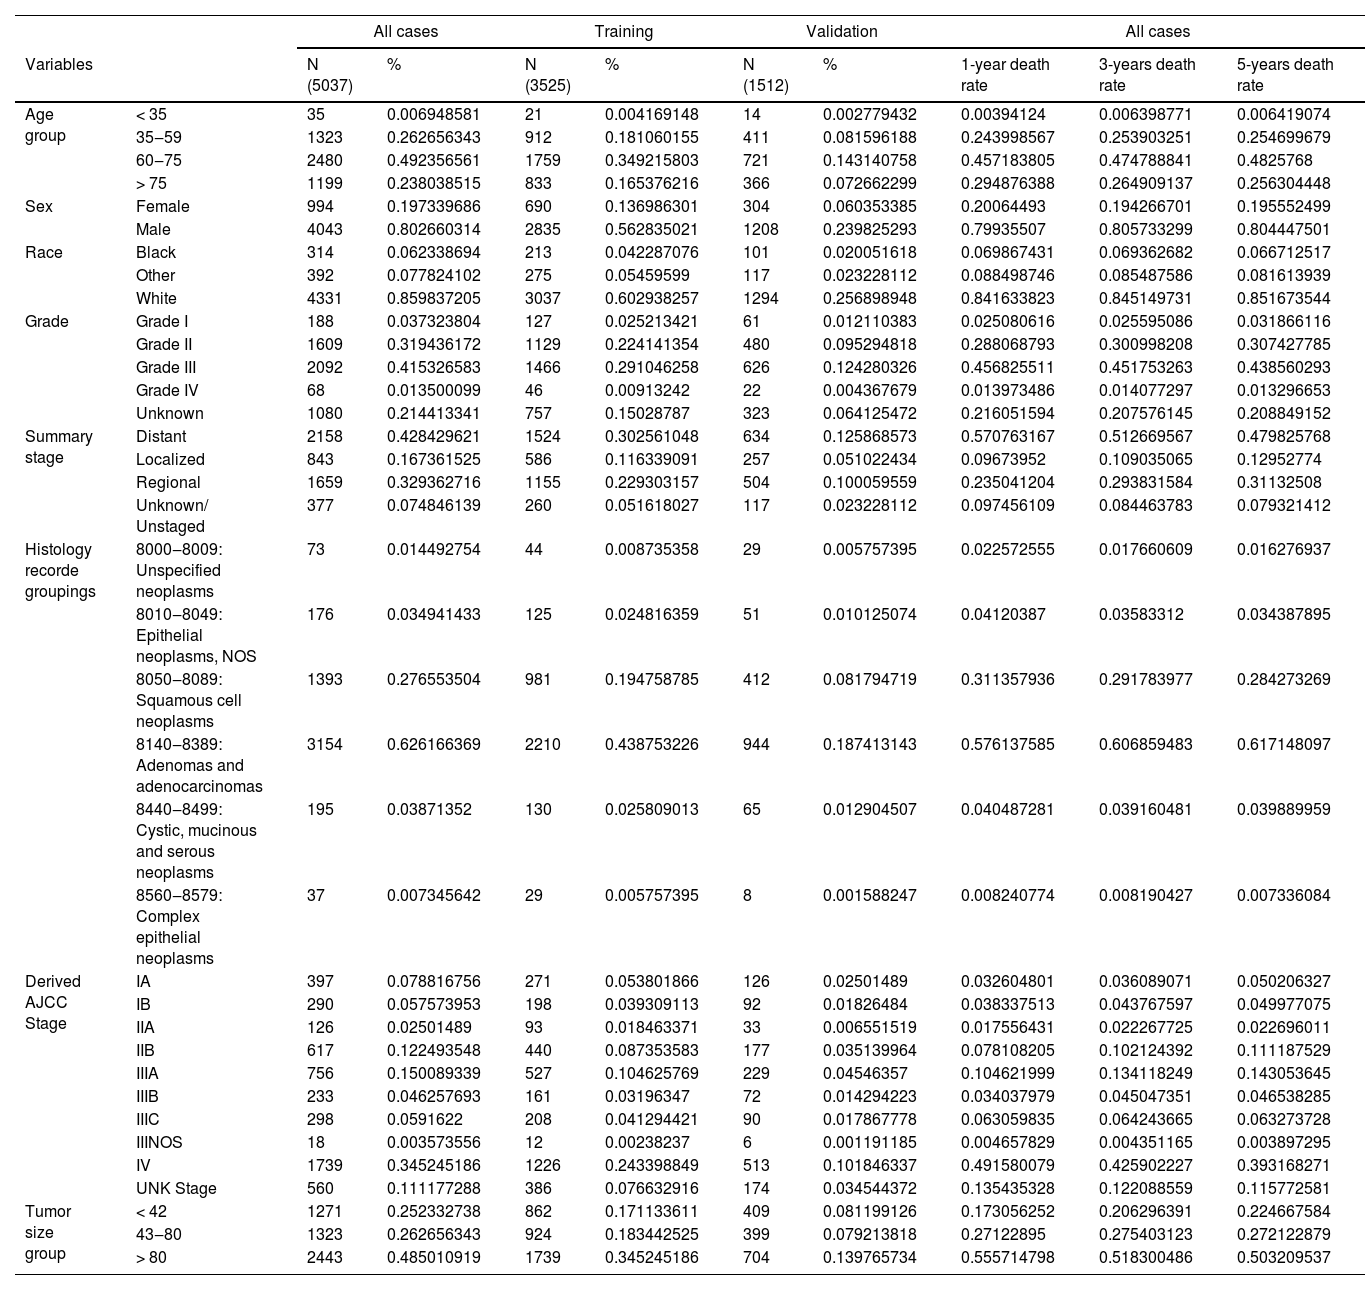
ResultsPatients’ characteristicsA total of 5037 EC samples diagnosed in 2010‒2015 were included, of which 3525 were assigned to the training set and 1512 to the validation set. In the entire cohort, the 1-year, 3-year, and 5-year EC-specific mortality rates were 55.3 %, 77.5 %, and 86.6 %, respectively. The demographic and tumor characteristics of the patients are shown in Table 1. Particularly, age, sex, and race, corresponding to age, sex, and race in the demographic characteristics, respectively; Derived_AJCC_Stage, Summary_stage, Histology_record_groupings, grade, tumor_size_group, respectively correspond to the tumor stage (Summary stage, AJCC Stage), regional lymph node involvement, and distant metastasis, tumor grade and tumor size in clinicopathological factors.
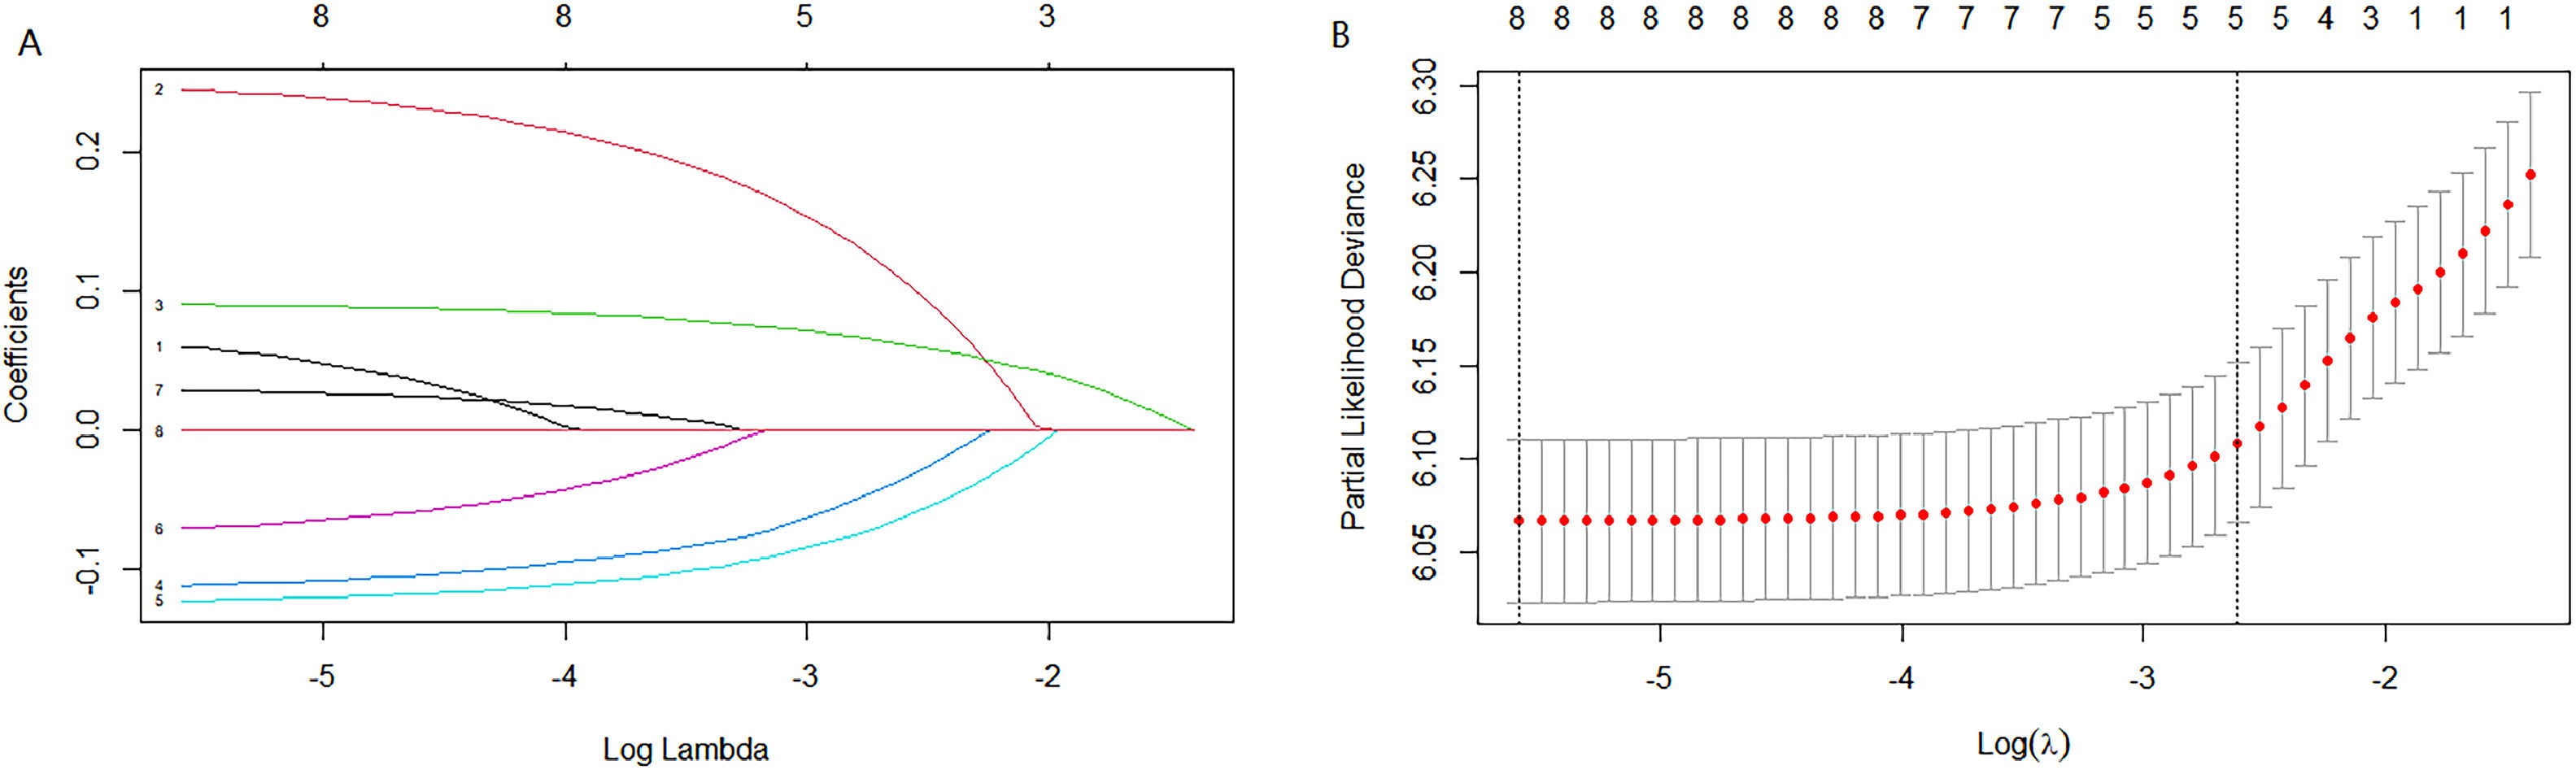
Demographics and tumor characteristics of EC patients.
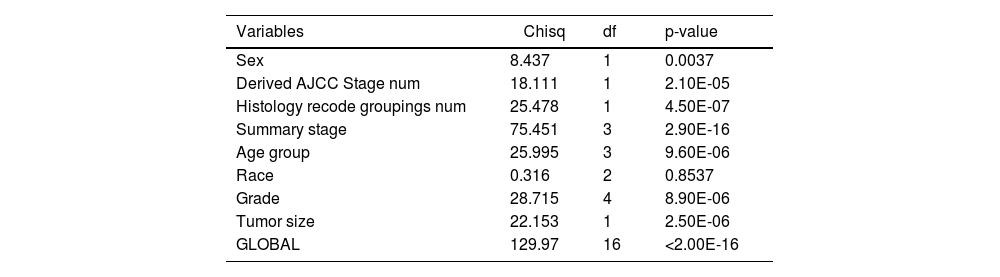
Cox univariate analysis was used to screen for variables with p < 0.01. Based on the univariate regression results, A multivariate Cox regression model was built based on variables with significant differences, and then variables with significant differences were included in the model. Backward stepwise regression was used, starting with all 8 predictors and performing backward regressions, removing one variable at a time, until it degraded the quality of the model. Excluding the feature variable with p-value > 0.01 and the largest each time, the p-value of each variable in the above model was obtained, as shown in Table 2. According to the p-value in Table 2, excluding race, the authors gathered 7 variables. Subsequently, LASSO regression and cross-validation were used to screen variables, which were used to improve the effect of model fitting and solve the problem of overfitting caused by multicollinearity. In LASSO regression, variables were selected and regularized while fitting a generalized linear model. Thus, LASSO regression can be applied to models and predictions regardless of whether the target variable is continuous, binary, or multivariate discrete, as shown in Fig. 1. A is a plot of lambda and regression coefficients when variables are selected. B uses cross-validation to determine the optimal λ value, which plots the cross-validation curve (red dotted line) and the λ series (error bars) along the upper and lower standard deviation curves. The two special value λ sequences along the line are represented by vertical dashed lines. A value of lambda.min indicates that a maximum cross-validation error has been achieved, while lambda.1se indicates the most regularized model with the least cross-validation error. According to the results in Fig. 1, lambda min gave 8 variables, lambda.1se also gave 8 variables, and it was determined to use 8 variables to build the model. Meantime, in order to overcome the controversy that the stepwise regression method cannot guarantee that the obtained model is the best model, this study adopted the best subsets regression (Best Subsets Regression, BSR), Adjr2 (adjusted R²) to judge the pros and cons of the model, and the model with the largest R² value was used in this study. The model constructed by the combination of variables was optimal. As shown in Fig. 2, 8 variables were included for model building. So far, univariate Cox regression has screened 7 variables with p < 0.01: age + gender + Derived_AJCC_Stage + Summary_stage + Histology_recode_groupings + grade + tumor_size_group; Optimal subset regression has screened 8 variables according to the adjusted R² maximum value: age + gender + race + Derived_AJCC_Stage + Summary_stage + Histology_recode_groupings + grade + tumor_size_group; LASSO regression + cross-validation using tuning coefficient = lambda.1se gave a model with good performance, and also gave a model with 8 variables: age + gender + race + Derived_AJCC_Stage + Summary_stage + Histology_recode_groupings + grade + tumor_size_group. It was found that based on the research results, the variables screened by optimal set regression and LASSO regression were the same. The variable combinations screened by the three methods were included in the multi-factor Cox model respectively, and the final model of the three methods was determined with the minimum AIC value using the stepwise backward regression method. Finally, draw three final model ROC curves and evaluate the best model with AUC value.
 is a graph of lambda and regression coefficients when using LASSO regression + cross-validation to select variables; (B) is a graph of using cross-validation to determine the best lambda, when the mean square error MSE is the smallest, lambda is less than -5.")

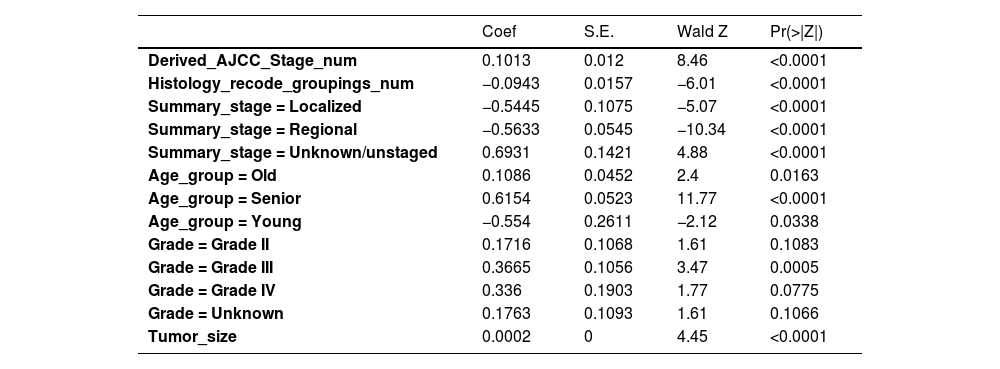
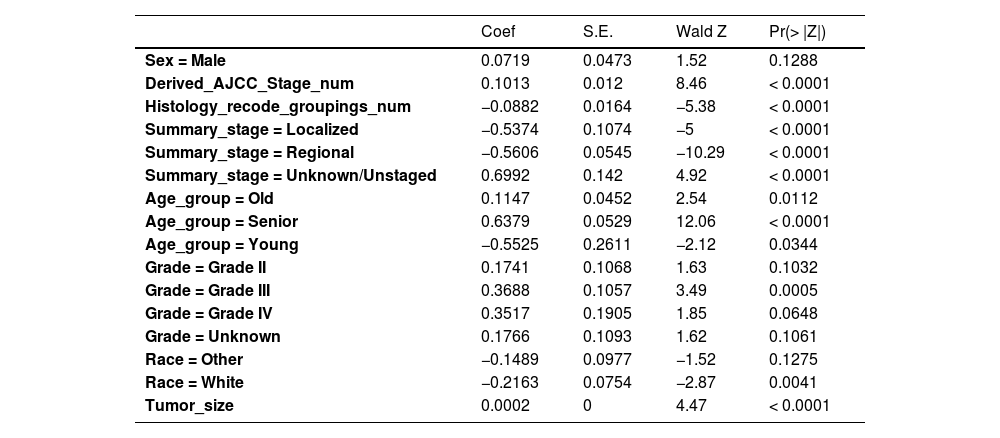
Firstly, the variables screened by univariate cox were subjected to multi-factor Cox, and after the stepwise backward regression method, 6 characteristic variables were finally left, as shown in Table 3. The calculated AIC value was 43695.41. The variables screened by full Subset Regression (BSR) and LASSO regression were respectively subjected to Cox, and there were still 8 characteristic variables left in the stepwise backward regression method, as shown in Table 4. The AIC values were both 43691.46.
Variables selection for Cox by backward elimination.
Variables selection for BSR/LASSO by backward elimination.
In the multivariate models of the above three methods, only the variables selected by the single factor Cox were eliminated. Considering the principle that data fitting was encouraged but overfitting should be avoided as much as possible, a model with a smaller AIC value (BSR/LASSO) should be selected, that is, a combination of 8 characteristic variables.
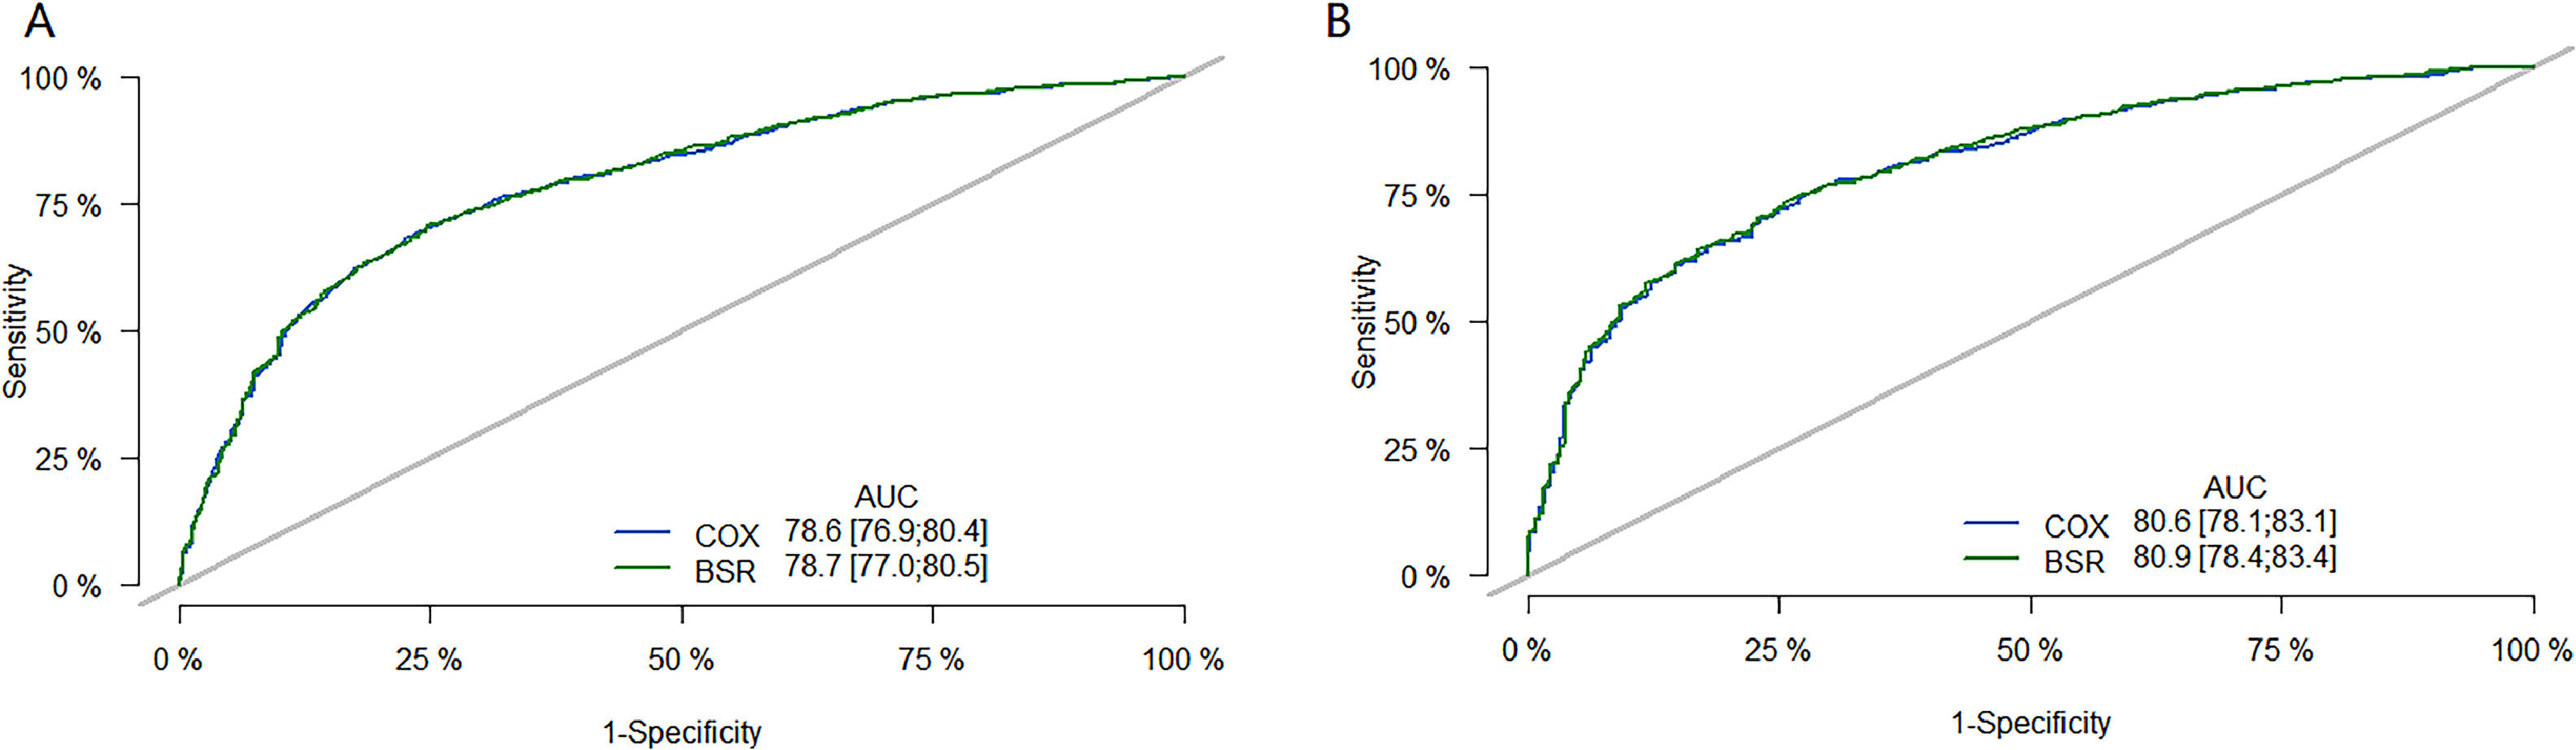
The performance of the model was then evaluated using ROC plots. Fig. 3 is the long-term (36 month) ROC curve of the model; A was the ROC curve of the model on the training set; B was the ROC curve of the model on the validation set. By comparing the AUC size, it was found that the BSR/LASSO model performs better in both datasets.
 is the ROC curve of the model on the training set; (B) is the ROC curve of the model on the validation set. The green curve is the ROC curve of the BSR/LASSO model, and the gray is the ROC curve of the Cox single factor. The BSR/LASSO model performed better in both datasets (78.7 > 78.6; 80.9 > 80.6).")
36-month ROC curve of models. (A) is the ROC curve of the model on the training set; (B) is the ROC curve of the model on the validation set. The green curve is the ROC curve of the BSR/LASSO model, and the gray is the ROC curve of the Cox single factor. The BSR/LASSO model performed better in both datasets (78.7 > 78.6; 80.9 > 80.6).
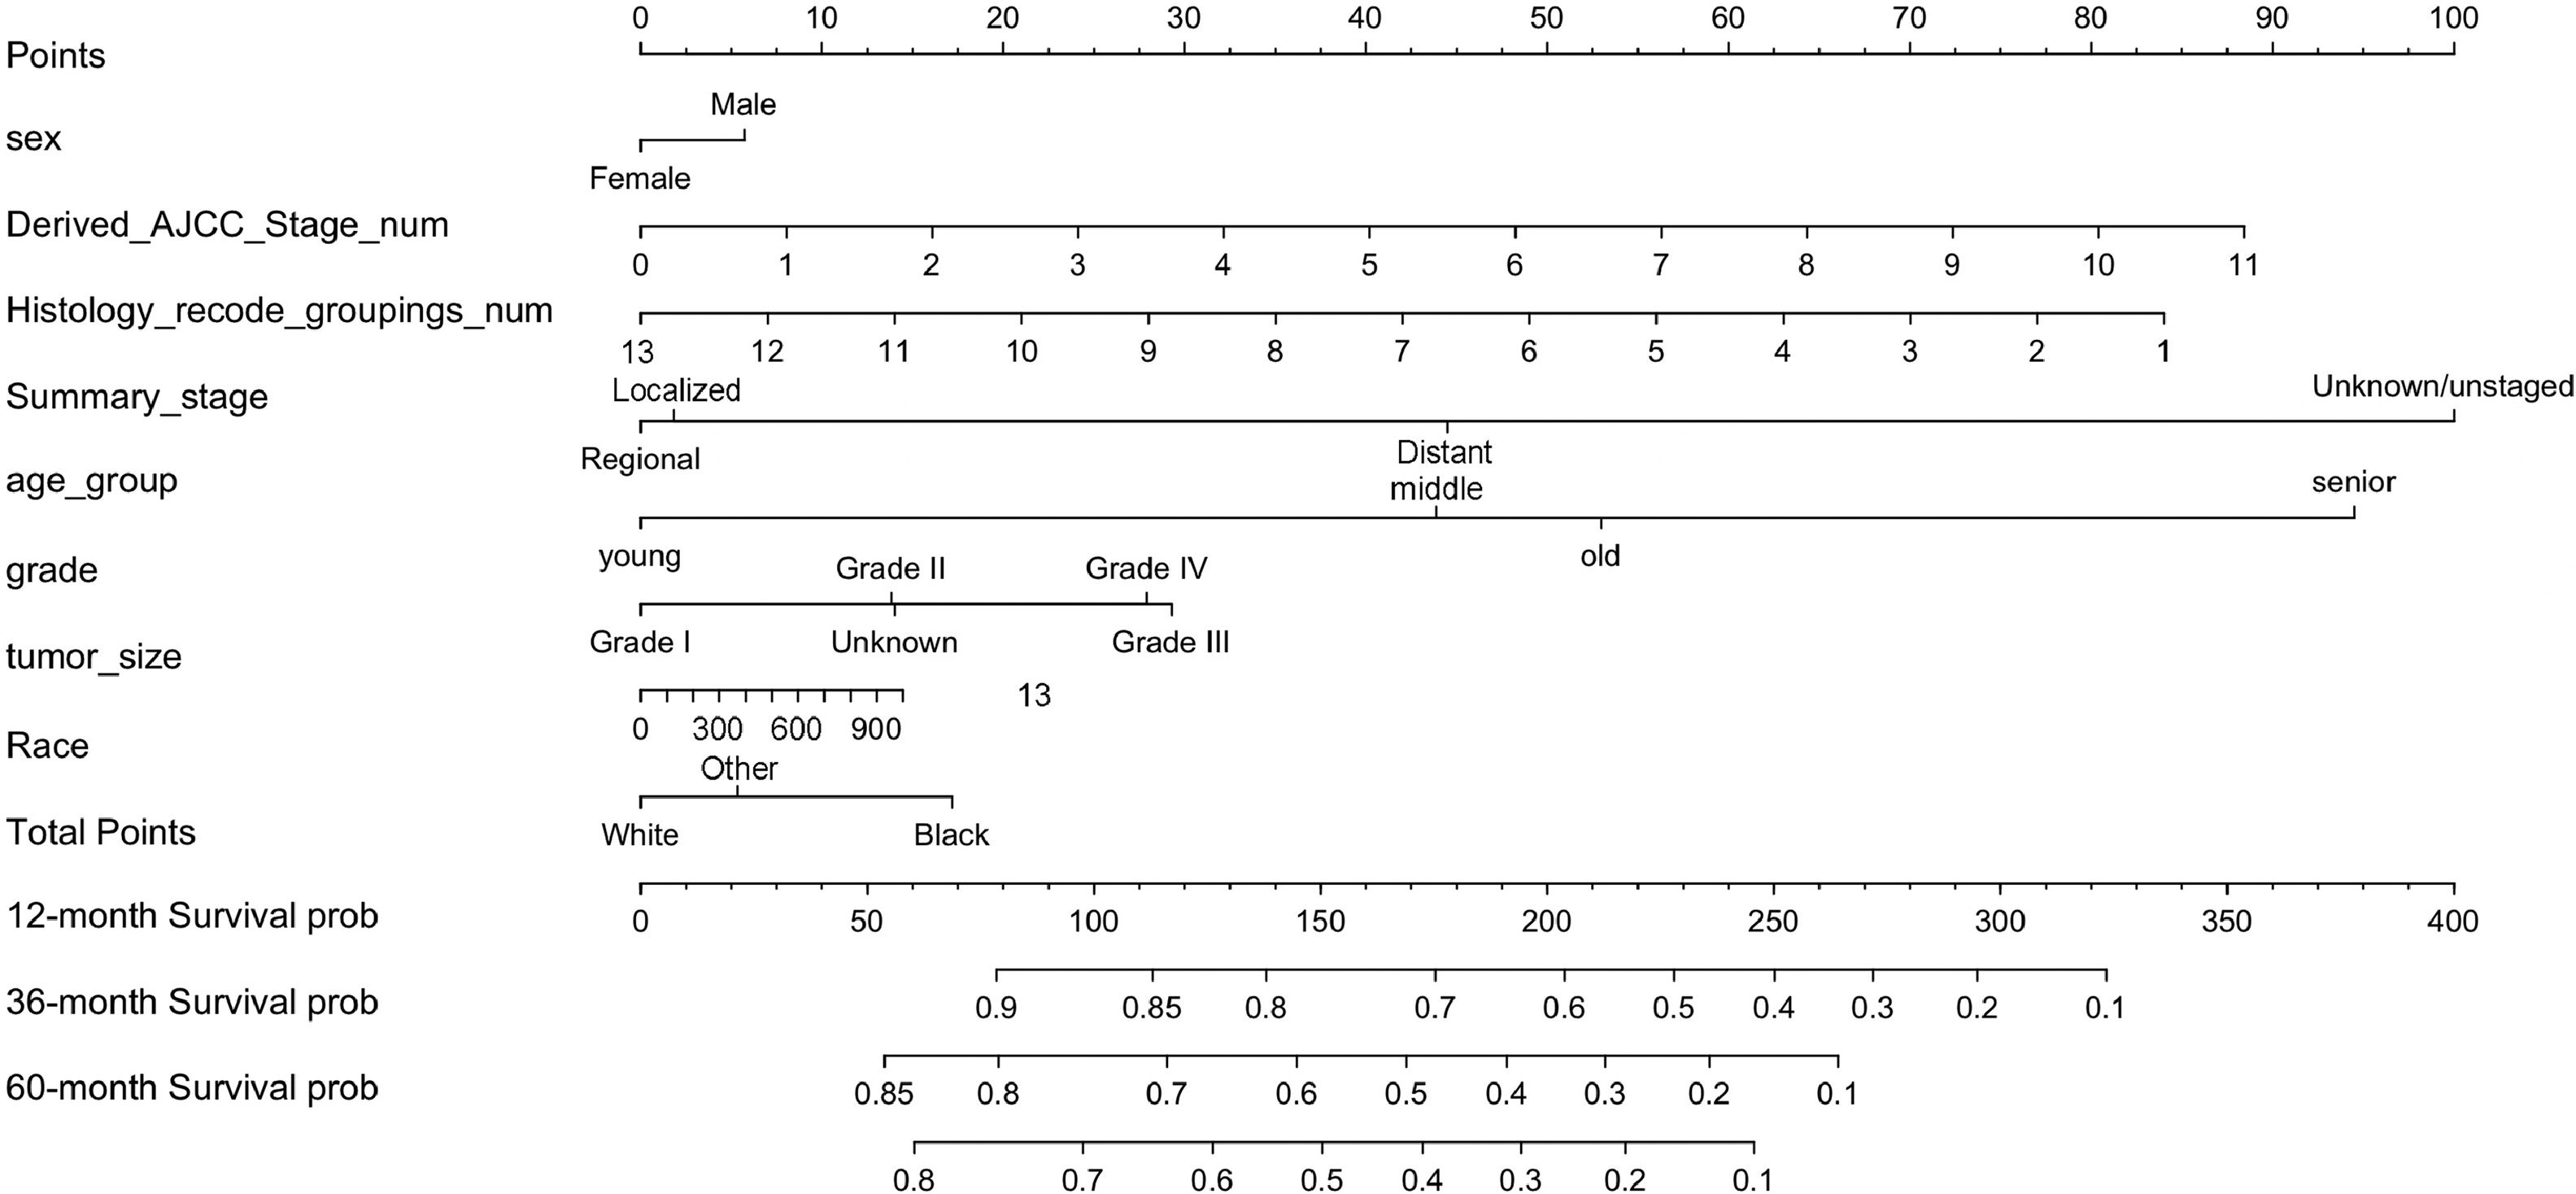
In summary, eight variables were used as independent prognostic factors for EC, and a nomogram was constructed according to the prediction model, see Fig. 4. As can be seen from the figure, the tumor stage (Summary_Stage, Derived_AJCC_Stage_num) had the greatest impact on prognosis. It is undeniable that the AJCC cancer staging manual is still very important for predicting the survival of EC patients and guiding treatment. However, other social and demographic information and clinicopathological features should not be ignored, such as regional lymph node involvement, and distant metastasis, which have an impact on EC prognosis second only to tumor staging. The regional lymph node is closely related to tumor staging and is also malignant. The most common and most easily metastatic site of tumors, the enlargement or metastasis of regional lymph nodes indicates the prognosis of the tumor and also serves as a guide for the selection of surgical procedures.31 In addition, the number of lymph node metastases also guides the choice of chemotherapy regimens after surgery.32 It is recommended that patients with EC undergo periodic regional lymphatic examinations.

The Nomogram of EC patients. Points represents the single item score corresponding to each variable under different values, and Total Point represents the total score of the sum of the corresponding single item scores after all variable values. 12-month Survival probability, 24-month Survival prob, 36-month Survival prob represent 1-year, 3-year and 5-year survival probability, respectively. Each Total Points corresponds to 1-year, 3-year and 5-year survival rates.
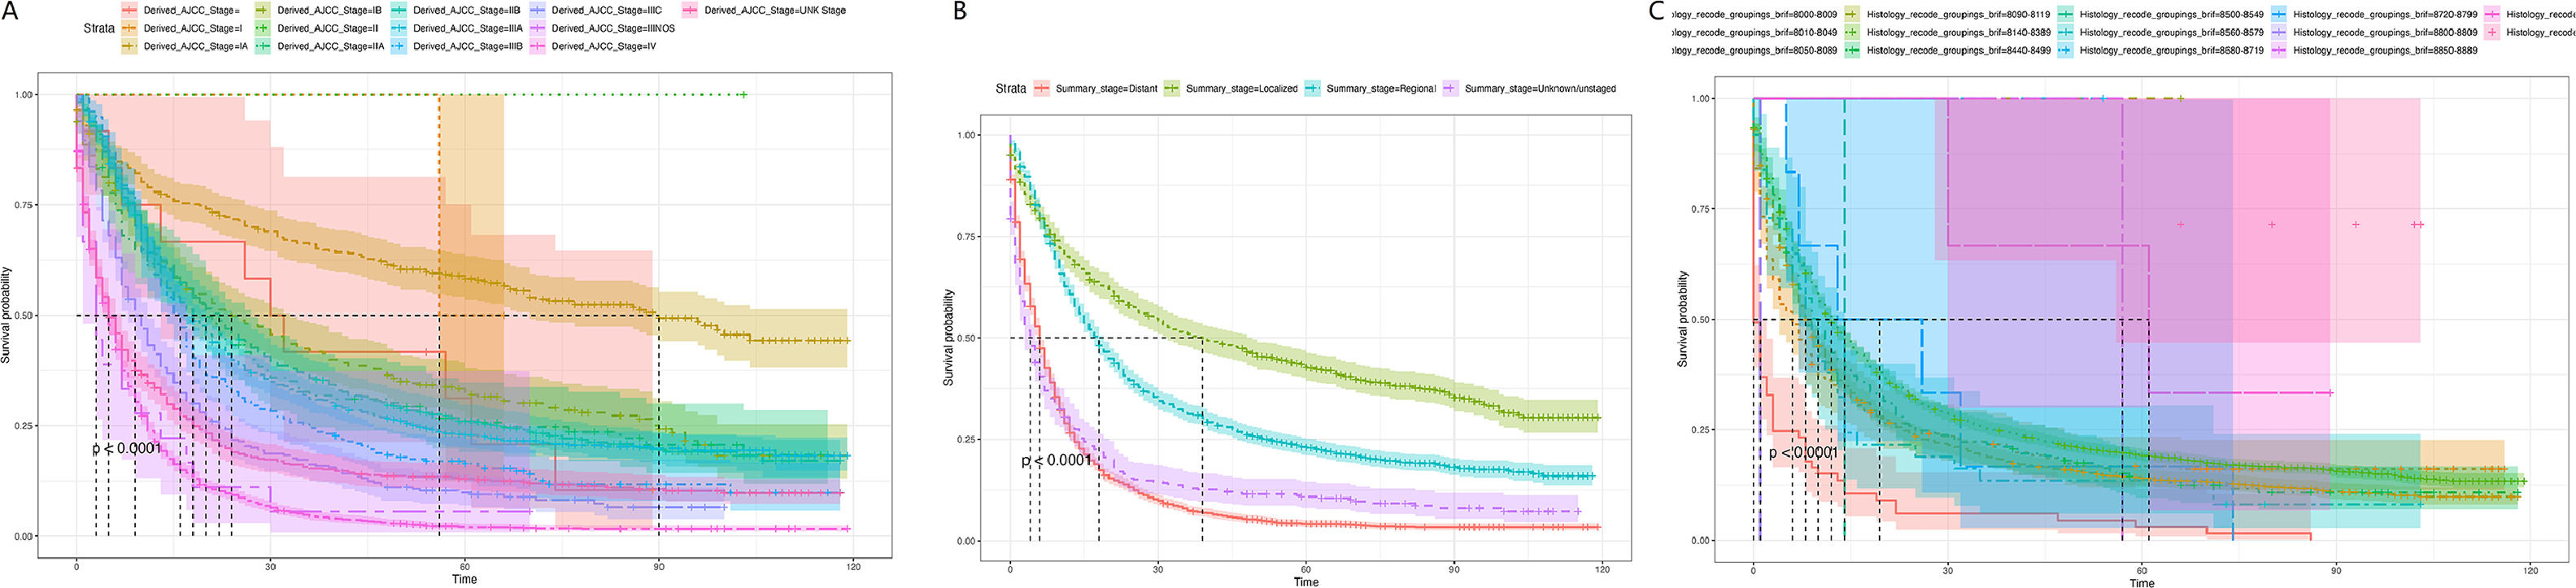
Subsequently, the effects of tumor stage and regional lymph node involvement, and distant metastasis on patient survival were examined by Kaplan-Meier survival curves, as shown in Fig. 5. The results were consistent with the nomogram predictions. A is the Kaplan-Meier survival curve of EC patients at each stage in the AJCC stage; B is the Kaplan-Meier survival curve of EC patients at each stage in the Summary Stage; C is the different regional lymph node involvement, and distant metastasis Corresponding Kaplan-Meier survival curves for EC patients. Both A and B indicated that EC patients in the earliest stage had the highest survival rate; C revealed that lymph node metastasis patients had a lower survival rate, while distant metastasis patients had the lowest survival rate.
Verification of model performance
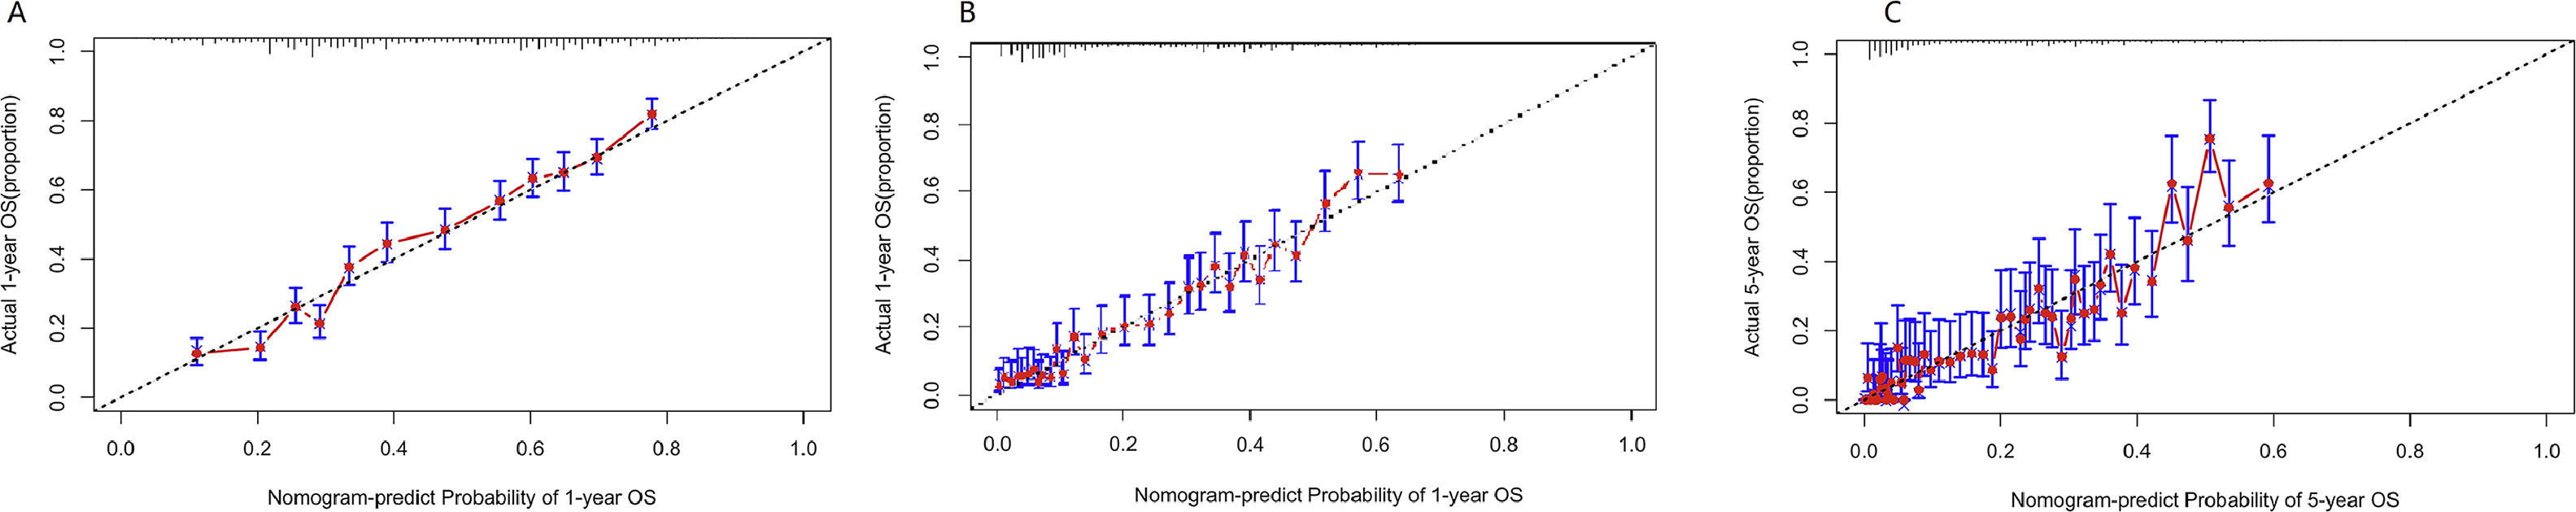
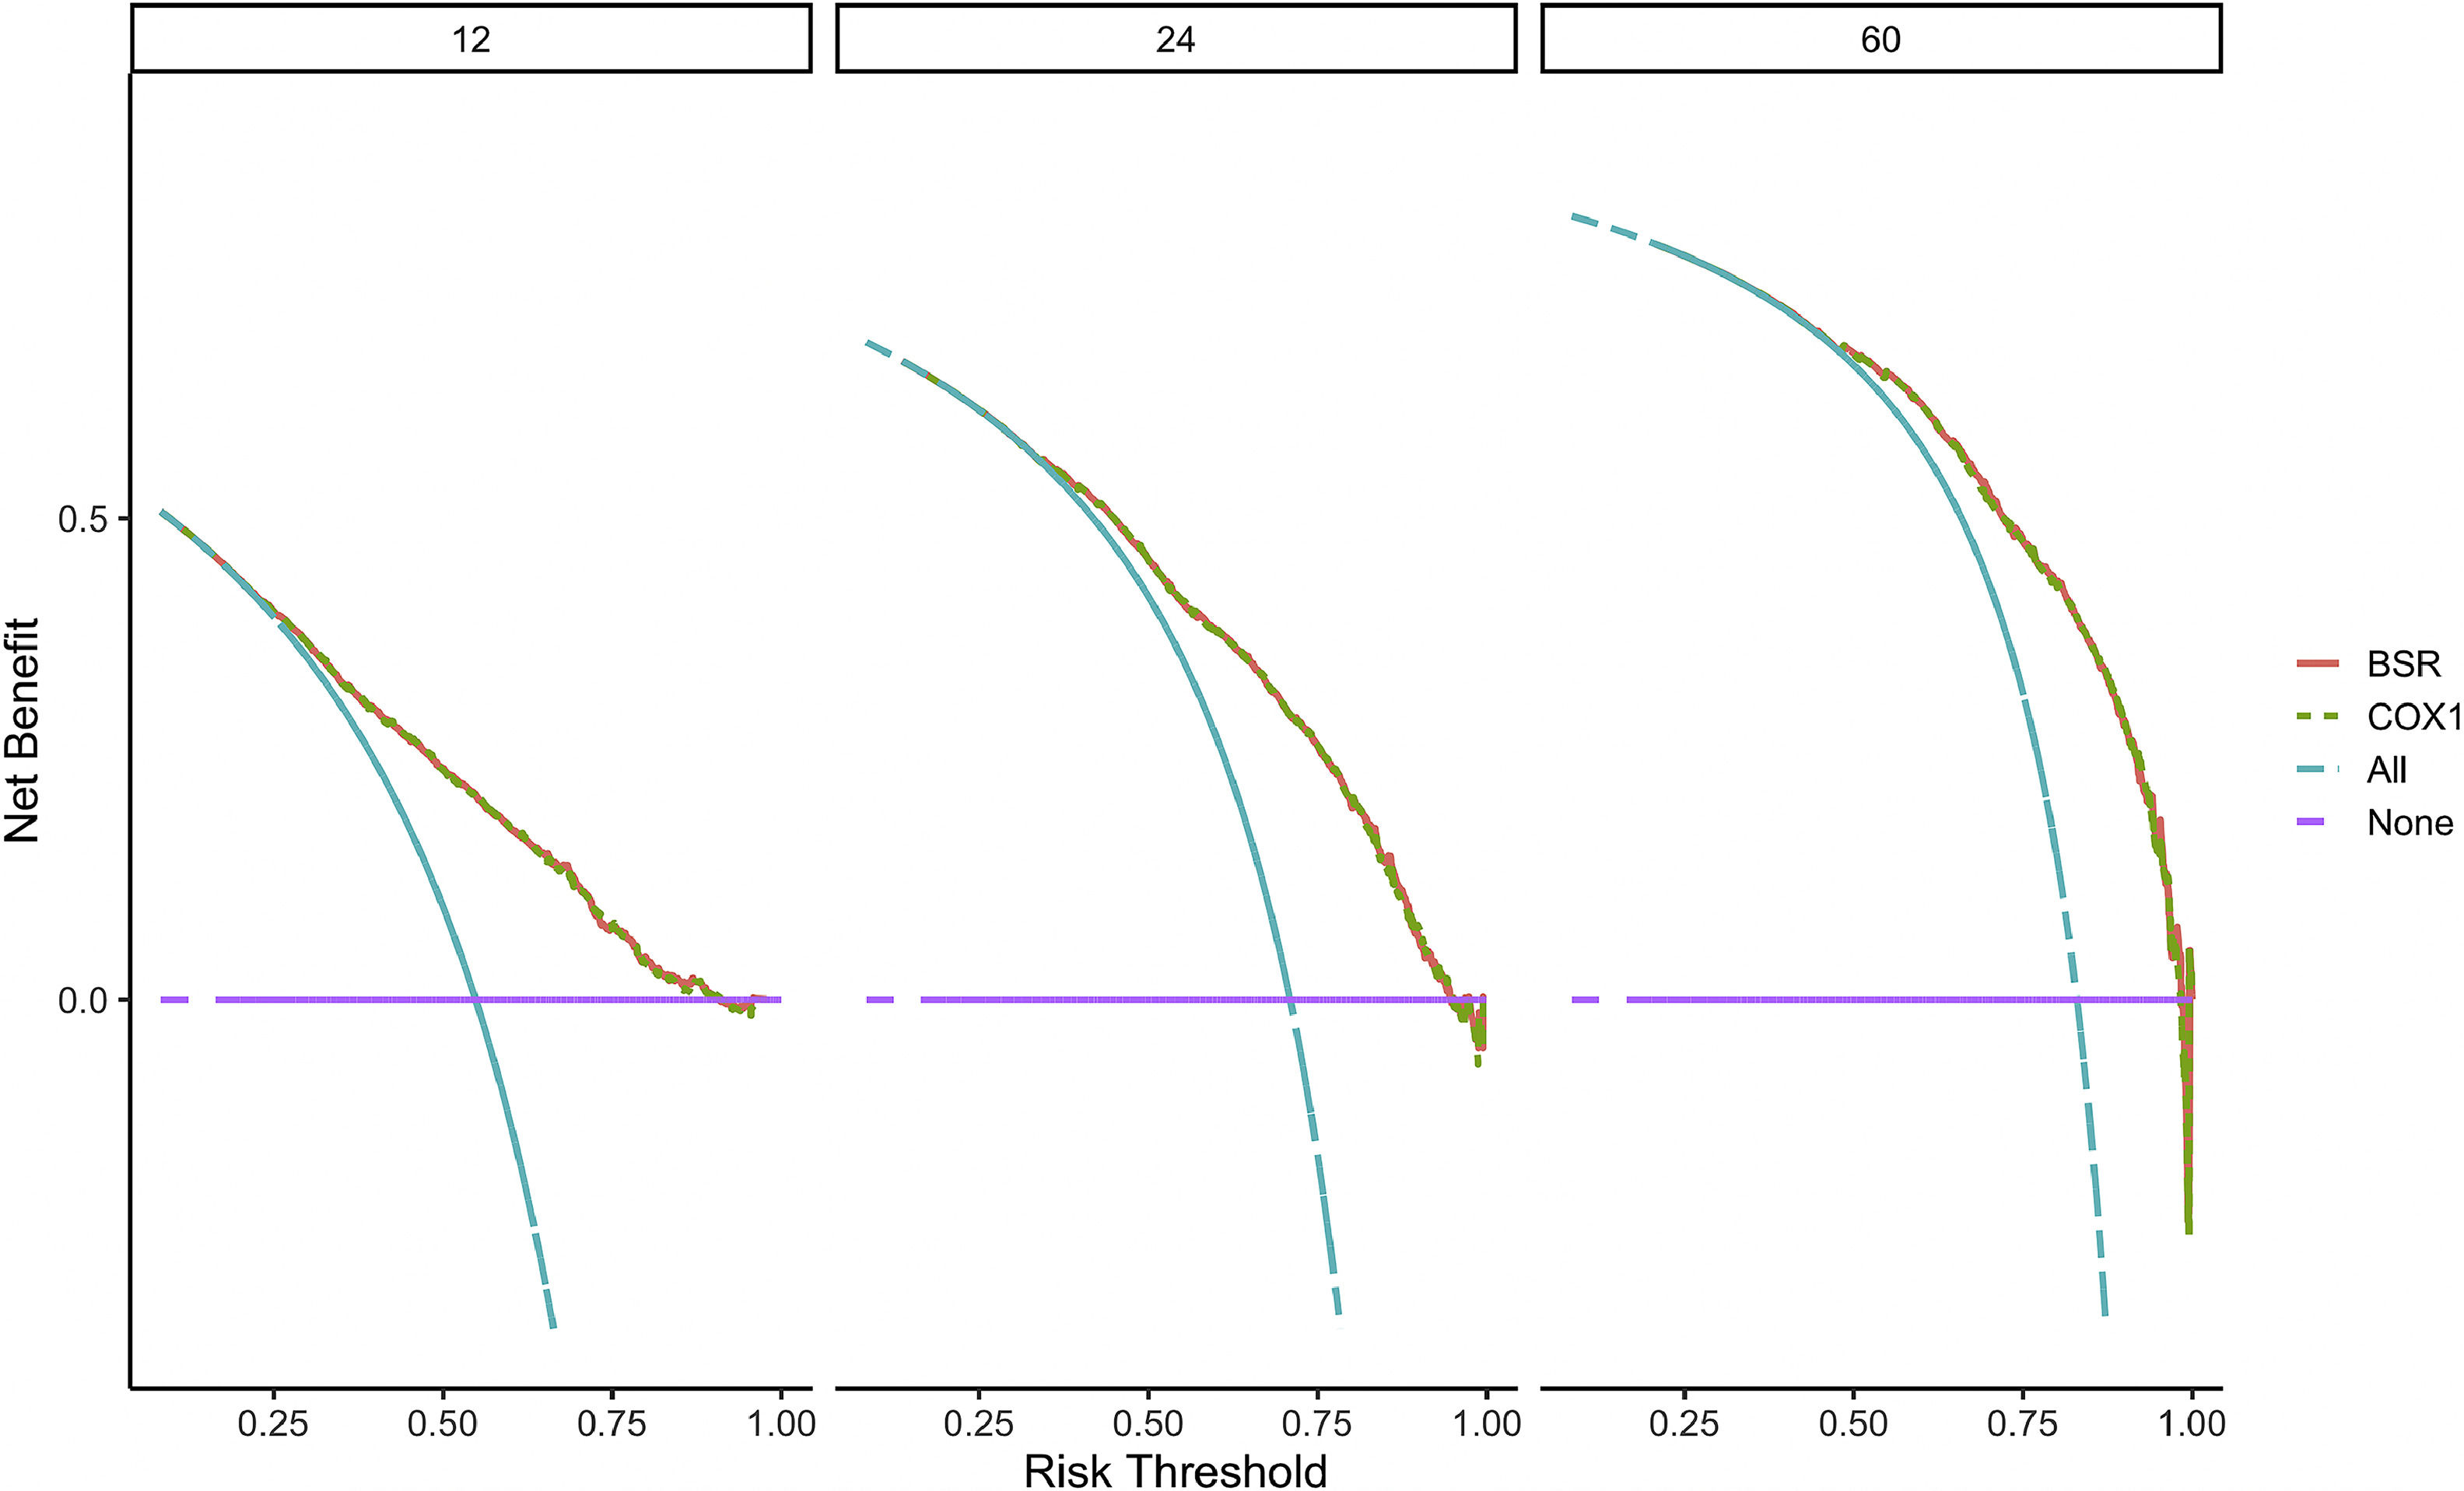
After the model was built, in order to evaluate the model and verify the difference between the survival rate predicted by the model and the actual, this paper drew the calibration curve of the model (Fig. 6). The effect of the prediction model was generally consistent with the actual survival situation, which further verified the distinguishing ability and calibration ability of the model. A, B, and C were calibration curves of the patient's 1-year, 3-year, and 5-year survival rates, respectively. The results showed that the model had a better prediction effect on the 1-year and 3-year survival rates of EC patients, and the 3-year effect was the best. Next, in order to evaluate the degree of patient benefit, a “threshold probability” was introduced using Decision Curve Analysis (DCA). Triggering medical intervention at the same threshold probability had high clinical utility. The decision analysis curve compares the net benefit of the intervention according to the model with the net benefit of the default approach (full and no intervention).33,34Fig. 7 shows the 12-month, 24-month and 60-month Monthly decision analysis of the same model. As shown in the figure, for the trained Model, if the model was intervened according to the prediction results of the Model, except for the case where the threshold probability was small, the performance of the model was relatively good in the rest of the threshold probability cases, and the 60-month the highest net benefit.
, and the vertical axis is the observed actual event rate (Observed risk) with a range of 0 to 1. The dotted line on the diagonal is the reference line, that is, the prediction result perfectly matches the real result, and the red line is the fitting line, that is, the prediction of the model. The closer the two are, the better the calibration of the model.")
Calibration curve of the nomogram. The horizontal axis is the predicted event rate (Predicted risk), and the vertical axis is the observed actual event rate (Observed risk) with a range of 0 to 1. The dotted line on the diagonal is the reference line, that is, the prediction result perfectly matches the real result, and the red line is the fitting line, that is, the prediction of the model. The closer the two are, the better the calibration of the model.
.")
DCA curve of the nomogram. The horizontal axis of the DCA curve is the threshold probability, and the vertical axis is the net benefit. As the threshold probability increased, the net benefit of the model decreased (more precisely, the net benefit of intervention based on the model results decreased).
In this study, a total of 5037 cases of EC patients with complete information were extracted from the SEER database, and differences in clinical and pathological factors affecting patient prognosis were explored. Subsequently, patients were randomly assigned to training and validation groups in a 7:3 ratio. Multiple independent risk factors were identified through multivariate and univariate analyses. These factors were further integrated into a nomogram to predict the 1-year, 3-year, and 5-year Overall Survival (OS) probabilities, and the high accuracy of this nomogram was demonstrated through internal and external validation. Compared to TNM staging, the 7th edition AJCC staging, and SEER staging, this nomogram showed superior survival prediction capabilities, providing guidance for prognosis assessment for EC patients in terms of individualized tumor-specific survival predictions.
As indicated by the nomogram model in this study, gender has a minor impact on EC, consistent with findings from Zeng et al.'s research.35 Tumor staging has the greatest impact on EC, with more severe differentiation leading to poorer prognosis. As SEER staging increases, tumors progress, survival time shortens, and prognosis worsens, aligning with the trends identified by the nomogram model. Undeniably, the AJCC Cancer Staging Manual remains crucial for predicting the survival and guiding treatment of EC patients. Other factors such as regional lymph node involvement and distant metastasis have an impact on EC prognosis second only to tumor staging. Regional lymph nodes are the most susceptible sites for tumor metastasis, and their enlargement or metastasis indicates the tumor's prognosis and guides the choice of surgical approach.36 The number of lymph node metastases also guides the selection of postoperative chemotherapy regimens.37 Therefore, regular regional lymph node examination is recommended for EC patients. Nevertheless, unilateral AJCC staging does not satisfactorily predict prognosis, especially in patients with similar staging, due to confounding factors affecting EC prognosis. Therefore, compared to TNM staging, column-line diagrams are a simpler and more visual tool for estimating risk based on patient characteristics and are widely used in oncology and medical prognosis.38
To ensure the model's performance, this study employed calibration and Decision Curve Analysis (DCA) curves to validate the predicted survival rates against actual outcomes and assess clinical utility. The results show that the predicted 1-year and 3-year survival rates of EC patients are consistent with the actual situation, but there is a certain gap in the 5-year survival rate. Decision analysis showed that the model yielded higher 5-year survival in EC patients. Besides, this study has some limitations. Firstly, in terms of data acquisition, there were no suitable multiple data sources for external validation. Secondly, ESCC and EAC are the two main histological subtypes of EC with significant differences in epidemiology, tumor characteristics and genetic features.39 Therefore, the performance of column line plots in the two subtypes must be evaluated separately in subsequent studies. The SEER database did not include comprehensive treatment records, excluding treatment methods from the scope of this study. Furthermore, this retrospective study based on the SEER database requires further validation through prospective cohort studies to obtain sufficient evidence to verify the research results.
Despite these limitations, commonly used metrics such as the C-index, AUC, and calibration curves demonstrate the high accuracy of the nomogram. Compared to traditional staging, DCA suggests that the nomogram has better practicality.
ConclusionIn summary, the nomogram model serves as an efficient individualized tool for predicting EC patient prognosis with better survival prediction ability, aiding clinicians in making informed treatment decisions.
Availability of data and materials
The datasets used and/or analyzed during the present study are available from the corresponding author upon reasonable request.
Ethics statementNot applicable. The present study did not require ethical board approval because it did not contain human or animal trials.
Authors’ contributionsXiying Cao designed the research study. Bingqun Wu and Shaoming Guo performed the research. Weixiang Zhong and Zuxiong Zhang provided help and advice on the experiments. Hui Li analyzed the data. Xiying Cao wrote the manuscript. Xiying Cao and Hui Li reviewed and edited the manuscript. All authors contributed to editorial changes in the manuscript. All authors read and approved the final manuscript.
FundingThe Doctoral Initiation Fund Project from the First Affiliated Hospital of Gannan Medical University.
Not applicable.