


The purpose of this study was to examine the isovolumetric distribution kinetics of crystalloid fluid during cardiopulmonary bypass.
METHODS:Ten patients undergoing coronary artery bypass grafting participated in this prospective observational study. The blood hemoglobin and the serum albumin and sodium concentrations were measured repeatedly during the distribution of priming solution (Ringer's acetate 1470 ml and mannitol 15% 200 ml) and initial cardioplegia. The rate of crystalloid fluid distribution was calculated based on 3-min Hb changes. The preoperative blood volume was extrapolated from the marked hemodilution occurring during the onset of cardiopulmonary bypass. Clinicaltrials.gov: NCT01115166.
RESULTS:The distribution half-time of Ringer's acetate averaged 8 minutes, corresponding to a transcapillary escape rate of 0.38 ml/kg/min. The intravascular albumin mass increased by 5.4% according to mass balance calculations. The preoperative blood volume, as extrapolated from the drop in hemoglobin concentration by 32% (mean) at the beginning of cardiopulmonary bypass, was 0.6-1.2 L less than that estimated by anthropometric methods (p<0.02). The mass balance of sodium indicated a translocation from the intracellular to the extracellular fluid space in 8 of the 10 patients, with a median volume of 236 ml.
CONCLUSIONS:The distribution half-time of Ringer's solution during isovolumetric cardiopulmonary bypass was 8 minutes, which is the same as for crystalloid fluid infusions in healthy subjects. The intravascular albumin mass increased. Most patients were hypovolemic prior to the start of anesthesia. Intracellular edema did not occur.
Attaching a patient scheduled for cardiopulmonary bypass (CPB) to an extracorporeal circuit implies that a large amount of crystalloid fluid is serially connected to the circulating blood volume. The crystalloid fluid then causes isovolemic hemodilution because allowing the blood level in the extracorporeal reservoir to decrease prevents marked changes in the intravascular hydrostatic fluid pressure. As most of the fluid is gradually distributed to the interstitial fluid volume (IFV), this setting offers the unusual capability to study the rate of crystalloid fluid distribution when one of the Starling forces is controlled.
A clinical concern is that the distribution might cause brain edema (1-3). Ringer's solution is slightly hypotonic (270 mOsmol/kg), but with the addition of mannitol, it becomes slightly hypertonic. Mixing fluids of different tonicity makes interpretation of the accompanying fluid shifts more complicated. In healthy volunteers, the kidneys readily handle such differences in fluid tonicity (4), but these mechanisms may work poorly during surgery when renal clearance is very low (5).
The purpose of the present study was to examine how rapidly patients scheduled for elective coronary artery bypass grafting distribute crystalloid priming fluid under isovolemic circumstances. The study also explored whether the capillary leak of protein is prominent during CPB. Finally, the utility of the solutions used in this setting was examined by estimating whether the infused volume entered the intracellular fluid space, which is a practical measure of the tendency of the fluid to cause brain edema.
METHODSThe present investigation was performed between January 2010 and September 2010 in accordance with the principles of the Declaration of Helsinki. The study protocol was approved by the Ethics Committee of the University of Linköping, Sweden (Ref M217-09) and registered at ClinicalTrials.gov, identifier NCT 01115166.
Ten adult patients (two females and eight males) with stable angina who were scheduled for coronary artery bypass grafting were enrolled. Each patient provided consent for participation after being informed about the study both orally and in writing. Demographic data are shown in Table1). All patients were treated with beta-blocker drugs and seven received diuretics, ACE-inhibitors or a combination of both. Exclusion criteria were the presence of other concomitant surgical procedures and hemodynamic instability prior to the induction of anesthesia.
Demographic data, calculation of blood volume by the dilution method and distribution of fluid after connecting 10 patients to an extracorporeal circuit.
| Parameter | Mean | SD | Median | Range |
|---|---|---|---|---|
| Age (years) | 71.1 | 11.6 | 74 | 47-84 |
| Body weight (kg) | 82.6 | 13.8 | 81.7 | 54.8-111.0 |
| Height (cm) | 175.7 | 7.7 | 176 | 160-187 |
| MAP prior to CPB (mmHg) | 64.7 | 7.0 | 63 | 55-80 |
| MAP during CPB (mmHg) | 56.7 | 9.7 | 54.5 | 45-75 |
| Blood flow during CPB (l/min) | 5.6 | 0.4 | 4.6 | 4.0-5.0 |
| Hbo (g/l) | 129 | 11.6 | 125.5 | 109-146 |
| Ringer's acetate in circuit (ml) | 2312 | 268 | 2330 | 1700-2800 |
| Hb (g/l) | 119.5 | 9.0 | 118.5 | 102-135 |
| Hbmin (g/l) | 82.0 | 8.0 | 80.9 | 69-97.5 |
| Hbss (g/l) | 91.9 | 11.1 | 93.5 | 71-113 |
| BV (ml) | 4968 | 972 | 5228 | 3619-6072 |
| BVmax (ml) | 7258 | 1071 | 7248 | 5759-8872 |
| BVss (ml) | 6710 | 963 | 6679 | 5297-8142 |
| k (min-1) | 0.104 | 0.045 | 0.087 | 0.061-0.200 |
| Half-time of fluid distribution (min) | 7.6 | 2.5 | 8.0 | 3.5-11.4 |
| Fluid distributed, two half-times (ml) | 411 | 182 | 439 | 80-621 |
| Fluid distribution rate (ml/kg/min) | 0.38 | 0.24 | 0.37 | 0.08-0.90 |
BV, Hb = absolute blood volume and blood Hb concentration at the start of CPB;
Hbss, BVss = parameters at steady state; k = distribution rate constant.
All patients were treated according to standard procedures. In the morning, before being transferred to the cardiothoracic operation ward, the patients received premedication with paracetamol, oxazepam and/or morphine. Each patient's age, gender, height and presurgical weight were recorded for calculation of the blood volume according to Nadler (6), Allen (7) and Retzlaff (8) (Appendix). The types and volumes of fluids used and their sodium (Na) concentrations were also registered.
Before induction of anesthesia, catheters were placed in the radial artery (16 G) and in a peripheral vein. Mechanical ventilation and oxygenation began after orotracheal intubation, with the aim of achieving an SpO2 of 99%. The minute volume was adjusted to achieve normoventilation as evidenced by a blood gas analysis. Further instrumentation consisted of transesophageal echocardiography, a 3-lumen central venous catheter and an indwelling bladder catheter with temperature monitoring.
Anesthesia was induced with fentanyl, sodium thiopental and rocuronium and maintained with isoflurane and fentanyl. Between induction of anesthesia and connection to CPB, all patients received 900-1200 ml of acetated Ringer's solution to prevent a drop in arterial pressure. All patients received 2 g cloxacillin in 100 ml of sodium chloride 9 mg/ml.
The CPB circuit (pre-connected components from Synthesis R® Dideco; Sorin Group, Milan, Italy) of the extracorporeal circuit (ECC; heart–lung machine with a roller pump, JOSTRA HL30, Maquet, Solna, Sweden) was primed with 200 ml of mannitol (150 mg/ml), 1300-1800 ml of acetated Ringer's solution and 5000 IU of heparin. CPB was initiated at a flow rate corresponding to a cardiac index of 2.4 l/min/m2. No active cooling was performed. After aortic cross-clamping, cold blood cardioplegia was initiated using 540-800 ml of crystalloid (20 ml Kardioplegi (APL, Stockholm, Sweden) 0.8 mmol K) with a procaine mixture in 1000 ml of acetated Ringer's solution. The cardioplegia was mixed with fresh blood drawn prior to the infusion in the proportion of 5:1, i.e. 16.6% was blood.
All blood samples were drawn from the arterial line and analysis was performed in the hospital laboratory. Whole blood was analyzed for hemoglobin (Hb) concentration and hematocrit (CELL-DYN Sapphire; Abbott Diagnostics, Abbott Park, IL). Plasma was used for the measurement of albumin and sodium concentrations (ADVIA® 1800 Chemistry System; Siemens, Eschborn, Germany).
Samples were taken immediately prior to CPB; the patients had already arrived in the operating room and received heparin. Thereafter, samples were taken every third minute until initiation of the second cardioplegia, which usually occurred 20 minutes after cross-clamping of the aorta. Urine volume and urinary sodium concentrations were measured before CPB and just prior to the second cardioplegia.
The blood volume (BV) was taken as the volume of the distribution of the endogenous Hb molecules, which was calculated from the prominent dilution occurring when patients were attached to the ECC. Thus, the calculated BV corresponded to a point in time (time zero) just before connecting the ECC to the patient's cardiovascular system.
where Hb is the blood Hb concentration measured just prior to when the fluid volume in the ECC was added to the patient's blood volume and Hbmin is the much lower blood Hb occurring just after the ECC was connected (Figure1).

The blood volume before anesthesia was induced (BVo) was obtained by calculating backwards from BV, using Hb as an indicator of dilution and assuming a stable Hb mass in the cardiovascular system. BVo was compared with three anthropometric measures of blood volume (6-8).
Hb was also the indicator of dilution for the calculations of crystalloid fluid distribution BV at each point in time (BVt) during the distribution process. Hbmin was inferred mathematically based on Hb measured 20-30 min after connection of the ECC. These values rose until a steady-state Hb level (Hbss) was reached.
Hbmin was then taken as time = 0 in a linear regression equation applied to the data in an x-y plot between the time t (min) after adding the ECC and ln[(Hbss−Hbt)/Hbt] at time t. The natural logarithm of 2 divided by the k-value estimated in the same linear regression yielded the half-life of the fluid distribution (9).
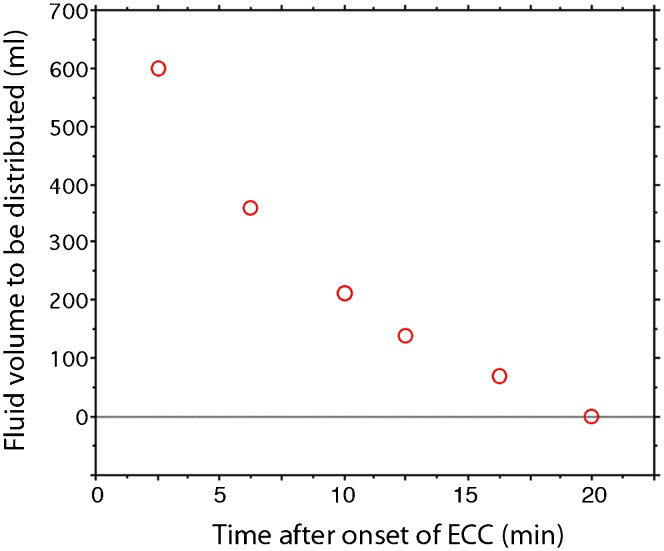
The rate of translocation of fluid from the BV to the IFV was expressed as the amount of fluid (ml/kg/min) that escaped the bloodstream during two half-lives.
The degree of protein leak was inferred by a mass balance applied to the measurements of serum albumin and the changes in BV and plasma volume (10). Similarly, fluid transfer to and from the cells was calculated by a mass balance based on serum sodium (8,15). The equations used for these calculations are provided in the Appendix).
The results are presented as the mean and standard deviation (SD) and/or the median and range. Correlations between parameters were studied through simple linear regression analysis. Differences were evaluated by the Wilcoxon matched-pair test and illustrated by Bland-Altman plots. P<0.05 was considered to be statistically significant.
RESULTSThe operating time was 178 (150-277) min and the surgical blood loss was 750 (400-1100) ml. The ECC was connected to the patient's bloodstream at 64 (41-127) minutes into surgery and the aorta was clamped at 80 (62-132) minutes. CPB lasted for 60 (37-123) minutes, and clamping of the aorta lasted for 53 (31-75) minutes. The priming solution consisted of 1450 (1300-1800) ml of Ringer's acetate and 200 ml of mannitol 15%. The initial cardioplegia measured 640 (480-800) ml.
Despite the absence of active cooling, the body core temperature dropped from 35.9°C (35.5-36.5) prior to initiation of CPB to the lowest registered value, 35.2°C (34.5-35.7), during CPB. The mean arterial pressure dropped from 63 (55-80) mm Hg prior to CPB to 54 (45-75) mm Hg during CPB (p<0.05). No patient received a blood transfusion during the study period.
Distribution kinetics and BVThe Hb concentration dropped 32% (SD 5) when patients were connected to the ECC. The rate of restoration of the Hb level from its lowest value to a steady state corresponded to a median distribution half-time of 8.0 min (Figure2).

The fluid in the circuit increased the BV to a maximum value of 7.3 L (BVmax), which then fell to a steady-state volume (BVss) of 6.7 L (Table1). Hence, the decrease in volume was 0.6 L. The rate of fluid transfer during the first two distribution half-times averaged 0.38 ml/kg/min (Figures1) and 2). The BV was estimated to be 5.2 L (median) based on the decrease in Hb relative to the amount of fluid in the circuit.
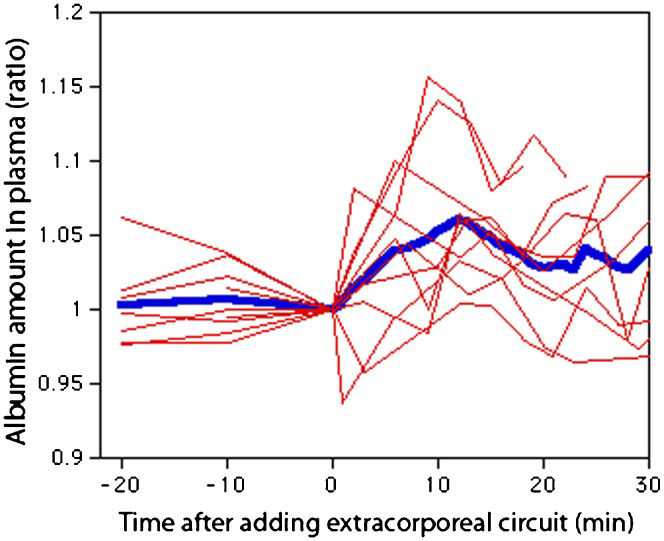
Capillary leakDuring the first 10 minutes of CPB, the intravascular albumin mass increased by a maximum of 5.4% (SD 5.1) (Figure3).
Fluid transfer to the cells as baseline. Each red line represents one patient. Blue line is the mean value.")
Water was translocated from the ICV to the ECV in eight of the 10 patients, with the median volume transferred being 236 ml (p<0.05, Table2). The two remaining patients experienced increased ICFs of 112 and 253 ml.
Blood volume estimated by the absolute dilution method (BVo) and by anthropometric equations (top); fluid balance and calculation of fluid distribution (bottom).
| Parameter | Mean | SD | Median | Range |
|---|---|---|---|---|
| BVo (ml) based on BVo | 4.61 | 0.86 | 4.86 | 3.42-5.80 |
| BVo Nadler et al. (5) | 5.18 | 0.67 | 5.18 | 4.17-6.21 |
| BVo Allen et al. (6) | 5.76 | 1.01 | 5.86 | 4.18-7.28 |
| BVo Retzlaff et al. (7) | 5.21 | 0.74 | 5.32 | 3.74-6.16 |
| S-Na before start of CPB (mmol/l) | 139.5 | 2.3 | 139.5 | 136-143 |
| S-Nat end of CPB (mmol/l) | 135.0 | 2.5 | 135 | 131-139 |
| Infused sodium (mmol) | 306 | 46 | 306 | 211-385 |
| Urine volume (ml) | 84 | 51 | 76 | 35-210 |
| Urinary sodium conc. (mmol/l) | 53 | 20 | 46 | 32-100 |
| ΔICFt-0 (ml) | -330 | 557 | -236 | -1,700 to 223 |
S-Na = serum sodium concentration; ΔICFt-0 = expansion of the intracellular fluid volume.
Backward extrapolation from BV, based on Hb mass, showed that the BVo (before induction of anesthesia) was 4.6 (0.9) L. A comparison between BVo and anthropometric equations indicated that nearly all patients were hypovolemic when anesthesia was initiated. The mean difference between the measured and anthropometric BVo was -1.1 (Allen's equation, p<0.01), -0.6 (Retzlaff, p<0.013) and -0.6 (Nadler, p<0.02) (Table2), top; (Figure4).
DISCUSSION and Altman-Bland tables (bottom row) comparing blood volume measured with a kinetic technique (BV0) with values obtained by anthropometric equations.")
The rate of fluid distribution during CPB is of significant theoretical interest because the distribution is largely unaffected by differences in hydrostatic pressure in this setting of isovolumetric dilution. The results show that the half-time for the distribution of the priming solution (Ringer's acetate and mannitol) and the first cardioplegia in the bloodstream averaged 8 minutes, which should be multiplied by a factor of four to indicate when equilibration of fluid between the plasma and the interstitial fluid space was achieved. Interestingly, this was quite similar to the rate found in a number of previous studies in which the crystalloid fluid infusion was allowed to increase the intravascular hydrostatic pressure that normally occurs in an intact cardiovascular system not connected to an extracorporeal circuit (5). The present result supports previous assumptions that the relatively long distribution half-time of crystalloid fluid is primarily explained by differences in perfusion between vascular beds rather than by the Starling equation (11). Otherwise, the equilibration would occur almost instantly due to the low reflection coefficient of the electrolytes present in crystalloid fluid.
To our knowledge, no previous calculations of the distribution half-time of crystalloid fluid have been performed in humans connected to an extracorporeal circuit. The effects on fluid balance have previously been studied in laboratory animals (12-14). In pigs, the fluid leakage described the equilibration process. Within 15 minutes of extracorporeal circulation, the rate of distribution decreased from 1.75 to 0.82 ml/kg/min (14). In the present study among humans, a similar equilibration process was found (Figure2), but the rate of distribution was lower, averaging 0.38 ml/kg/min. When expressed in this way, the rate of distribution is dependent on the amount of fluid added to the reservoir. For this reason, the half-time is the best way to present the result.
Another aspect of the fluid balance is the degree of capillary leakage of protein. Previous studies have expressed concern that the use of an extracorporeal circuit would induce a state of inflammation that would promote an excessive loss of albumin and fluid from the intravascular space (15,16). However, studies in piglets suggest that only small amounts of albumin leave the BV with the fluid transfer (12,13). The results of the present study suggest that no leakage of albumin occurs. The capillary walls seemed to be intact and there was no evidence that the fluid loss during CPB had an inflammatory origin. Soon after the ECC was connected, there was even an increase in the albumin content of the plasma. Such an increase has previously been shown to occur during thyroid surgery performed under general anesthesia (17), whereas capillary leakage increases in response to an infusion of crystalloid fluid in conscious volunteers (18).
During CPB, fluid is lost from the intravascular space to the tissues, resulting in interstitial or intracellular edema. Previous authors have been concerned that the complex management of fluid balance during CPB could result in cerebral edema. The reasons for the concern include the potential effect of the extracorporeal circuit on the integrity of the blood-brain barrier (19) and the complicated fluid shifts occurring during CPB (20). The sodium ion was used as an intrinsic indicator to assess whether cellular edema develops. However, the results show that only small volumes were transferred; even then, these volumes were not transferred from the ECV to the ICV, but rather were transferred in the reverse direction.
Exploratory calculations of the BV were made based on a dilution method. This employs the hemodilution that develops when fluid volume is instantly added to the cardiovascular system in the form of an extracorporeal circuit. Because Hb is distributed solely within the BV in humans, adding a large amount of fluid offers the possibility to estimate BV from the resulting hemodilution. More conventional methods used to estimate BV are based on tracer kinetics (6). The concentration of a substance that is distributed only within the BV is then measured after being added to the blood. Examples of such tracers are radioactive albumin and carbon monoxide (21).
The BVo calculated here indicates that the patients who underwent coronary bypass were hypovolemic. The mean difference between BVo reference values obtained by three sets of anthropometric equations and the BVo calculated from the Hb dilution ranged from 0.6 to 1.2 L. The hypovolemia was most likely due to preoperative fasting and chronic heart disease medication, which included beta-receptor blockers and usually diuretics and/or ACE inhibitors. All three types of drugs are known to reduce blood and plasma volumes (22,23). Moreover, angina pectoris leads to inactivation, which lowers the BV (24).
Limitations of this study include the small number of patients undergoing coronary artery bypass grafting, though the theoretical framework of the method used to assess distribution kinetics is conventional for this type of measurement (5,21). Our approach to estimating BV has not been used previously, whereas the calculation of albumin mass (10,17,18) and the sodium balance method (4,17,25) have been used in several previous works. The fact that the priming solution contained 200 ml of mannitol may be an issue. This agent is distributed in the extracellular compartment at a rate similar to that of Ringer's solution (26,27). The plasma volume expansion might be somewhat greater than expected from Ringer's alone because the osmolality of the priming solution and cardioplegic fluid was approximately 327 mOsmol/L. Therefore, we could not quantify the capacity of the priming solution to expand the plasma volume.
In conclusion, the patients scheduled for coronary artery bypass grafting were hypovolemic prior to surgery. After connection to the extracorporeal circuit, the crystalloid fluid distributed with a half-time of 8 minutes. The capillary leak of albumin did not increase and the use of CPB did not induce cellular edema.
ACKNOWLEDGMENTSThis work was supported by the Östergötland County Council (Grants number 61791 and 129561).
AppendixAnthropometric equationsBy using the preoperative Hb value (Hb0), the measured BV was back-transformed to represent the preoperative blood volume,
(i.e., before anesthesia was induced). was then compared with anthropometric values for healthy men and women derived from three widely used sets of equations. The first was developed by Nadler et al. (6):


The second set of equations is from Allen et al. (7):

The third group of equations estimates
as the sum of the erythrocyte and plasma volumes (8):Protein leak

Translocation of albumin from the BV to the IFV was calculated by a mass balance, based on the assumption that albumin, but not Hb, can pass through the capillary membrane. The albumin leak between time 0 and a later time t was calculated as (10,17):
which is based on repeated measurement of the serum albumin concentration and estimates of the plasma volume, obtained as BVt (1-hematocritt).Fluid transfer to the cells
The distribution of infused fluid between the extracellular fluid volume (ECF) and the ICF was estimated using serum sodium (S-Na) as an endogenous tracer (8,17,25). If sodium ions were evenly distributed throughout the ECF, the following mass balance equation shows that the change in the ICF volume from time 0 to any time t is:

ECFo is assumed to be 20% of the body weight (28).
AUTHOR CONTRIBUTIONSZdolsek JH proposed the study idea, which was detailed by Zdolsek JH and Hahn R. Törnudd M collected the data. Zdolsek JH and Hahn R performed the calculations and wrote the manuscript.
No potential conflict of interest was reported.