Although the diagnosis of Graves’ orbitopathy is primarily made clinically based on laboratory tests indicative of thyroid dysfunction and autoimmunity, imaging studies, such as computed tomography, magnetic resonance imaging, ultrasound and color Doppler imaging, play an important role both in the diagnosis and follow-up after clinical or surgical treatment of the disease. Imaging studies can be used to evaluate morphological abnormalities of the orbital structures during the diagnostic workup when a differential diagnosis versus other orbital diseases is needed. Imaging may also be useful to distinguish the inflammatory early stage from the inactive stage of the disease. Finally, imaging studies can be of great help in identifying patients prone to develop dysthyroid optic neuropathy and therefore enabling the timely diagnosis and treatment of the condition, avoiding permanent visual loss. In this paper, we review the imaging modalities that aid in the diagnosis and management of Graves’ orbitopathy, with special emphasis on the diagnosis of optic nerve dysfunction in this condition.
Graves’ orbitopathy (GO) is the most common extra-thyroidal manifestation of Graves’ disease (GD), occurring in 25–50% of patients with the disease (1),(2). GO may occur during or after the onset of hyperthyroidism and less frequently, in euthyroid or hypothyroid patients. The close clinical association between immunogenic hyperthyroidism and orbitopathy suggests that the antigen responsible for these diverse conditions may be shared by the thyroid gland and orbital tissues (3). The disease has a self-limited active phase that usually lasts 18 to 24 months and abates slowly, followed by an inactive (static) phase (4). In the active phase, inflammation, the accumulation of glycosaminoglycans and an increased fat content determine the tissue expansion within the relatively fixed space constraint of the bony orbit.
The diagnosis of GO is usually made clinically. The signs and symptoms of active GO include lid retraction, proptosis, conjunctival injection, chemosis, diplopia, corneal ulceration and rarely, dysthyroid optic neuropathy (DON) (5). In the chronic fibrotic phase, lid retraction, proptosis and restrictive strabismus are the most common findings. Patients with GO pose few diagnostic difficulties when these characteristic ocular findings occur concomitantly with the thyroid disease. However, when unilateral or inconclusive ocular features occur in the absence of objective evidence of thyroid dysfunction, GO can be difficult to diagnose (6).
Among the ocular features, eyelid retraction plays a major role in the clinical diagnosis of the disease. According to Bartley and Gorman's diagnostic criteria (7), GO may be diagnosed when eyelid retraction occurs in association with exophthalmos, DON or extraocular muscle involvement. If eyelid retraction is absent, positive laboratory tests are required for diagnosis.
Affecting 4–8% of patients, DON has long been recognized as the most feared complication of GO (8),(9). Although inflammatory (10)–(12) and ischemic (13) mechanisms have been suggested, the most widely accepted explanation is the mechanical compression of the optic nerve at the orbital apex by the enlarged extraocular muscles (14). Because DON may present a wide range of symptoms and signs, its diagnosis depends on several clinical features, including decreased visual acuity (VA), abnormal visual fields (VF), impaired color and brightness perception, delayed visually evoked potentials, afferent pupillary defects and edema or atrophy of the optic nerve head (9). Patients with GO are often assumed to have DON when one of these features is present and no other cause for the defect is observed, but visual impairment in GO is not uncommonly related with other factors (15). Consequently, in GO patients, direct optic nerve function testing can yield misleading results that occasionally make it difficult to distinguish probable from definitive DON.
Although the diagnosis of GO and DON is based primarily on clinical signs from laboratory test results suggestive of thyroid dysfunction and autoimmunity, imaging studies, such as computed tomography (CT), magnetic resonance imaging (MRI), ultrasonography (US) and color Doppler imaging (CDI), can also be extremely important in both the diagnosis and clinical or surgical follow-up. Imaging studies can verify possible extraocular muscle involvement as part of the diagnostic workup and may help distinguish the early acute inflammatory stage from the fibrotic, inactive stage of the disease (16). Finally, imaging studies of patients prone to develop DON make the timely diagnosis and treatment of the condition possible, avoiding permanent visual loss (17). The purpose of this paper is therefore to review imaging modalities that can aid in the diagnosis and management of GO, with a special emphasis on the diagnosis of GO-related optic nerve dysfunction.
Imaging modalities in Graves’ orbitopathyComputed tomography (CT)CT can distinguish normal structures from abnormal structures of different tissue density based on their differing X-ray absorption properties. Fat and water have low densities and therefore appear black on CT images, in contrast to denser muscles, the optic nerve and bony structures. Effectively acting as a natural contrast medium, the presence of orbital fat allows good spatial and density resolution of orbital structures (18). The tissue differences inherent in the orbit obviate the need for intravenous contrast in many situations. After digital recording, the data are converted via an arithmetic procedure into different grayscales. Compared with isodense tissues (e.g., the brain), tissues with high absorption values (e.g., bone) appear hyperdense, whereas tissues with low absorption values (e.g., water or fat) appear hypodense (4).
The introduction of spiral CT in the early 1990s represented a fundamental evolutionary step in the development and ongoing refinement of CT imaging techniques. Continuous scanning of anatomical regions within a short time frame yields compelling results, and the technology has been shown to offer undisputable advantages in lesion detection and isotropic spatial resolution (19). Individual volume elements obtained from axial slices can be reformatted in any plane to produce coronal, sagittal, paraxial or parasagittal oblique images. Unlike direct coronal scans, sagittal and coronal reformations avoid high spatial frequency artifacts from dental appliances and other metal implants. Multiplanar reformations make it possible to view a lesion in the optimal anatomic plane and determine its location relative to contiguous orbital, bone, sinus and central nervous system structures. The advent of multidetector computed tomography (MDCT) has improved image quality and resolution by enabling the simultaneous acquisition of multiple slices and faster gantry rotation (20).
Magnetic resonance imaging (MRI)Hydrogen nuclei with an odd number of nucleons (protons and neutrons) behave as small magnets or dipoles. Protons are ubiquitous, and their resonance is the basis of MRI techniques (21). MRI captures signals from the free-moving protons in tissue as the protons return to their primary position in a high magnetic field after deflection by a frequency pulse. When an organ is placed in a magnetic field, there is a net alignment of protons. Radio-frequency excitation reverses the polarity of some of these hydrogen nuclei, raising their level of energy. When the excitation stops, the protons return to their original polarity, emitting a measurable amount of energy. This process is called T1 relaxation (T1), and it is best measured just after the radio-frequency excitation is stopped. Radio-frequency excitation also initiates a uniform synchronous precession, or spin, in the protons. Following the excitation, the spinning subsides at different rates in different molecular environments. The energy emission measured from this process is called the T2 relaxation time (T2) (4). T1 and T2 can be used to distinguish between tissue types with different proton densities. T1-weighted (T1w) images may be used to evaluate anatomic structures, whereas T2-weighted (T2w) images provide useful information about tissue composition. Additionally, certain T1 or T2 weights achieved by applying special pre-pulses can be used to distinguish water from fat.
Ultrasonography (US)Grayscale US has been used in ophthalmology since the late 1950s. Standardized diagnostic US for eye diseases is performed using high frequencies (optimally 8 MHz) and small wavelengths to visualize small ocular structures. Both A-scan and B-scan transocular echograms are performed. A-scans are used to assess the tissue characteristics based on the reflected acoustic waves. This technique is particularly sensitive for identifying the thickening or thinning of the muscles and for differentiating underlying pathologies. The reflectivity of the extraocular muscles may change as a result of tissue edema and cellular infiltration (4). It is easier to visualize the orbital structures using a B-scan, especially when the examination is not performed by an experienced ultrasonographer. B-scans are very helpful in topographic evaluations and when determining whether individual recti muscles are enlarged.
The main advantages of orbital US are its low cost and the lack of ionizing radiation. Additionally, in experienced hands, a relatively short examination time is adequate to monitor the anterior and midorbital therapeutic response. The main disadvantages of US are the high intra- and interobserver variability, the inability to adequately visualize the orbital apex and the poor quality of the anatomic information obtained of the bony orbital walls compared with the information provided by CT and MRI (18).
Color Doppler imaging (CDI)CDI is an ultrasonic imaging modality that allows the assessment of blood flow in real time on a grayscale B-mode background. The technique was first described in 1979 (22) and is well tolerated and widely used as a noninvasive imaging technique in many medical specialties. More recently, CDI has been introduced as an adjunct to the clinical examination and cross-sectional imaging for evaluating several pathological conditions in the orbit. Although the topography of the orbital structures can be evaluated with grayscale US, CDI makes it possible to assess the blood flow in the orbital vessels and detect changes in the perfusion of the orbital arteries and veins (23).
CDI produces conventional grayscale US images together with information about the direction and velocity of the blood flow. The velocity data are superimposed onto the grayscale image by assigning a color scale to the data (24). The indications for and uses of CDI in ophthalmology are still evolving but primarily include vascular disorders. CDI has been used to investigate changes in blood flow parameters in disorders such as anterior ischemic optic neuropathy, central artery occlusion, central retinal vein occlusion, glaucoma, diabetes mellitus, ocular ischemic syndrome, uveitis and endophthalmitis. In orbital abnormalities, CDI is well suited for the evaluation of cavernous-carotid fistula, orbital varix, orbital tumors, orbital cellulitis and orbital inflammatory conditions (24),(25).
The major blood supply to the orbit is through the ophthalmic artery (OA), and the major venous drainage is through the superior ophthalmic vein (SOV) to the cavernous sinus. CDI can be used to assess the OA and its branches, such as the SOV and inferior ophthalmic vein. The CDI assessment of patients with GO is of great value because studies have shown that venous congestion plays a significant role in the pathogenesis of the disease (26).
Imaging studies for diagnosing GO and defining disease activityImaging studies can be helpful in establishing the diagnosis of GO because they provide objective morphological findings of the orbital structures. Based on such studies (especially MRI and CT), it is possible to establish the degree of extraocular muscle and orbital fat enlargement, exclude coexisting orbital pathology, clarify a confusing clinical picture, and perform surgical planning (12). A CT scan with positive findings is included in many sets of diagnostic criteria for GO (7),(27)–(30).
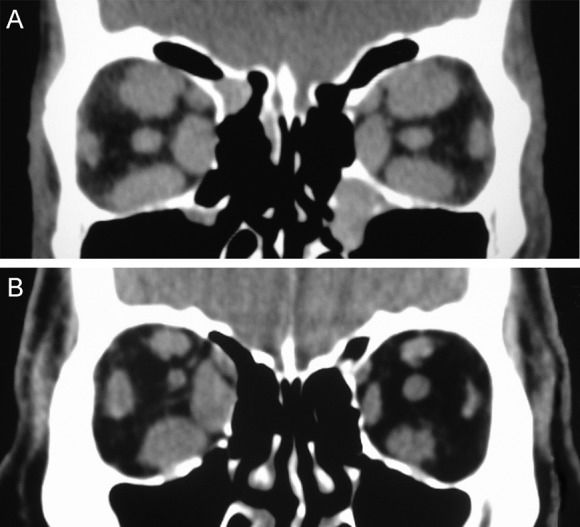
GO presents an unusual imaging pattern. The extraocular muscles appear to be the primary area of orbital involvement. Despite attempts to establish normative measurements (31)–(34), the assessment of muscle enlargement is often subjective and requires comparison with the opposite orbit or prior qualitative experience. Patients with GO usually present symmetrical, multiple extraocular muscle enlargement in both orbits, although asymmetrical muscle involvement can occur. However, true unilateral orbital involvement is uncommon, occurring in only 6 to 10% of patients (35). The muscles most frequently affected are the medial and inferior recti (Figure 1).
In a series of 116 CT scans of a heterogeneous population of patients with GO in different stages of the disease, 85% of the patients displayed definitive enlargement of the extraocular muscles (36). The inferior and medial recti were involved in 77% and 75% of the cases, respectively, and were the most severely enlarged. The lateral (51%) and superior (50%) recti were involved less frequently and less severely. However, a later study found similar levels of enlargement in all four major muscle groups (32). In another CT scan study involving 349 thyroid patients, the inferior, medial, superior and lateral recti were enlarged in 43%, 38%, 29%, and 16% of the cases, respectively. Two or more muscles were enlarged in 70% of the patients with ocular involvement (37).
Unlike in patients with orbital myositis or idiopathic orbital inflammation, the evidence of muscle involvement in patients with GO is usually limited to the nontendinous portion of the muscle. Additionally, the extraocular muscles in GO appear to be enlarged in a fusiform fashion, with sharp borders (38). However, atypical cases with tendon involvement and blurred muscle margins have been described (31),(39)–(41).
In the evaluation of the extraocular muscle characteristics in GO, CT, and MRI are the preferred imaging procedures, although US may also be useful (42). In clinical practice, US may conveniently be used to measure the extraocular muscles and exclude other diseases. However, although some authors have used US to evaluate muscle size, the technique has been found to have limited accuracy and add no new information to the knowledge obtained from CT and MRI studies (37),(43),(44).
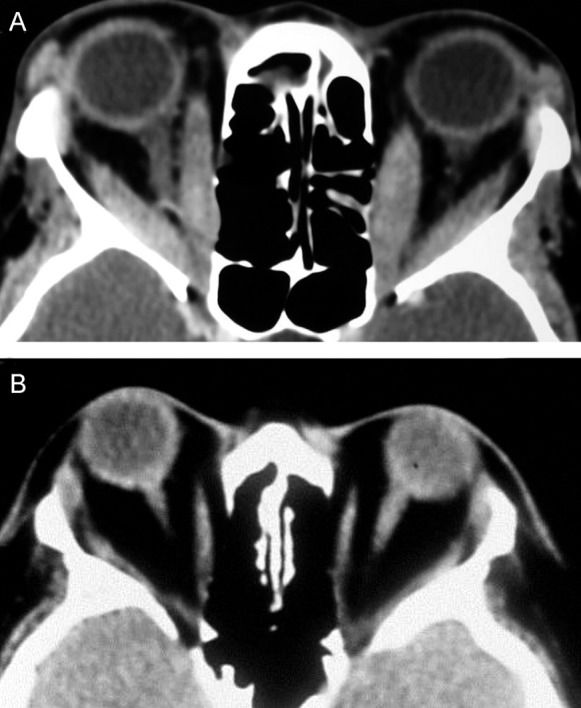
Although the extraocular muscles have been described as the “shock organ” of GO (31), many studies suggest that expansion of the orbital fat compartment also represents a major component of the disease process (45),(46). In GO, although some affected orbits are characterized by prominent extraocular muscle enlargement, other orbits display mild or no extraocular muscle involvement, occasionally with clearly increased adipose tissue volume. Imaging studies can distinguish these clinical differences (Figure 2). Consequently, some reported diagnostic criteria for GO include the observation of orbital fat augmentation in CT images (28),(47). The observation of exophthalmos in patients with abnormally increased orbital adipose tissue is suggestive of GO, but obesity and Cushing's disease should also be considered (48).
GO is associated with a wide spectrum of radiological findings in addition to extraocular muscle and fat tissue enlargement, as described in the literature (36),(49),(50). CT findings may include bone changes, especially in the lamina papyracea of the ethmoid, with bowing resulting from muscle pressure. Lacrimal gland displacement and enlargement, exophthalmos, anterior soft tissue swelling and superior optic vein dilatation may also be observed in imaging studies, but these are unspecific findings that do not support the diagnosis of GO (32),(51),(52).
CT is generally the preferred imaging modality for the diagnosis of patients with GO because of its ability to visualize bone and soft tissues in the orbit. CT also aids the evaluation of the orbital walls, sinus and orbital elements in orbital decompression planning. Compared with MRI, CT is less expensive and faster to perform; however, CT is less efficient in the evaluation of soft tissue changes. Additionally, MRI can reveal details that may be important in the assessment of disease activity.
In addition to their importance in the diagnosis of GO, imaging studies can aid the evaluation of inflammatory disease activity. Changes observed with CT in sequential measurements of the extraocular muscles may be related to clinical activity; muscular involvement occurs early in GO and subsides together with other clinical signs (53). Nevertheless, MRI is preferred for studies assessing disease activity because of its better performance in the evaluation in soft tissues.
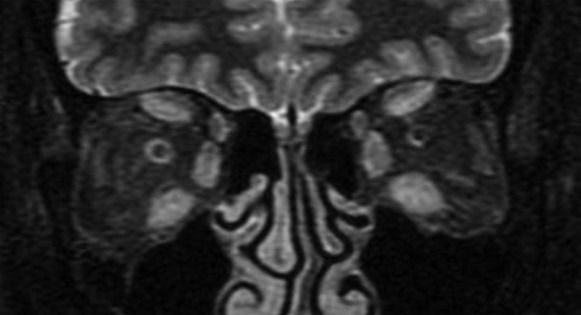
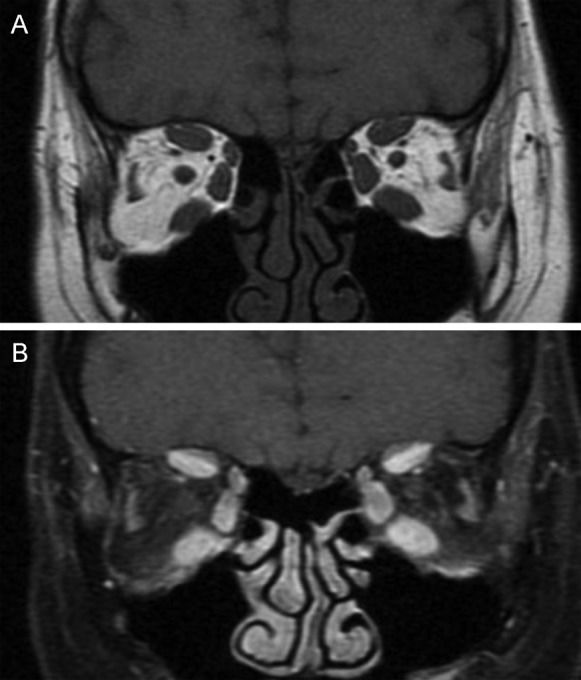
MRI estimates disease activity based on the water content of the tissues. In GO, strongly T2-weighted and fat-suppressed images obtained using the turbo inversion recovery magnitude (TIRM) and short tau inversion recovery (STIR) sequences have been shown to be useful in detecting extraocular muscle edema (54). To differentiate active from inactive GO, inflammatory edema of the extraocular muscles must be distinguished from fibrous end-stage disease with fatty degeneration using the T2 relaxation time, which is shorter for fibrous tissue than for inflammatory tissue (Figure 3) (55). However, edema is not always correlated with disease activity because edema can also be the result of both active inflammation and reduced venous outflow in patients with fibrotic disease. Some studies have shown that in T1w images, when gadolinium is combined with fat saturation techniques, it is possible to distinguish inflammatory edema from congestive venous outflow in burned-out disease (Figure 4) (55),(56). Non-fat-saturated T1w images are also useful in the detection of fatty muscle degeneration. These fatty or fibrotic muscle changes display no contrast enhancement on matched fat-saturated T1w images.
Coronal T1-weighted MR images from a patient with active Graves’ orbitopathy. A) Image showing enlargement of the extraocular muscles without fatty degeneration. B) Fat-suppressed and gadolinium-enhanced image showing a bright signal from the inferior, medial and superior recti muscles.
In the management of GO, it is of great importance to estimate the disease activity when selecting those patients most likely to respond to immunosuppressive treatment. Clinical activity scales, such as the clinical activity score (CAS) described and validated by Mourits and the Amsterdam orbitopathy group (57) and VISA classification described by Dolman and Rootman (58), can be very helpful in assessing disease activity. Although it might be assumed that the combination of MRI studies and clinical scores would improve diagnostic accuracy, the results have been conflicting. Some researchers have found no clear correlation between MRI findings and CAS indexes (54),(59),(60), perhaps because of the great variability in CAS scores between observers or because only the extraocular muscles, and not the inflamed orbital fat, were assessed. However, other researchers have reported significant positive correlations (61). Despite the controversy, MRI appears to be useful for monitoring the response to treatment using measurements such as the signal intensity (SI) and signal intensity ratio (SIR).
The use of US has also been proposed for evaluating disease activity. Prummel et al. (62) demonstrated extraocular muscle reflectivity changes in the inflammatory phase of GO, suggesting that US is a reliable tool for the determination of disease activity. In the active phase, the extraocular muscles have a lower internal reflectivity, presumably due to edema, whereas in end-stage disease, the muscles tend to show irregular high reflectivity from the echogenic fibrotic scar tissue. However, not all studies have found a correlation between CAS and US reflectivity (59),(63). Moreover, US is believed to provide less comprehensive information on the extraocular muscles and inflammation than MRI. It should also be noted that the adequate measurement of muscle reflectivity requires standardized A-wave US equipment and an experienced examiner.
CDI has also been used as a tool for diagnosing GO and assessing disease activity. Several studies have compared the orbital blood flow in GO patients and control subjects (25),(64),(65), as well as in patients with different clinical forms of GO (66). Benning et al. (64) found that the flow velocity in the right ophthalmic artery was much greater in subjects with clinically active GO than control subjects. This finding was also reported by Alp et al. (25), which supports the assumption that orbital inflammation increases orbital blood flow. The research in this area is promising; Monteiro et al. (26) recently compared the CDI findings from orbits with the active form of the disease with findings from the same orbits after (primarily surgical) treatment and found a significant difference.
Finally, patients with GO may be diagnosed using octreotide scintigraphy (octreoscan). Octreotide is a somatostatine (SM) analogue labeled with indium, a substance that has been used to localize tumors with membrane receptors for SM. Based on the assumption that orbital lymphocytes express SM receptors during the active phase of GO, a high uptake of the radiolabelled octreotide may be correlated with orbital inflammation and active disease (67),(68). A positive orbital octreoscan could be useful in the assessment of disease activity in GO; however, the fact that the technique is expensive, non-specific and associated with a non-negligible radiation burden restricts its clinical application (4).
Imaging studies for the diagnosis of dysthyroid optic neuropathyComputed tomography (CT)Several studies have shown that certain CT scan parameters increase the suspicion of DON. Although the stretching of the optic nerve by the increased orbital fat associated with axial proptosis is in rare cases considered a possible pathogenic mechanism for developing optic neuropathy (69), the most important mechanism is orbital apical crowding by the enlarged extraocular muscles (9),(14),(17),(32),(52),(70)–(73). Because the presence of apical crowding in CT images is strongly correlated with DON in GO, many CT studies have proposed indexes designed to objectively detect DON in several different manners.
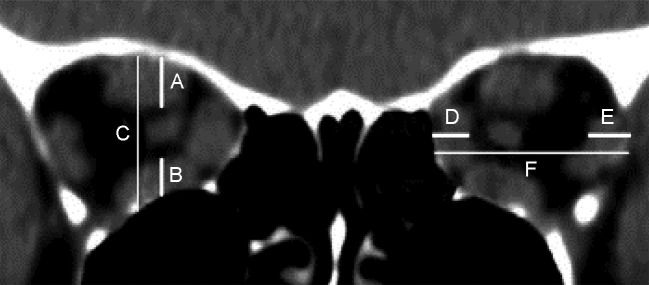
In a pioneer study based on linear measurements of the extraocular muscles and bony orbit, Barrett (52) described a simple method of quantifying extraocular muscle impingement on the optic nerve space. Using a reformatted scan halfway between the posterior globe and orbital apex, the vertical diameter of the superior rectus muscle–levator muscle complex (A) and inferior (B) rectus muscles, as well as the orbital height (C), were measured with a ruler along a horizontal line through the optic nerve. The vertical muscular index was expressed as the percentage of the orbital height occupied by the superior rectus muscle–levator muscle complex and inferior rectus muscles ([A+B/C]×100) (Figure 5). In the same manner, the transverse dimensions of the medial and lateral rectus muscles and orbital width were measured to determine the horizontal muscle index ([D+E/F]) (Figure 5). The greater of the two ratios was considered the muscle index. The study showed that a muscle index of 67% or greater indicated compressive neuropathy with a diagnostic sensitivity of 67%, although no patient with NOD had a muscle index of less than 50%. In a recent study using MDCT imaging, this linear index displayed the best combination of sensitivity and specificity (79% and 72%, respectively) at a muscle index of 60% (71). Barrett’s index was found by other authors to provide satisfactory performance in the detection of DON (17),(73).
Schematic representation of the method for calculating Barrett’s muscle index. The vertical index was calculated by the sum of the vertical muscle diameters (A and B) divided by the height of the orbit (C). The horizontal index was calculated by dividing the sum of the horizontal muscle diameters (D and E) by the horizontal diameter of the orbit (F).
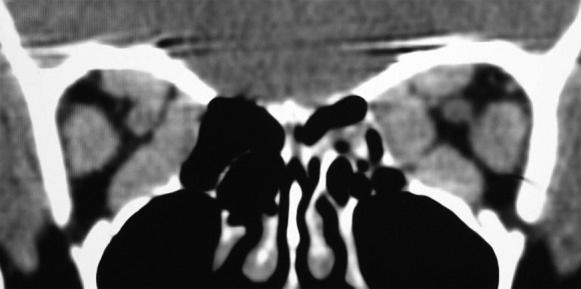
The subjective assessment of apical crowding based on single coronal images, as described by Nugent et al.(32) and others (9),(17),(70),(73),(74), has also been shown to a be good predictor of DON. In these studies, a coronal image at the apex is subjectively graded according to the severity of the muscle crowding. According to this method, the effacement of the perineural fat is graded 0 (none), 1 (up to 25%), 2 (25–50%), or 3 (greater than 50%) (Figure 6) (32). Nugent et al. found severe apical orbital crowding (grade 3) in 12 of 18 orbits with DON but in only 16 of 124 orbits without DON (32). Neigel et al. graded 79.2% of the orbits with DON and 12.9% of the orbits without DON as having moderate or severe crowding (9). Birchall et al. found severe apical crowding to be a good predictor of DON, with a sensitivity of 62% and specificity of 91% (74). A recent multicenter study found apical muscle crowding in 49 of 56 orbits with DON (70). In another study, severe optic nerve crowding was retrospectively noted in 80% of the orbits (16 of 20) with optic neuropathy and 29% of the orbits without DON (10 of 34). No orbits with optic neuropathy had less than grade 2 evidence of optic nerve crowding (17). However, although it appears clear that the Nugent’s apical crowding score is useful for raising suspicion of DON, the score does not provide a clear definition of the position along the orbit where the coronal plan should be taken to determine the score, and there is no clear differentiation between grade 1, 2, and 3 orbital crowding. More recently, the objective quantification of apical orbital crowding based on square area measurements was shown to be a more efficient diagnostic tool than subjective quantification. In this study, the best-performing index was highly efficient at detecting DON, with a sensitivity of 91.7% and specificity of 90.0% (75).
Chan et al. (73) highlighted the importance not only of extraocular muscle enlargement but also the role of the bony orbit and its usefulness as a predictor of DON. The bony orbit capacity was quantified using standardized orbital angles on axial scans. The study showed that these measurements were independent predictors of DON and that narrower orbits were more susceptible to develop DON. The authors also calculated an index of orbital muscular crowding in combination with lateral and medial orbital wall angles that had a 73.3% sensitivity and 90% specificity.
Birchall et al. (74) found intracranial fat prolapse through the superior orbital fissure to be a predictor of DON, but later studies have not confirmed the usefulness of this parameter (70),(73). Other CT features have been tested as indicators of DON, including lacrimal gland displacement, exophthalmos, superior optic vein dilatation, and single muscle measurements, yielding conflicting and mostly discouraging results (9),(17),(32),(52),(74),(76).
Although linear or square measurements have proved helpful in diagnosing DON, the estimation of the orbital apex crowding based on volumetric estimates of structures could potentially improve the ability to detect DON. Feldon et al. (14),(77) have used volumetric estimation of the orbital content to investigate the risk of developing DON in GO. Previously, such estimates involved cumbersome measurements of the extraocular muscles, but recent advances in MDCT have made volumetric estimates of orbital structures readily available at a workstation (78). In a recent study, orbital crowding indexes were for the first time calculated based on the volumetric analysis of CT images. The orbital fat and muscle volumes were estimated based on their different attenuations in Hounsfield units from measurements from the anterior orbital rim up to the optic foramen. Based on these measurements, two volumetric indexes of orbital muscle crowding were calculated: one based on axial scans of the entire orbit and another based on coronal scans of the orbital apex. Both indexes were efficient in predicting DON, especially the index limited to the orbital apex (with 92% sensitivity and 86% specificity) (79).
Magnetic Resonance Imaging (MRI)Very few MRI studies have directly assessed DON. Dodds et al. (80) assessed DON in a high-resolution MRI study in which they compared the diameter of the optic nerve at seven different positions from the eyeball to the pre-chiasmal region in three groups (control, GO with DON, and GO without DON). The optic nerve diameter was significantly smaller in the group with DON. However, the overall reduction was not substantial, and there was considerable overlap between the control subjects and patients with DON. The authors admitted that despite the observed reduction in the optic nerve size in the DON group, neural compression could not be shown to be the pathogenic mechanism underlying the nerve dysfunction, but they found mechanical compression of the optic nerve to be the most plausible explanation. Alternatively, DON might be caused by vascular compression or some other unidentified mechanism. The authors also observed reductions in the optic nerve diameter in the absence of enlarged extraocular muscles, suggesting that the compression results from increases in the intraorbital pressure due to the increased fat volume.
Although CT is excellent for outlining bone details, MRI provides better soft tissue detail and is useful for evaluating the extraocular muscles, optic nerve and fat. Therefore, further studies are necessary to better investigate the ability of MRI to detect DON, alone or in association with CT.
Ultrasonography and color Doppler imagingIn some studies, US has been used to attempt to identify the presence of DON. One study has suggested that US can detect DON-related enlargement of the subarachnoid space of the optic nerve, but this is apparently only rarely noted (4). The evaluation of the venous flow can also be useful. Monteiro et al. (66) reported that patients with congestive orbitopathy and predominantly myogenic fibrotic GO experience a significant reduction in the SOV flow, matching reports from other authors (81) and supporting the idea that orbital congestion due to extraocular muscle enlargement can reduce orbital venous drainage. Because DON is known to be related to orbital apex crowding, the existence of severe venous stasis in the orbits possibly reflects a stage in its development. Although both US and CDI can produce findings suggestive of DON, systematic studies differentiating congestive cases with DON from cases without DON are needed to determine the usefulness of these methods.
Although the diagnosis of GO and DON still relies heavily on clinical data, recent decades have seen outstanding developments in orbital imaging techniques. Important imaging studies have led to the emergence of new perspectives in the diagnosis and treatment of GO, which constitute the main topic of this review.
CT remains the main imaging modality in Graves’ disease. CT can be used to establish the degree of extraocular muscle and orbital fat enlargement, clarify a confusing clinical picture and aid surgical planning. Furthermore, CT can be of great help in the detection of DON using linear, area or volumetric indexes of orbital apex crowding. However, CT provides little information on the disease activity, except through the observation of changes in sequential studies.
MRI can also be used to diagnose GO. However, the ability of MRI to provide evidence for DON has still not been explored, perhaps due to the difficulty of estimating the orbital bone volume and thereby determining the amount of orbital apex crowding. However, due to its greater ability to differentiate soft tissues, MRI has become a useful adjunct in imaging studies of GO patients when GO-related muscle involvement must be differentiated from other orbital conditions. Additionally, progressive technical refinements will likely enhance its usefulness, especially in the assessment of GO activity upon diagnosis and during treatment.
US is a well-established, accessible and low-cost technique widely used to detect extraocular muscle enlargement. However, the inability to perform an accurate evaluation of the orbital apex compared with CT or MRI has reduced the importance of US in the diagnosis and management of GO. Although it is still in an early developmental stage, CDI may become useful in the management of GO because CDI is the technique that best evaluates orbital venous congestion, a possible contributing factor during the active congestive stage of GO.
No potential conflict of interest was reported.
Gonçalves AC contributed to the review of the literature and writing of the manuscript. Gebrim EM revised the manuscript. Monteiro ML wrote and revised the manuscript.


