


To compare variations of plethysmographic wave amplitude (ΔPpleth) and to determine the percent difference between inspiratory and expiratory pulse pressure (ΔPp) cutoff values for volume responsiveness in a homogenous population of postoperative cardiac surgery patients.
INTRODUCTION:Intra-thoracic pressure variations interfere with stroke volume variation. Pulse pressure variations through arterial lines during mechanical ventilation have been recommended for the estimation of fluid responsiveness. Pulse oximetry may offer a non-invasive plethysmographic method to evaluate pulse pressure; this may be useful for guiding fluid replacement.
METHODS:Controlled, prospective study in cardiac surgery patients under controlled ventilation. Simultaneous digital recordings of arterial pressure and plethysmographic waves were performed. ΔPp, systolic pressure (ΔPs), ΔPpleth, and systolic component (ΔSpleth) were calculated. A ΔPp ≥ 13% identified fluid-responsive patients. Volume expansion was performed in responsive subjects. Systolic and amplitude components of pressure and plethysmographic waves were compared.
RESULTS:In 50 measurements from 43 patients, ΔPp was correlated with (Ppleth (r=0.90, p<0.001), (Ps (r=0.90, p<0.001), and (Spleth (r=0.73, p<0.001). An aArea under ROC curve (AUC) identified the fluid responsiveness thresholds: (Ppleth of 11% (AUC = 0.95±0.04), (Ps of 8% (AUC=0.93±0.05), and (Spleth of 32% (AUC=0.82±0.07). A (Ppleth value ≥ 11% predicted (Pp ≥ 13% with 100% specificity and 91% sensitivity. Volume expansion, performed in 20 patients, changed (Pp, (Ppleth, (Ps and (Spleth significantly (p<0.008).
CONCLUSIONS:ΔPpleth is well correlated with ΔPp and constitutes a simple and non-invasive method for assessing fluid responsiveness in patients following cardiac surgery.
Changes in intra-thoracic pressure interfere with venous return and cardiac output. Varying the arterial pressure through arterial lines during mechanical ventilation has been recommended for testing cardiovascular responsiveness during volume replacement in critically ill patients. As arterial systolic pressure and plethysmographic systolic component variations (ΔSpleth) could change similarly, ΔSpleth has been proposed as a useful tool for determining recruitable preload in the absence of invasive pressure monitoring.1
Arterial pulse pressure respiratory variation (ΔPp) has greater specificity and sensitivity for detecting cardiovascular responsiveness to volume expansion than ΔPs. Therefore, we originally demonstrated the usefulness of the respiratory variation of the plethysmographic waveform amplitude (ΔPpleth) to test cardiovascular responsiveness after volume expansion in critically ill septic, hypovolemic, postoperative and cardiac patients.2 Other studies have corroborated our findings, observing a strong relationship between ΔPp and Δ Ppleth in similar clinical settings.3,4
Although the aforementioned studies2–4 suggest that pulse oximetry may offer a noninvasive plethysmographic evaluation to guide fluid infusion, the correspondence between ΔPpleth and ΔPp has not been evaluated after fluid challenge or by cardiovascular responsiveness through cardiac output measurement. Along these lines, some studies5,6 have compared ΔPp and ΔPpleth with effective cardiac response measured by thermodilution and echocardiography, respectively. These studies demonstrated that ΔPpleth was useful for predicting fluid responsiveness, as were analogous indices derived from direct arterial blood pressure measurements.5,6 However, these studies also showed a clear discrepancy in ΔPpleth threshold values for fluid responsiveness identification.5,6 ΔPpleth values oscillated between 9% and 15%, and greater values were observed when septic patients predominated in the study populations.2–6
Hence, in this study we compared ΔPpleth and ΔPp, and determined the ΔPpleth cutoff value for volume responsiveness in a homogenous population of patients following cardiac surgery.
METHODSThis was a prospective, non-interventional study performed in a mixed intensive care unit of the Centro Hospitalar Unimed, Joinville, Brazil, from October 2003 to December 2004, after approval by the ethics committee. Written consent was obtained from each patient or next of kin. Forty-three consecutive adult postoperative cardiac surgery patients were enrolled.
Inclusion criteria: Patients were included if under mechanical ventilation and residual effects of sedation and muscle relaxation in a three hour window after cardiac surgery.
Exclusion criteria: Patients were excluded if presenting one or more of the following conditions: cardiac arrhythmias, spontaneous breathing movements, positive end-expiratory pressure (PEEP) higher than 8 cm H2O, tidal volume lower than 8 mL/kg or higher than 10 mL/kg, auto-PEEP and/or bronchospasm.7 Patients without informed consent were not included.
InterventionsAll patients were under controlled mode ventilation (Puritan Bennett 7200; Puritan Bennett, Carlsbad, Calif or Newport Wave E200; Newport Beach, Calif), tidal volume between 8 and 10 mL/kg, inspiratory/expiratory ratio of to maintain 1:3, PEEP between 5 and 8 cm H2O, and FiO2 arterial oxygen saturation around 95%. Additional sedative or muscle relaxant drugs were used at the discretion of the attending physician. All patients received an arterial line into the radial artery through a 20-gauge catheter (Abbocath, Becton Dickinson, Franklin Lakes, NJ). A double-lumen catheter (MAC; Multi-Lumen Access Catheter, Arrow International Inc, Bernville Road Reading, PA) was placed in the superior vena cava through the subclavian or internal jugular vein.
An oxymeter sensor was adapted to the indicator finger on the same side as the arterial catheterization. This oxymeter was a modular unit from a multi-parametric monitor (S/5; Datex-Ohmeda, Helsinki, Finland). Blood samples from central venous and arterial lines were obtained for blood gas analysis. All pressure transducers were referenced to mid-chest. Mechanical ventilator settings and vasoactive drug regimens were unchanged during the study protocol.
MeasurementsHeart rate (HR), respiratory rate (RR), central venous pressure (CVP), invasive mean arterial pressure (MAP), electrocardiography, plethysmographic waves of pulse oximetry, airway pressure, PEEP, and tidal volume were continuously monitored, and tracings were simultaneously registered. During a 60-second period, invasive arterial, pulse oximetry plethysmographic tracings, and time-pressure respiratory curves were simultaneously registered and transferred from a multi-parametric monitor (S/5; Datex-Ohmeda, Helsinki, Finland) to a personal computer (S/5 Collect; Datex-Ohmeda, Helsinki, Finland). During data acquisition, no spontaneous respiratory movements were present. Therefore, respiratory-induced changes in arterial and plethysmographic waves were due exclusively to the effects of mechanical ventilation on intrathoracic pressures.
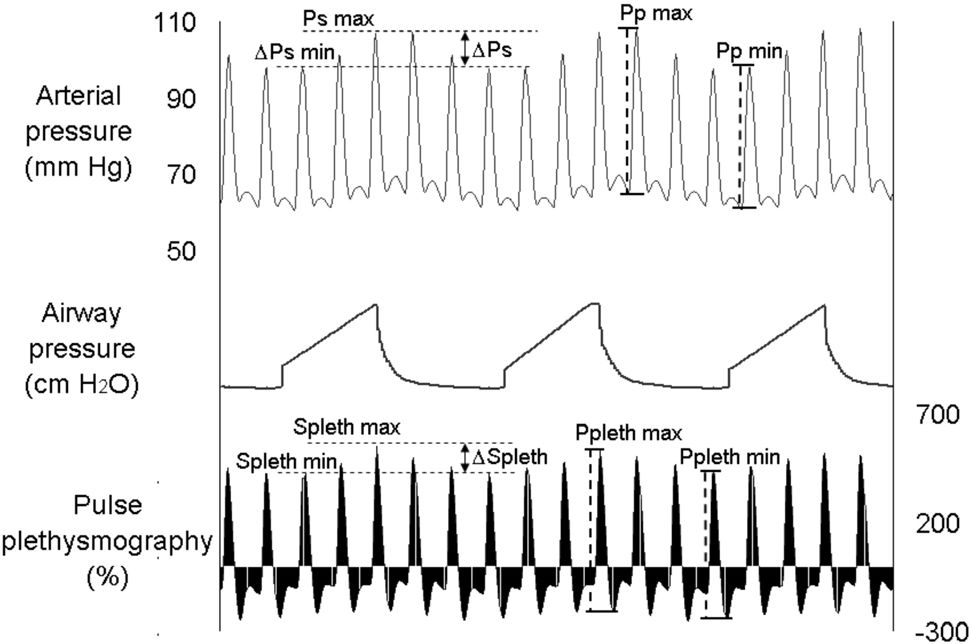
The analysis of pressure and plethysmographic waveforms was performed off-line on a personal computer. We first identified arterial pressure respiratory variation and the systolic and diastolic pressures (Figure 1). Then, systolic pressure and pulse pressure during inspiratory (Psmax and Ppmax) and expiratory (Psmin and Ppmin) phases were identified in each respiratory cycle. Respiratory variations in systolic pressure (ΔPs, in %) and pulse pressure (ΔPp, in %) were calculated using the following formulae:7

 and plethysmographic (bottom) waveforms during mechanical ventilation. The systolic pressure and systolic plethysmographic component are maximal during inspiration and decline proportionally in expiration. Similarly, the arterial pulse pressure and plethysmographic amplitude are maximal during inspiration and minimal during expiration. Psmax, maximal arterial systolic pressure; Splethmax, maximal plethysmographic waveform systolic component; Psmin, minimal arterial systolic pressure; Splethmin, minimal plethysmographic waveform systolic component; Ppmax, maximal arterial pulse pressure; Pplethmax, maximal plethysmographic waveform amplitude; Ppmin, minimal arterial pulse pressure; Pplethmin, minimal plethysmographic waveform amplitude.")
Simultaneous fluctuations in arterial pressure (top) and plethysmographic (bottom) waveforms during mechanical ventilation. The systolic pressure and systolic plethysmographic component are maximal during inspiration and decline proportionally in expiration. Similarly, the arterial pulse pressure and plethysmographic amplitude are maximal during inspiration and minimal during expiration. Psmax, maximal arterial systolic pressure; Splethmax, maximal plethysmographic waveform systolic component; Psmin, minimal arterial systolic pressure; Splethmin, minimal plethysmographic waveform systolic component; Ppmax, maximal arterial pulse pressure; Pplethmax, maximal plethysmographic waveform amplitude; Ppmin, minimal arterial pulse pressure; Pplethmin, minimal plethysmographic waveform amplitude.
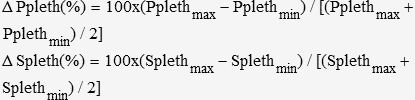
Plethysmographic waveforms were also evaluated using a similar methodology. Plethysmographic and arterial waveforms were simultaneously recorded and selected for analysis. The systolic component and the amplitude of the plethysmographic wave in the inspiratory phase (Splethmax and ΔPplethmax) and expiratory phase (Splethmin and ΔPplethmin) were determined. Respiratory variations in the systolic plethysmographic component (ΔSpleth, in %) and respiratory variations in plethysmographic amplitude (ΔPpleth, in %) were calculated using the following formulae:
Each unit of the plethysmographic scale displayed on the secondary y axis depicted in figure 1 corresponds to the percent relationship between the pulse sign and the static sign detected by pulse oximeter.
ΔPs, ΔPp, ΔPpleth and ΔSpleth were determined as the average of three respiratory cycles over one minute. From these measurements, a correlation coefficient was calculated, and a cutoff value for ΔPpleth and ΔSpleth was identified.
Fluid responsivenessWe have defined fluid responsiveness as a ΔPp ≥ 13% in a previous study,7 and non-fluid responsiveness as a ΔPp < 13%. We did not measure cardiac output or systolic volume.
Fluid challengeAccording to clinical judgment, patients were challenged with a normal saline infusion, ranging from 500 to 1000 mL. HR, MAP, CVP, ΔPs, ΔPp, ΔPpleth and ΔSpleth were analyzed before and after fluid challenge.
Clinical characteristicsEventual influences of clinical variables on pressure and plethysmographic traces relationship were examined. Clinical variables were: age, time on extra-corporeal circulation, temperature, MAP, CVP, hematocrit, ScvO2, PaCO2 and plethysmographic sign.
ReproducibilityThe agreement between two independent observers was evaluated to test the reproducibility of plethysmographic wave respiratory variation in volemic status determination.
Statistical analysisNCSS Statistical Software 2000 & PASS 2000: Power Analysis & Sample Size (NCSS Kaysville, Utah) was used for statistical analysis. Data were compared using Student’s t test for continuous variables. Ordinal data or non-normally distributed continuous data were compared by the nonparametric Wilcoxon rank sum test for paired observations. Correlations were determined using the Spearman test. The agreement between ΔPp and ΔPpleth for potential responsiveness was evaluated by Cohen kappa index. Receiver operating characteristic curves were generated for ΔPs, ΔPpleth, ΔSpleth (in %) and CVP (in mmHg) to identify the threshold values between fluid responders and non-responders. We performed a stepwise multiple regression to identify eventual influences of clinical variables on the pressure and plethysmographic trace relationship. The concordance between independent observers was evaluated by Bland-Altmann analysis, Spearman’s correlation test and the Cohen kappa index. Results are expressed as mean ± SD. All tests were two-tailed, and P < 0.05 was considered statistically significant.
RESULTSFifty simultaneous arterial pressure and pulse plethysmographic traces were obtained from 43 postoperative cardiac surgery patients. Table 1 shows demographic, hemodynamic, and ventilatory data.
Patients characteristics (n = 43)
| Gender | |
| Male | 28 |
| Female | 15 |
| Age, years | 61 ± 9 |
| Weight, kg | 72 ± 10 |
| APACHE II score | 9.2 ± 4.7 |
| Surgery | |
| Coronary graft | 36 |
| Valvular surgery | |
| Aortic | 5 |
| Mitral | 2 |
| Hemodynamics | |
| Heart rate, bpm | 92 ± 19 |
| MAP, mm Hg | 82 ± 11 |
| ScvO2, % | 56 ± 9.5 |
| CVP, mm Hg | 7.3 ± 3.5 |
| ΔPp, % | 17 ± 9 |
| ΔPs, % | 10 ± 4.1 |
| ΔPpleth, % | 15 ± 11 |
| ΔSpleth, % | 46 ± 32 |
| Mechanical ventilatory settings | |
| Tidal volume, mL/kg | 9 ± 1 |
| Peak pressure, cm H2O | 30 ± 3 |
| Respiratory rate, rpm | 14 ± 2 |
| PEEP, cm H2O | 5 ± 1 |
| PaCO2, mm Hg | 33 ± 6 |
| SaO2, % | 95 ± 2 |
APACHE II, Acute Physiology and Chronic Health Evaluation II; CVP, central venous pressure; ΔPp, pulse pressure respiratory variation; ΔPpleth, respiratory variation of plethysmographic wave amplitude; ΔPs, systolic pressure respiratory variation; ΔSpleth, systolic plethysmographic respiratory variation; MAP, mean arterial pressure; PEEP, positive end expiratory pressure; SaO2, arterial oxygen saturation; ScvO2, central venous oxygen saturation.
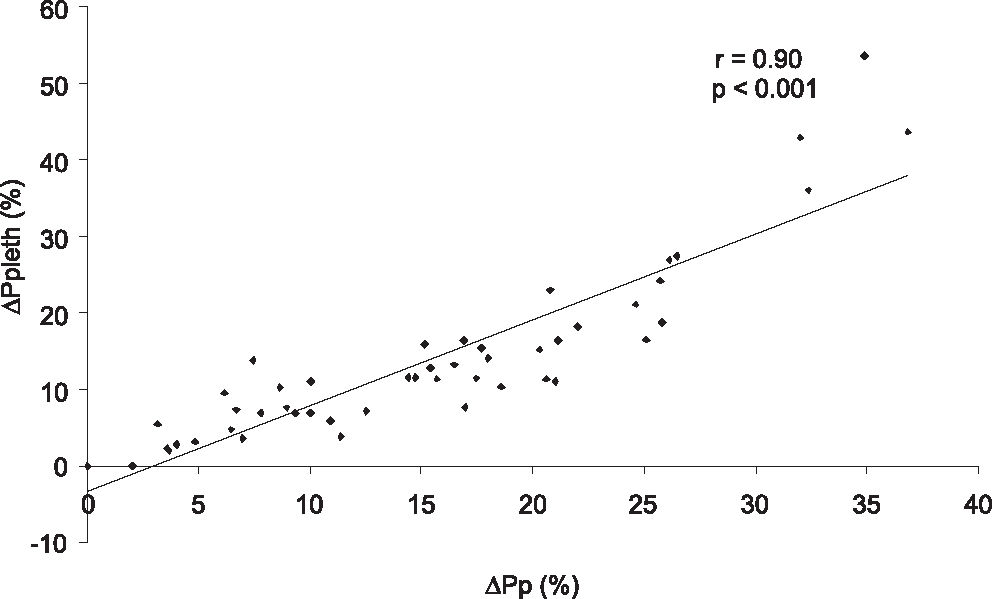
The linear correlation between ΔPp and ΔPpleth (r = 0.90, P < 0.001) is depicted in Figure 2. Other correlations were also observed: ΔPp and ΔPs (r = 0.90, P < 0.001), ΔPp and ΔSpleth (r = 0.73, P < 0.001), ΔPs and (Spleth (r = 0.61, p P < 0.001) and (Ppleth and (Spleth (r = 0.83, p P < 0.001).
, pulse pressure respiratory variation; ΔPpleth (%), respiratory variation of plethysmographic wave amplitude.")
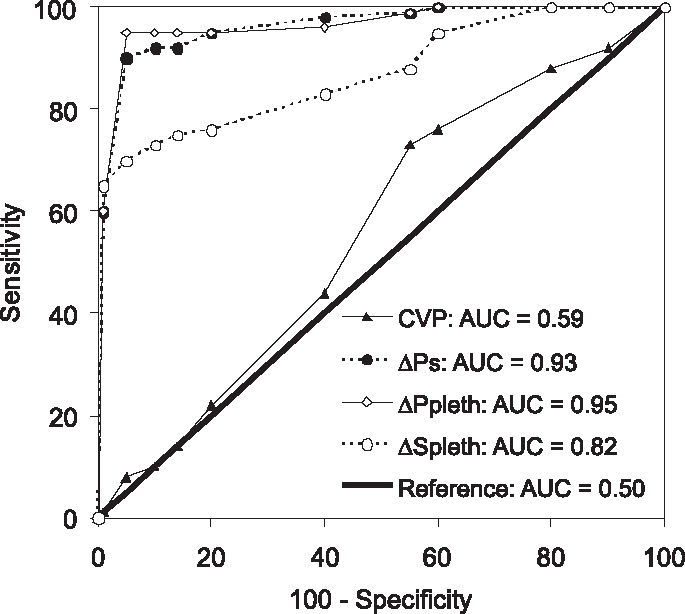
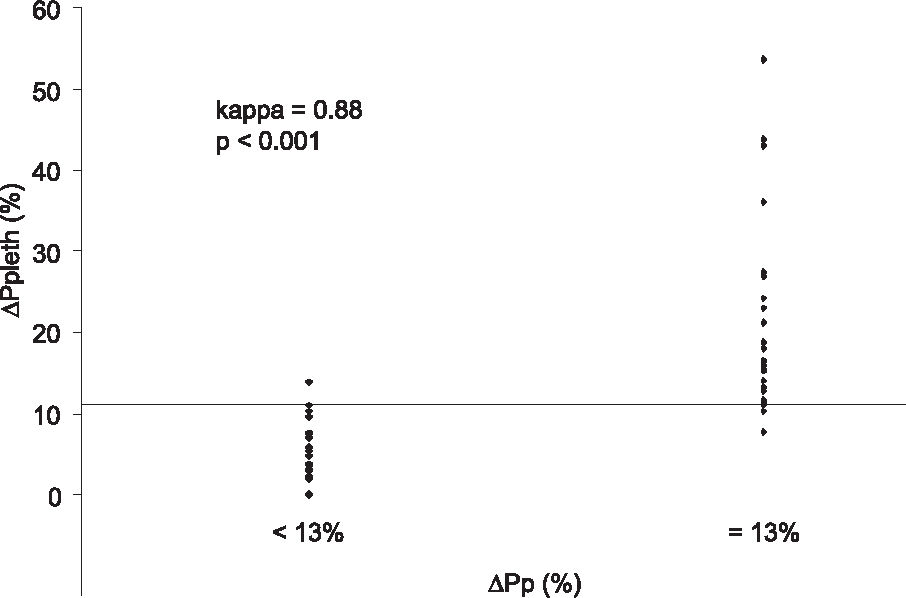
We determined 11% as the ΔPp cutoff value to discriminate PFR and NPFR, with a sensitivity of 93%, a specificity of 95%, and an area under the ROC curve (AUC) of 0.95 ± 0.04. The ΔPs threshold value was 8%, with a sensitivity of 95%, a specificity of 91% and an AUC of 0.93 ± 0.05. The ΔSpleth cutoff was 32%, with a sensitivity of 74%, a specificity of 91% and an AUC of 0.82 ± 0.07. Using a mean CVP of 8 mm Hg as the best cutoff value, we found an AUC of 0.59 ± 0.1, a sensitivity of 74% and a specificity of 45% (Figure 3). There was good agreement between ΔPp and ΔPpleth as shown by kappa test of 0.88, P < 0.001 for PFR identification (Figure 4). We evaluated this concordance using the kappa index to compare ΔPp and ΔPs (kappa = 0.85, P < 0.001), ΔPp and ΔSpleth (kappa = 0.60, P < 0.001), ΔPp and CVP (kappa = 0.02, P < 0.001).
 and non-potential fluid responders (ΔPp < 13%). AUC, area under ROC curve; CVP, central venous pressure; ΔPp (%), pulse pressure respiratory variation; ΔPpleth (%), respiratory variation of plethysmographic wave amplitude; ΔPs (%), systolic pressure respiratory variation; ΔSpleth (%), plethysmographic systolic component variation; ROC, receiver operating characteristic.")
ROC curves comparing the ability of ΔPpleth, ΔSpleth and CVP to reproduce ΔPp in discrimination of potential fluid responders (ΔPp ≥ 13%) and non-potential fluid responders (ΔPp < 13%). AUC, area under ROC curve; CVP, central venous pressure; ΔPp (%), pulse pressure respiratory variation; ΔPpleth (%), respiratory variation of plethysmographic wave amplitude; ΔPs (%), systolic pressure respiratory variation; ΔSpleth (%), plethysmographic systolic component variation; ROC, receiver operating characteristic.
 and potential fluid responders (ΔPp ≥ 13%). ΔPp (%), pulse pressure respiratory variation; Δ Ppleth (%), respiratory variation of plethysmographic wave amplitude.")
Good agreement between ΔPp and ΔPpleth. A 11% ΔPpleth cutoff value discriminated non-potential fluid responders (ΔPp < 13%) and potential fluid responders (ΔPp ≥ 13%). ΔPp (%), pulse pressure respiratory variation; Δ Ppleth (%), respiratory variation of plethysmographic wave amplitude.
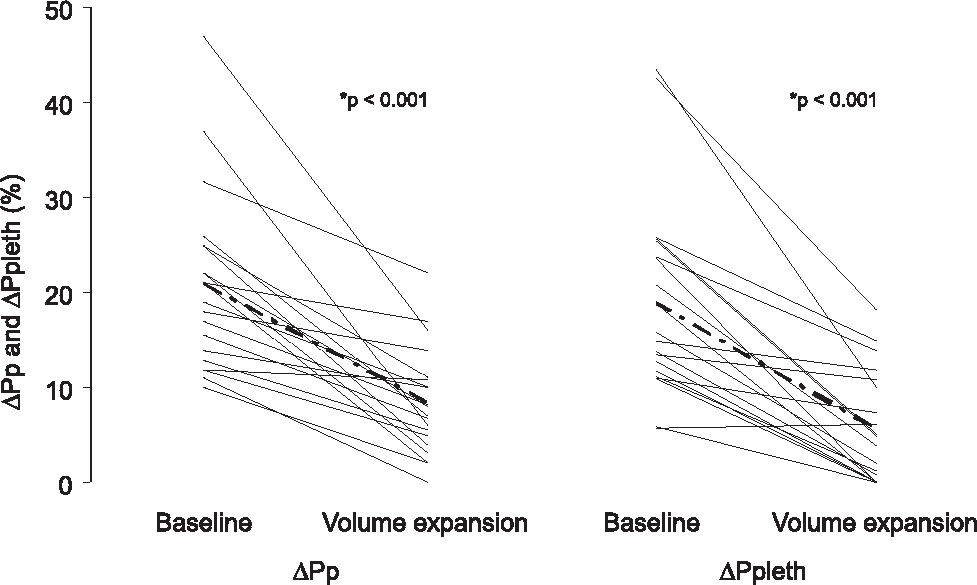
In 20 patients given fluid challenge, ΔPp and ΔPpleth decreased after fluid replacement, from 21% ± 9% to 8% ± 5% (P < 0.001) and from 19% ± 10% to 5% ± 4% (P < 0.001), respectively (Figure 5). ΔPs and ΔSpleth decreased from 12.3% ± 3.5% to 7% ± 2% (P < 0.001) and 66% ± 42% to 36% ± 24% (P < 0.008), respectively. Static parameters did not change after fluid infusion. CVP varied from 8 ± 3.5 to 9 ± 5 (P = 0.08), HR from 104 ± 26 to 102 ± 25 (P = 0.3) and MAP from 71 ± 13 to 77 ± 15 (P = 0.4). We determined the correlations between ΔPs and ΔSpleth before (r = 0.85, P = 0.02) and after fluid expansion (r = 0.23, P = 0.55), and between ΔPp and ΔPpleth before (r = 0.73, P = 0.03) and after infusion (r = 0.84, P = 0.004).
 in 20 patients. The dashed line shows mean decline of the parameters. *Wilcoxon rank sum test. ΔPp (%), pulse pressure respiratory variation; Δ Ppleth (%), respiratory variation of plethysmographic wave amplitude.")
PFR and NPFR clinical parameters are shown in Table 2. Age, Acute Physiology and Chronic Health Evaluation II (APACHE II) score, PaCO2, central venous oxygen saturation (ScvO2), heart rate, mean arterial pressure, and CVP were similar in both groups, while ΔPp, ΔPs, ΔPpleth and ΔSpleth were all statistically different (P < 0.001).
Clinical parameters according volume status
| ΔPp < 13% (n=17) | ΔPp ≥ 13% (n=26) | Pa | |
|---|---|---|---|
| Age, years | 60 ± 10 | 62 ± 8 | 0.45 |
| APACHE II | 9 ± 3 | 10 ± 5 | 0.57 |
| PaCO2, mm Hg | 34 ± 5 | 33 ± 7 | 0.85 |
| ScvO2, % | 54 ± 10 | 58 ± 8.5 | 0.59 |
| HR, bpm | 86 ± 15 | 97 ± 20 | 0.11 |
| MAP, mm Hg | 82 ± 11 | 82 ± 12 | 0.51 |
| CVP, mm Hg | 7 ± 3.5 | 7 ± 3.4 | 0.51 |
| ΔPp, % | 7 ± 2.8 | 22 ± 6 | < 0.001 |
| ΔPs, % | 7 ± 2.4 | 12 ± 4.5 | < 0.001 |
| ΔPpleth, % | 6 ± 2.5 | 21 ± 11 | < 0.001 |
| ΔSpleth, % | 23 ± 8 | 58 ± 35 | < 0.001 |
APACHE II, Acute Physiology and Chronic Health Evaluation II; CVP, central venous pressure; ΔPp, pulse pressure respiratory variation; ΔPpleth, respiratory variation of plethysmographic wave amplitude; ΔPs, systolic pressure respiratory variation; ΔSpleth, systolic plethysmographic respiratory variation; HR, heart rate; MAP, mean arterial pressure; SaO2, arterial oxygen saturation; ScvO2, central venous oxygen saturation.
Individual clinical characteristics did not influence the dynamic variables. Using a stepwise multiple regression we found that extracorporeal circulation time showed a significant positive correlation with ΔPp and ΔPpleth (P < 0.001), but not with ΔPs or ΔSpleth (P = 0.33). There were no significant differences in the correlation between the behavior of ΔPpleth and (Spleth in relation to (Pp in 11 patients (P = 0.1) receiving vasopressors (noradrenaline, N=3, 0.5 ± 0.15 mcg/kg/min or dopamine, N = 8, 4.6 ± 2 mcg/kg/min), in 5 patients (P = 0.32) receiving dobutamine (6.6 ± 2.43 mcg/kg/min), or in 6 patients (P = 0.34) receiving nitroglycerin (0.4 ± 0.2 mcg/kg/min).
The inter-observer ΔPp reproducibility analysis showed a good correlation (r = 0.92, P < 0.001). The mean difference between observers was 1.0 ± 3.2, with a superior limit of 7.4 and an inferior limit of −5.2. The agreement between observers for discrimination of PFR from NPFR was also good (kappa = 0.92; P < 0.001). A similar agreement was found for ΔPpleth inter-observer analysis (r = 0.94, P < 0.001; mean difference = 1.0 ± 3.3, superior limit = 7.2, inferior limit = −5.7; and kappa = 0.85; P < 0.001).
DISCUSSIONWe were able to demonstrate a correlation between pulse oximetry plethysmographic wave amplitude and arterial pulse pressure variations induced by respiratory cycles in cardiac surgery patients. Therefore, the non-invasive plethysmographic wave amplitude respiratory variation measurement could potentially be used to detect patients who could benefit from additional fluid loading.
Arterial pressure variation has long been considered an accurate surrogate marker of fluid responsiveness.7–15 The role of ΔPs as a marker of volemic status was initially suggested by Perel et al. in 1987.13 More recently, Michard et al. demonstrated the usefulness of the ΔPp measurement in showing fluid responsiveness in septic patients.7 Although ΔPp measurement has been considered a minimally invasive technique, it is time-consuming and associated with rare but potentially harmful complications secondary to arterial cannulation, including hematoma, infection and thrombosis.1 In contrast, since the pulse oximetry plethysmographic signal resembles the peripheral arterial pressure waveform and the degree of respiratory variation in the pulse oximetry wave is close to the degree of respiratory arterial pulse pressure variation, this measurement could be a useful and noninvasive alternative to ΔPp.16
The recognition of blood flow by the pulse oximetry plethysmographic sensor results from light emission by diodes (light emitting diode - LED). The detected pulsatility results from attenuation of the cyclic light energy transmitted to or reflected by the tissues where the sensor is applied. The light absorption by hemoglobin within the arteries and arterioles increases during the systole and decreases during diastole, due to the pulsatile variation of the blood volume and erythrocyte mass under the sensor.16–18 The analysis of arterial and/or pulse plethysmographic wave tracings has been proposed as a tool to evaluate the relationship between plethysmographic wave behavior and the presence of paradoxical pulse.19,20 Dorlas et al.21 and Partridge et al.22 have shown correlations in the variation of pulse plethysmographic wave with preload and systolic volume. In addition, Shamir et al.1 observed a good correlation between ΔPs and ΔSpleth after withdrawal of 10% of blood volume and reinfusion. However, we must consider that while ΔPs results from systolic volume variation and the impact of inspiratory pleural pressure on the aorta, ΔPp reflects only systolic volume variation. Hence, ΔPs is more sensitive but less specific than ΔPp in detecting fluid load responsiveness, explaining the lower performance of (Spleth in comparison to (Ppleth).7
The correlation between (Ppleth and (Pp was pioneered by our group in 2004.2 Later, Cannesson et al.,3 Natalini et al.,4 and Feissel et al.6 reported similar correlation coefficients to those we found. In the present study, interobserver reproducibility analyses revealed an excellent linear correlation and a strong agreement between independent observers, highlighting the reproducibility of (Ppleth. Second, among the several clinical variables that could interfere with the proposed comparisons, the extracorporeal circulation time was the only one related to the magnitude of both (Pp and (Ppleth. It is well known that extracorporeal circulation elicits an inflammatory response, reduces vascular tonus and increases endothelial permeability. These factors could alter (Pp and (Ppleth behavior in the same way).23,24
Third, we evaluated ΔPpleth, ΔSpleth, ΔPp, and ΔPs in a homogeneous group of cardiac surgery patients, finding a ΔPpleth cutoff value of 11%. Previous studies enrolling a more heterogeneous population reported different cutoff values for ΔPpleth, ranging from 9% and 15%, for a considered gold standard ΔPp value of 13%.2–6 Natalini et al.4 observed a threshold of 9% in a general population. In a subsequent study in which more than 70% of patients were septic, a ΔPpleth cutoff value of 15% was reported by addressing cardiovascular responsiveness through thermodilution.5 We reported a ΔPpleth cutoff value of 10% in a study in which 15% of patients were septic.2 Recently, Feissel et al. showed a (Ppleth cutoff of 14% using echocardiographic cardiac output measurements in septic patients.6 Wyffels et al. included only cardiac surgery patients and found a cutoff value of 11%, as reported here.25 Apparently, greater values of (Ppleth allow the identification of cardiovascular responsiveness among septic patients, who frequently present widespread vasodilation. In agreement with Shamir et al,1 we consider that the high sensitivity and variability of the plethysmographic signals are likely caused by humoral and neurogenic factors.1,18,19 The (Ppleth amplification in relation to (Pp could be explained by the humoral response increasing the arteriolar compliance during arterial pressure measurement.
Fourth, there were concomitant changes in (Ppleth, (Spleth, (Pp and (Ps before and after volume challenge. However, there are some limitations to this aspect of the study, including the lack of left ventricular function analysis and the fact that we did not measure cardiac output directly in order to discriminate fluid responders from non-responders, since this is not routinely done in our hospital. We therefore classified our patients as “potential responders” ((Pp ≥ 13%) and “potential non-responders” ((Pp < 13%), based on studies in septic patients and cardiac surgery patients.9,26,27 In a recent publication, Natalini et al.5 performed thirty-two fluid challenges in 22 hypotensive patients who were also monitored with a pulmonary artery catheter, showing that (Ppleth could predict cardiac output increase by administering fluid).
It must be noted the available pulse plethysmographs have limitations such as the lack of scales in the screen, and have fixed mechanisms to attenuate or increase the signal according to intensity.16–19 We believe that new pulse oximetry devices could be easily adapted or developed if this concept is widely accepted. Other limitations have also been attributed to dynamic indicators of cardiovascular responsiveness, including movement artifacts, peripheral vasoconstriction and cutaneous pigments.16,28 Although our findings were obtained under highly controlled conditions, mechanical ventilation and pulse plethysmography are frequently required for critically ill or complex surgical patients.
We conclude that ΔPpleth of 11% or more accurately identifies respiratory pulse pressure variations greater than 13% in post-cardiac surgery patients under mechanical ventilation. In this homogeneous population, ΔPpleth has the potential to determine the response to fluid challenge in critically ill patients in the absence of an arterial line.