


The aim of this study was to characterize the microscopic damage to the corpus callosum in relapsing-remitting multiple sclerosis (RRMS) with diffusion tensor imaging and to investigate the correlation of this damage with disability. The diffusion tensor imaging parameters of fractional anisotropy and mean diffusivity provide information about the integrity of cell membranes, offering two more specific indices, namely the axial and radial diffusivities, which are useful for discriminating axon loss from demyelination.
METHODBrain magnetic resonance imaging exams of 30 relapsing-remitting multiple sclerosis patients and 30 age- and sex-matched healthy controls were acquired in a 3T scanner. The axial diffusivities, radial diffusivities, fractional anisotropy, and mean diffusivity of five segments of the corpus callosum, correlated to the Expanded Disability Status Scale score, were obtained.
RESULTSAll corpus callosum segments showed increased radial diffusivities and mean diffusivity, as well as decreased fractional anisotropy, in the relapsing-remitting multiple sclerosis group. The axial diffusivity was increased in the posterior midbody and splenium. The Expanded Disability Status Scale scores correlated more strongly with axial diffusivities and mean diffusivity, with an isolated correlation with radial diffusivities in the posterior midbody of the corpus callosum. There was no significant correlation with lesion loads.
CONCLUSIONNeurological dysfunction in relapsing-remitting multiple sclerosis can be influenced by commissural disconnection, and the diffusion indices of diffusion tensor imaging are potential biomarkers of disability that can be assessed during follow-up.
Medical imaging, especially magnetic resonance imaging (MRI), has gained a significant role in the diagnosis and follow-up of multiple sclerosis (MS) patients. However, the conventional macroscopic lesion burden approach has demonstrated poor correlation with the disability status (1,2). One of the possible explanations for this clinicoradiological paradox is related to the histopathological heterogeneity of the T2 hyperintense lesions, which can represent different stages of edema, demyelination, axon loss, and remyelination (2). Other factors to be considered are the diffuse inflammatory and degenerative processes occurring outside the macroscopic lesions in the normal-appearing white (NAWM) and gray (NAGM) matter (3,4). Recently, the significance of the accumulation of microscopic demyelination and axon loss in these compartments has been emphasized as a factor associated with the progression of brain atrophy and neurological deficits in MS (5,6).
This hidden microscopic damage started to be appreciated with the use of diffusion tensor imaging (DTI). The main scalar maps derived from the diffusion tensors, namely fractional anisotropy (FA) and mean diffusivity (MD), enable the indirect assessment of tissue microarchitecture and complexity, which may aid in the detection of myelin sheath and cell membrane damage (7). The combination of the three eigenvalues (λ1, λ2, and λ3), derived from the diffusion tensor eigenvectors offers two other and more specific parameters that can be assessed, namely axial diffusivity (AD) and radial diffusivity (RD), which are known to represent axon loss and demyelination, respectively (8,9).
Callosal lesions are a sensitive marker for demyelinating disease, especially in MS (10), and they are used as a relatively early pathological sign. Due to its periventricular location and the close relationship with the subependimal veins, the corpus callosum (CC) is susceptible to early inflammation and demyelination. However, more recent studies have discussed the idea that the commissural disconnection is only a consequence of the primary demyelinating plaques. Different hypotheses link the white matter injury to Wallerian degeneration secondary to distant accumulation or progression of lesions, to primary axonopathy, or to intrinsic microscopic damage of the NAWM (11,12). Histological post-mortem and animal model studies have proven that the CC has a particular regional composition, combining fibers with variable thickness and arrangements (11,13,14), following a topographic and functional specialization with a distinct orientation, number, and velocity of their connections. The CC interhemispheric communication plays an important role in cognitive, language, executive, volitional, and working memory functions (15,16). It also contributes to motricity (17). Because of these facts, we hypothesized that callosal injury may be correlated to functional and clinical disability in MS. In fact, our previous work revealed a significant correlation between commissural MD and EDSS (18). However, to explore the anatomical and functional specialization of callosal fibers, the present study aimed to obtain a regional description of DTI characteristics of five segments of the CC in relapsing-remitting MS (RRMS) patients before initiation of immunomodulatory therapy.
PATIENTS AND METHODSSubjectsThirty recently diagnosed RRMS patients (21 females; mean age 30.5±8.6 years, range 19-48 years) were included. None of the patients had received immunomodulatory therapy before the MRI examination and had been steroid-free for at least 90 days. The mean disease duration (DD) was 2.4±2.0 (range 0.3-9.5) years. Clinical disability was assessed by the Expanded Disability Status Scale (EDSS) (19) and functional systems scale (FSS), which were measured by an experienced neurologist (TFJ) who was blinded to the MRI results.
Thirty healthy controls (HC) (23 females; mean age 32.4±7.4 years, range 21.5-55.6 years) were submitted to the same imaging protocol. The study was approved by the local ethics committee (CAPPESQ 0450/09). All subjects agreed to participate in the study by signing a written informed consent.
MRI and DTI acquisitionsBrain exams were acquired with an 8-channel head coil in a 3T magnetic resonance scanner (Intera Achieva, PHILIPS Healthcare, Best, The Netherlands). Fast fluid inversion recovery (FLAIR) axial images (time of echo (TE)/time of repetition (TR) = 130/8613 ms; time of inversion (TI) = 2800 ms; field of view (FOV) = 230×183×142 mm; matrix = 252×210 ms; slice thickness = 3 mm; gap = 0.3 mm) were used to assess the T2-FLAIR lesion loads.
The DTI acquisition included a diffusion-weighted (DW) spin-echo (SE) single-shot echo planar imaging (EPI) sequence, with b-values of 0 and 1000 s/mm2, 32 diffusion-encoding directions, FOV of 256×256 mm, and a matrix size of 128×128 covering the whole brain with 2-mm contiguous slices. Obtained DTI data were spatially co-registered with the scanner software and post-processed with BioImage Suite 3.0 (http://www.bioimagesuite.org) to generate the diffusion tensor (DT), fractional anisotropy (FA), mean diffusivity (MD), and eigenvalue maps. The main eigenvalue (λ1) represents the axial diffusivity (AD) parallel to the axon fibers. The radial diffusivity (RD) was automatically calculated by the software and corresponds to the mean of the two other eigenvalues ([λ2+λ3]/2).
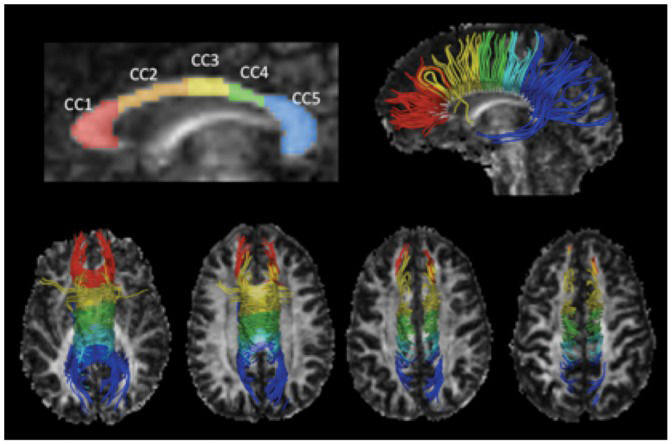
Corpus callosum and white matter lesion segmentationThe CC was manually segmented in the individual FA maps following the algorithm proposed by Hofer and Frahm (20), which is based on the anatomical and functional connectivity between cortical areas (Figure 1. A low FA threshold of 0.2 was used to avoid cerebral spinal fluid (CSF) or surrounding structure contamination. The AD, RD, FA, and MD scalar parameters were measured for each region of interest (ROI).

Corpus callosum segmentation and tractography. The FA map and the CC segmentation model of one healthy subject are illustrated in the top-left of the figure. The top-right image shows the sagittal 3D view of WM tracts derived from the segmented CC projected onto the FA map. The four bottom images show the superior view of the fibers projected in ascending axial slices. CC1: rostrum and genu, connects with the prefrontal and orbitofrontal cortices; CC2: anterior midbody, connects with the premotor and supplementary motor areas; CC3: posterior midbody, connects with the primary motor areas; CC4: isthmus, connects with the primary sensory area; CC5: splenium, connects with the parietal and temporal lobes and the visual cortex.
An experienced radiologist (CMR) manually delineated the T2-FLAIR hyperintense lesions, including white matter (WM) foci of 3 mm or more in the greater axis. The CC T2-FLAIR lesions were delineated on the midsagittal plane of the CC corresponding to the area of segmentation in the FA maps.
Statistical analysisComparisons between groups (RRMSxHC) for the CC DTI indices were performed using the Mann-Whitney non-parametric test. Correlations were tested using the Spearman's test. After Bonferroni correction, the results with p<0.01 were considered significant, while p-values between 0.05 and 0.01 were considered trends.
Multiple regression analysis was performed using the EDSS score as the dependent variable, and T2-FLAIR lesion loads, DTI results, and demographic data as independent factors. A p<0.05 was considered significant for individual variables.
RESULTSClinical characteristics and macroscopic lesions in RRMSThe disability scores and FSS sub-scores are summarized in Table 1. The functional system most often affected was the pyramidal system, followed by the sensory and mental systems.
Disability scores in relapsing-remitting multiple sclerosis patients.
| Mean score ± SD (range) | N/percentage (score≠0) | |
|---|---|---|
| EDSS score (0-10) | 1.1±0.9 (0-3) | 22/73.3% |
| FSS sub-scores (0-5) | ||
| Visual | 0.2±0.4 (0-1) | 5/16.7% |
| Brainstem | 0.0±0.2 (0-1) | 1/3.3% |
| Pyramidal | 0.5±0.8 (0-3) | 10/33.3% |
| Cerebellar | 0.1±0.4 (0-2) | 1/3.3% |
| Sensory | 0.4±0.7 (0-2) | 7/23.3% |
| Sphincters | 0.0±0.2 (0-1) | 1/3.3% |
| Mental | 0.3±0.6 (0-2) | 6/20% |
EDSS: Expanded Disability Status Scale; FSS: functional systems scale; RRMS: relapsing-remitting multiple sclerosis.
The scores are expressed as the mean ± standard deviation (SD) (range)
N: number of patients with abnormal scores.
The mean T2-FLAIR lesion load was 14.67±11.1 cm3 (range 2.5-55.3 cm3), and the mean CC T2-FLAIR lesion load was 0.81±0.45 cm3 (range 0.17-2.2 cm3) in the RRMS patients, which did not correlate with age or gender.
Regional CC differences between the RRMS and HC groupsThe CC DTI results for the RRMS and HC groups are shown in Table 2. The DTI data revealed a significant increase in RD and MD in all of the CC segments in the RRMS group. The CC AD was significantly increased in the RRMS group only in CC5, with an increasing trend in CC3. The FA was significantly decreased in the RRMS group, except in CC3.
Diffusion tensor imaging indices and volumetric results in the corpus callosum segments in the relapsing-remitting multiple sclerosis and healthy control groups.
| CC1 | CC2 | CC3 | CC4 | CC5 | CC total | ||
|---|---|---|---|---|---|---|---|
| AD (10-3 mm2/s) | RRMS | 1.69±0.1 | 1.56±0.2 | 1.54±0.1 | 1.59±0.1 | 1.77±0.1 | 1.66±0.1 |
| HC | 1.65±0.1 | 1.50±0.1 | 1.48±0.1 | 1.55±0.1 | 1.71±0.1 | 1.61±0.1 | |
| p-value | 0.12 | 0.06 | 0.02∗∗ | 0.23 | 0.01∗ | 0.007∗ | |
| RD (10-3 mm2/s) | RRMS | 0.48±0.1 | 0.51±0.1 | 0.46±0.1 | 0.50±0.1 | 0.45±0.1 | 0.48±0.1 |
| HC | 0.42±0.1 | 0.44±0.04 | 0.41±0.04 | 0.44±0.04 | 0.37±0.04 | 0.42±0.03 | |
| p-value | <0.001∗ | <0.001∗ | 0.003∗ | <0.001∗ | <0.001∗ | <0.001∗ | |
| FA | RRMS | 0.67±0.1 | 0.62±0.1 | 0.65±0.1 | 0.63±0.1 | 0.71±0.04 | 0.66±0.04 |
| HC | 0.71±0.0 | 0.66±0.03 | 0.67±0.04 | 0.67±0.04 | 0.75±0.03 | 0.70±0.02 | |
| p-value | 0.001∗ | 0.003∗ | 0.08 | 0.006∗ | <0.001∗ | <0.001∗ | |
| MD (10-3 mm2/s) | RRMS | 0.88±0.1 | 0.86±0.1 | 0.82±0.1 | 0.87±0.1 | 0.89±0.1 | 0.88±0.1 |
| HC | 0.83±0.1 | 0.79±0.1 | 0.77±0.1 | 0.81±0.1 | 0.82±0.04 | 0.81±0.03 | |
| p-value | 0.002∗ | 0.002∗ | <0.001∗ | 0.003∗ | <0.001∗ | <0.001∗ |
Mann-Whitney non-parametric test. The group results are expressed as the mean ± standard deviation (SD). ∗ Significant differences between groups; ∗∗ trends;
AD: axial diffusivity; CC: corpus callosum; CC1: genu; CC2: anterior midbody; CC3: posterior midbody; CC4: isthmus; CC5: splenium; CC total: corpus callosum total; FA: fractional anisotropy; HC: healthy control group; MD: mean diffusivity;
RD: radial diffusivity; RRMS: relapsing-remitting multiple sclerosis.
There was no correlation between DTI indices with age and disease duration, except in the CC5 where AD correlated with disease duration (p = 0.008). There were weak to moderate correlations between the T2-FLAIR whole-brain lesion load and RD, MD, and FA of the CC (Table 3.
Correlation between disease duration, lesion loads, and diffusion tensor imaging indices of the corpus callosum.
| DD | T2/FLAIR | T2/FLAIRCC | ||
|---|---|---|---|---|
| CC total | AD | -0.11 (0.56) | 0.15 (0.42) | 0.33 (0.07) |
| RD | 0.11 (0.55) | 0.54 (0.002)∗ | 0.39 (0.03)∗∗ | |
| FA | -0.08 (0.67) | -0.54 (0.002)∗ | -0.31 (0.09) | |
| MD | 0.04 (0.82) | 0.48 (0.007)∗ | 0.46 (0.01)∗ | |
The results are expressed as the Spearman rank, with the p value in brackets.
AD: axial diffusivity; CC: corpus callosum; CC1: genu; CC2: anterior midbody; CC3: posterior midbody; CC4: isthmus; CC5: splenium; CC total: corpus callosum total; DD: disease duration; FA: fractional anisotropy; HC: healthy control group; MD: mean diffusivity; RD: radial diffusivity; T2/FLAIR: whole-brain T2-FLAIR lesion load; T2/FLAIR CC: corpus callosum T2-FLAIR lesion load.
There was no significant correlation between the EDSS scores and the lesion loads, age, or disease duration.
The EDSS scores showed correlations with AD (Table 4, which was more significant in segments CC2 and CC5. A similar correlation was present with MD for segments CC3 and CC5. The regression coefficient using RD of the CC segments as independent factors did not reach statistical significance, but the individual analysis of the RD in CC3 showed a significant correlation with the EDSS score. The FA regression reached a significant level (R2: 0.31/p-value: 0.002) without significant correlations with any specific segment.
Multiple regression analysis using the Expanded Disability Status Scale as a dependent variable and diffusion tensor imaging indices as independent factors.
| R2: 0.49/p-value: 0.01∗ | ||||
|---|---|---|---|---|
| B | Standard error | t | p-value | |
| AD CC1 | 0.60 | 2.39 | 0.25 | 0.80 |
| AD CC2 | 4.62 | 1.49 | 3.09 | <0.001∗ |
| AD CC3 | 0.48 | 1.83 | 0.26 | 0.80 |
| AD CC4 | -0.80 | 1.98 | -0.40 | 0.69 |
| AD CC5 | 6.24 | 1.83 | 3.40 | <0.0001∗ |
| AD CC total | -6.82 | 5.33 | -1.28 | 0.21 |
| R2: 0.49/p-value: 0.01∗ | ||||
|---|---|---|---|---|
| B | Standard error | t | p-value | |
| MD CC1 | 4.77 | 3.64 | 1.31 | 0.20 |
| MD CC2 | 4.05 | 2.24 | 1.81 | 0.08 |
| MD CC3 | 6.83 | 2.94 | 2.32 | 0.03∗ |
| MD CC4 | -3.34 | 3.31 | -1.01 | 0.32 |
| MD CC5 | 9.78 | 3.09 | 3.16 | 0.001∗ |
| MD CC total | -14.78 | 8.12 | -1.82 | 0.08 |
| R2: 0.32/p-value: 0.12 | ||||
|---|---|---|---|---|
| B | Standard error | t | p-value | |
| RD CC1 | 7.07 | 1.38 | 1.97 | 0.06 |
| RD CC2 | 1.09 | 2.25 | 0.48 | 0.63 |
| RD CC3 | 7.00 | 2.96 | 2.37 | 0.03∗ |
| RD CC4 | -4.34 | 2.80 | -1.55 | 0.13 |
| RD CC5 | 4.22 | 4.01 | 1.05 | 0.30 |
| RD CC total | -9.02 | 7.40 | -1.22 | 0.23 |
EDSS: Expanded Disability Status Scale; ∗Significant correlation
AD: axial diffusivity; MD: mean diffusivity; RD: radial diffusivity
CC: corpus callosum; CC1: genu; CC2: anterior midbody; CC3: posterior midbody; CC4: isthmus; CC5: splenium; CC total: corpus callosum total.
p-value: significance level of the correlation; p: significance level of the regression of each individual variable; t: partial correlation of each variable.
In our study, the RRMS group presented increased MD and decreased FA in almost all of the segments of the CC, with a diffuse increase in RD. The AD was only changed in the posterior midbody (CC3) and in the splenium (CC5). Based on previous interpretations of DTI indices (9,21), those findings could reflect the presence of microscopic disruptions of the CC fibers, characterized by diffuse demyelination, but there were only regional signs of axonal loss.
Although several studies have documented early signs of axonopathy and axonal loss in MS (5,22), the mechanisms underlying this pathological process remain unclear. The main hypotheses still being discussed are that axonal injury is a product of intrinsic axonopathy or is secondary to Wallerian degeneration related to fiber transection in distant MS plaques (11,23). Evangelou et al. (11), in a histological post-mortem study, demonstrated that the degree of axon loss in the CC of MS subjects correlated to the concentration of lesions in the regional fiber projections, reinforcing the Wallerian degeneration hypothesis.
Previous studies highlighted that MS lesions tend to accumulate first in the temporal, parietal inferior, and occipital areas (24). As the fibers of the splenium of the CC are projected to those areas, it is feasible to correlate callosal degeneration with the regional lesion accumulation. Controversially, in our study, the AD of the CC was not correlated with the macroscopic lesion loads, although it was correlated with the RD, FA and MD. It is possible that the macroscopic lesions represent areas with increased inflammation and demyelination, which can precede the axon loss. Myelin breakdown can predispose axons to secondary injury either by exposing the neuronal membranes to T cells and other inflammatory aggressions or by the failure of neurotropic and biochemical actions derived from the oligodendrocytes (25). The other hypothesis is that the axon loss is secondary to microscopic damage in the NAWM, leading to a secondary axonopathy not directly linked to lesion load changes (22,23).
The CC has a complex and heterogeneous fiber composition. It is thicker and more myelinated in the primary motor, sensory, and visual areas and thinner and less myelinated in associative areas (13,14). These results suggest a greater susceptibility of these latter fibers to early degeneration (11). The fibers of the splenium of the CC are comprehended in several associative pathways, associated with memory and cognitive functions (15), which, according to the theory of Evangelou et al. (11), could be more vulnerable to tissue degeneration. According to this point of view, it is intriguing to find increased AD in the posterior midbody of the CC (CC3) because this segment connects the primary motor area and is supposedly composed of highly myelinated fibers.
Partial volume effects with CSF and surrounding structures can affect the DTI measurements by increasing the MD and directional diffusivities (26). However, in our measurements, the low anisotropy threshold and manual segmentation most likely reduced these effects. Additionally, the high-anisotropy areas of the brain, such as the CC and cortical spinal tract, are not as prone to partial volume effects as the low-anisotropy tissues (26). There are still controversial findings regarding directional diffusivity in MS. Most reports demonstrate diffuse increases in MD and RD and decreases in FA (26–28), but they either show a regional increase in (27,28) or unchanged (26) AD. Henry et al. (26) believed that the DTI measurements should be performed in the NAWM, arguing that the degree of tissue destruction and inflammation within the lesions adds partial volume effects to the free water pool and increases the MD, with an overestimated shift in the AD (26). However, other studies performed on the NAWM revealed increases in the AD (27,28), and the authors tended to correlate these increases with axonal changes, showing that other factors (intrinsic disease differences, sample size, or post-processing strategies) can be responsible for these discrepancies. Despite the controversies, all of the previous studies agree that the directional diffusivities provide more specific insights to explain the MS pathology than the isolated FA and MD analyses.
In our study, we decided to analyze the complete CC midsagittal section to evaluate the correlation between the DTI changes in the entire fiber bundle and disability. Despite the known property of myelin in increasing the velocity of neuronal conduction, it has been proposed that disability progression in MS is mostly mediated by axon loss, even in the earliest stages of the disease (22). Stronger correlations were found between the EDSS score and AD of the CC, which could indicate an indirect correlation of this DTI marker with neurological decline and, consequently, with degeneration or axon loss. The splenium has widespread connections to the parietal, occipital, and temporal lobes. It is possible that the AD increase in the CC5 is related to mental, somatosensory, or visual sub-scores. Similarly, the abnormalities in the anterior midbody (CC2), which comprehends fiber projections to the supplementary motor areas and participates in more complex motor functions (29), are possibly responsible for the initial motor impairment in MS. Although the modern concepts in MS emphasize the axon loss as the key factor in disability progression, demyelination can play a stronger role in neurological conduction of the highly myelinated fibers. Interestingly, the EDSS score of our sample presented an isolated significant correlation with the RD in the posterior midbody (CC3). Histopathological and MRI connectivity studies (20) have shown interhemispheric projections of this segment to primary motor areas, which presumably have some influence on the pyramidal functions (17).
However, these functional correlations must be interpreted with caution. First, the CC segmentation used is based on a proportion of an average population (20), and the cortical projections of individual fiber bundles in each subject can have subtle differences. Second, the EDSS score is heavily weighted toward locomotor disability and may not be the ideal tool to investigate initial neurological decline and to correlate it with microscopic damage in associative pathways (30). Despite the limitations of the EDSS, it is still a simple and accessible tool with which to follow-up MS patients, highlighting important clinical milestones (31). In our sample, the patients with greater disability tended to have greater increases in AD in some CC segments, which can correspond to parietal-temporal and frontal areas. A previous study used the cortical thickness to assess brain degeneration in MS and showed that a gradient of degeneration that initiated in the parietal-temporal lobes and progressed to frontal areas correlated with EDSS levels (32) (with a theoretical correspondence to the WM areas where we found AD changes).
The DTI interpretation is not trivial, and some important aspects should be considered when trying to assign a histopathological meaning to these results. The original studies that approached directional diffusivities (9,21) and associated AD and RD with axon loss and demyelination, respectively, were performed in animals and with controlled and isolated pathological processes. The in vivo studies demonstrated variable presentations of AD in different diseases or pathological stages. Despite these variations, the previous studies tended to associate AD changes with a spectrum of axonopathy that ranged from increased axonal diameter to axon loss (28).
Since the degenerative processes in MS have gained attention as a primary factor in disability progression, several imaging techniques have been developed to detect and differentiate the microscopic and biochemical abnormalities in the disease. The correlation between AD and EDSS score could be supporting evidence for the use of this marker to follow-up axon loss. However, in MS, brain regions can experience a combination of axon loss, demyelination, inflammation, and gliosis, with an unpredictable influence on DTI measurements (33). Thus, it would be desirable, in future studies, to combine the DTI analyses with other imaging modalities (e.g., magnetization transfer, spectroscopy, and T2 relaxometry) to improve the specificity of DTI metrics.
Although it is not possible to make a precise histopathological hypothesis based on DTI, this method is gaining importance as a non-invasive tool capable of detecting microscopic changes in the neural tissue (9). Our results show a heterogeneous pattern of microscopic damage in the CC in the initial stages of MS, with diffuse changes in MD, FA, and RD; however, AD increased in only two CC segments. The correlation with the EDSS score shows that this latter biomarker can be potentially useful for following MS disability. These findings demand further investigation to confirm the correlation of this biomarker with WM degeneration.
AUTHOR CONTRIBUTIONSRimkus CM collected and analyzed the images (by investigating lesion loads, performing pre- and post-processing, and conducting quantitative analysis), performed the statistical analysis, and wrote the manuscript. Junqueira TF performed the clinical analysis and patient selection, as well as revised some clinical aspects of the paper. Callegaro D was responsible for the Division of Demyelinating Diseases in the Hospital das Clínicas FMUSP, clinical analysis, patient selection, and revision of the clinical aspects of the paper. Otaduy MC developed and supervised the imaging acquisition protocol, revised the DTI analysis, and revised the technical aspects of the paper. Leite CC provided the financial support, revised the paper with regard to the clinical and imaging aspects, supervised the imaging analysis, and directed the team.
The authors thank the Foundation for Research Support of the State of São Paulo (Fundação de Amparo à Pesquisa do Estado de São Paulo – FAPESP) for providing financial support for this study.
No potential conflict of interest was reported.