


The association between P wave dispersion and iron deficiency anemia has not been documented in the literature. In this study, we evaluated P wave dispersion in patients with iron deficiency anemia and the possible relationships between P wave dispersion and other echocardiographic parameters.
INTRODUCTION:The iron status of an individual may play an important role in cardiovascular health. Anemia is an independent risk factor for adverse cardiovascular outcomes. P wave dispersion is a simple electrocardiographic marker that has a predictive value for the development of atrial fibrillation. Apart from cardiovascular diseases, several conditions, such as seasonal variation, alcohol intake and caffeine ingestion, have been demonstrated to affect P wave dispersion.
METHODS:The study included 97 patients who had iron deficiency anemia and 50 healthy subjects. The cases were evaluated with a clinical examination and diagnostic tests that included 12-lead electrocardiography and transthoracic echocardiography.
RESULTS:Compared to the control group, patients with iron deficiency anemia showed significantly longer maximum P wave duration (Pmax) (91.1±18.0 vs. 85.8±6.7 msec, p = 0.054), P wave dispersion (PWD) (48.1±7.7 vs. 40.9±5.6 msec, p<0.001), mitral inflow deceleration time (DT) (197.5±27.9 vs. 178.8±8.9 msec, p<0.001) and isovolumetric relaxation time (IVRT) (93.3±9.2 vs. 77.4±8.2 msec, p<0.001); they also showed increased heart rate (85.7±16.1 vs. 69.0±4.4, p<0.001) and frequency of diastolic dysfunction (7 (7.2%) vs. 0). Correlation analysis revealed that PWD was significantly correlated with IVRT, DT, heart rate, the presence of anemia and hemoglobin level.
CONCLUSIONS:Iron deficiency anemia may be associated with prolonged P wave duration and dispersion and impaired diastolic left ventricular filling.
P wave dispersion (PWD) is defined as the difference between the longest and the shortest P-wave duration recorded from multiple different surface ECG leads. To date, the most extensive clinical evaluation of PWD has been performed in the assessment of the risk for atrial fibrillation (AF), which is characterized by inhomogeneous and discontinuous atrial conduction. Several studies have showed that PWD has a predictive value for the development of AF in patients without apparent heart disease and in patients who were hypertensive or had various cardiac conditions.1-3 Apart from cardiovascular diseases, several conditions such as seasonal variation, alcohol intake and caffeine ingestion have been demonstrated to affect PWD.4-6
Anemia is an independent risk factor for adverse cardiovascular outcomes.7,8 The iron status of an individual may play an important role in cardiovascular health because either an excess of iron or iron deficiency can lead to significant problems.9 Increased risks of left ventricular (LV) dilatation, systolic dysfunction, chronic heart failure and death have been shown to be associated with a decrease in hemoglobin (Hb) concentration of as little as 1 g/dL.10,11
To our knowledge, the association between PWD and iron deficiency anemia (IDA) has not been documented in the literature. In this study, we evaluated PWD in patients with IDA and the possible relationships between PWD and other echocardiographic parameters.
MATERIALS AND METHODSIn this study, 97 patients with IDA and 50 healthy controls were included, and the following laboratory tests were conducted: complete blood count, peripheral smear, serum ferritin, vitamin B12, folate, serum iron, iron binding capacity and transferrin saturations. The diagnosis of iron deficiency anemia was established as follows: hemoglobin <12 g/dL in women and <13 g/dL in men; serum ferritin <12 ng/mL; and mean corpuscular volume (MCV) and mean corpuscular hemoglobin concentration (MCHC) values below the normal range (i.e., 83-97 fL and 32-36 g/dL, respectively).12
All study cases were evaluated with a detailed clinical examination and diagnostic testing that included 12-lead electrocardiography and transthoracic echocardiography. Patients with the following conditions were excluded: acute bleeding, chronic bleeding resulting from malignancy, vitamin B12 or folate deficiency, thalassemia, sickle cell disease, structural heart disease, ischemic heart disease, diabetes, hypertension, renal failure, chronic obstructive pulmonary disease, hypo- or hyperthyroidism and any other systemic diseases. The subjects from the control group were comparable to patients with iron deficiency anemia in age, sex and body mass index, were free from any cardiovascular disorder and were not taking any cardioactive drugs. All subjects gave written informed consent to the study, and the study was approved by the hospital ethics committee in accordance with the Declaration of Helsinki.
Using a commercially available machine (Marquette Case, Hellige Medical System, Cardiosmart, Hellige Instrument Company, Freiburg, Germany) and with the patient in a supine position, 12-lead ECGs with 20 mm/mV amplitude, 50 mm/sec rate and standard lead positions were obtained after a 10-minute rest period. Using a magnifying glass, P wave durations were manually measured by two cardiologists who had no information about the patients. The beginning of the P wave was defined as the point at which the initial deflection of the P wave crossed the isoelectric line, and the end of the P wave was defined as the point at which the final deflection of the P wave crossed the isoelectric line. The difference between maximum and minimum P wave duration (Pmax and Pmin, respectively) was defined as PWD. Intra- and inter-observer coefficients of the variation for P wave variables were insignificant at less than 5%.
Using a commercially available echocardiographic device (Vivid 3, General Electric) with a 3-MHz transducer, the echocardiographic examination was performed with the patient at rest in a left lateral decubitis position. Two experienced echocardiographers, who were blinded to the clinical data, conducted the examination. Using M-mode echocardiography, long-axis measurements were obtained at the level distal to the mitral valve leaflets according to current recommendations.13 Left ventricular ejection fraction (LVEF) was calculated via the modified biplane Simpson's method from apical four- and two-chamber views. The pulsed Doppler sampling volume was placed between the tips of the mitral valve leaflets to obtain maximum filling velocities. Early diastolic flow (E), atrial contraction signal (A) and E deceleration time (DT) were measured. Isovolumetric relaxation time (IVRT) was determined as the interval between the end of the aortic outflow and the start of the mitral inflow signal. Using the pulsed wave spectral mode, Tissue Doppler Imaging (TDI) was acquired to assess diastolic function. Filters and baselines were corrected when the velocity ranged between -20 and +20 cm/s. From the apical four-chamber view, a 5-mm sample volume was placed at the lateral corner of the mitral annulus. Early (Em) and late (Am) diastolic velocities as well as the Em/Am ratio were calculated. All values were measured on three separate beats and then averaged for all parameters. During the entire echocardiographic study, a single-lead electrocardiogram was continuously recorded. Intra- and inter-observer coefficients of variation for echocardiographic measurements were insignificant at less than 10%. Impaired left ventricular relaxation was defined as an Em/Am ratio <1 and Ea <10 cm/sec and/or all three of the following: an E/A ratio <1 (or < 0.5 for patients who were >50 years old), DT > 200 msec and IVRT > 100 msec (or >105 msec for patients who were >50 years old).14,15
StatisticsQuantitative variables are expressed as the mean ± standard deviation (SD), and qualitative variables are expressed as numbers and percentages. Differences between independent groups were assessed by t-tests for quantitative data, the Chi-squared test for qualitative variables and the Mann-Whitney's U-test for variables without a normal distribution. Using Pearson correlation analysis, the relationship between P wave variables and clinical and echocardiographic variables were assessed. All tests were performed using the SPSS program for Windows, version 10.0. A two-tailed p value of <0.05 was considered significant.
RESULTSBaseline characteristics were not significantly different between IDA patients and control subjects. Hemoglobin levels among patients with IDA ranged between 4.7 and 10.0 g/dL. The etiologies for iron deficiency were as follows: menorrhagia in 12 cases, ulcerated hiatus hernia in 13 cases, peptic ulcer in 21 cases, hookworm infection in 4 cases, hemorrhoidal bleeding in 15 cases, inflammatory bowel disease in 3 cases, esophagitis in 8 cases, atrophic gastritis in 4 cases, diverticulosis in 5 cases, stomach surgery in 6 cases and chronic blood donors in 6 cases. Mean heart rate, DT and IVRT were significantly increased, and diastolic dysfunction was significantly more frequent among IDA patients (Table 1). Maximum P wave duration and PWD were significantly longer in patients with IDA (Table 2).
Comparison of clinical and echocardiographic variables for patients with iron deficiency anemia versus healthy subjects.
| Parameters | IDA (n = 97) | Control (n = 50) | P value |
|---|---|---|---|
| Age (years) | 37.48±11.9 | 37.28±5.5 | 0.816 |
| Male (n,%) | 30 (30.9%) | 13 (26%) | 0.824 |
| Body mass index (kg/m2) | 23.3±2.9 | 24.0±1.8 | 0.194 |
| Smoking (n,%) | 20 (20.6%) | 14 (28%) | 0.483 |
| Systolic BP (mmHg) | 117.5±9.3 | 118.0±9.2 | 0.788 |
| Diastolic BP (mmHg) | 73.3±8.3 | 73.3±7.8 | 1.000 |
| Hb (g/dl) | 7.9±1.6 | 14.2±0.4 | <0.001 |
| Htc (%) | 25.3±4.9 | 40.3±1.7 | <0.001 |
| LVDD (mm) | 48.1±4.2 | 47.7±2.2 | 0.914 |
| LVSD (mm) | 30.8±2.4 | 32.6±2.1 | 0.462 |
| LVEF (%) | 63.0±3.2 | 63.2±2.2 | 0.385 |
| IVS (mm) | 9.3±1.3 | 9.5±0.6 | 0.297 |
| PW (mm) | 9.1±1.2 | 9.4±0.9 | 0.178 |
| LA diameter (mm) | 35.6±4.5 | 34.4±12.8 | 0.07 |
| E/A | 1.3±0.3 | 1.3±0.1 | 0.553 |
| DT (msec) | 197.5±27.9 | 178.8±8.9 | <0.001 |
| IVRT (msec) | 93.3±9.2 | 77.4±8.2 | <0.001 |
| Diastolic dysfunction (n,%) | 7 (7.2%) | 0 | 0.012 |
| SI (ug /dl) | 19.50±5.10 | 76.92±23.60 | 0.001 |
| Ferritin (ng/ml) | 4.54±3.51 | 42.55±47.71 | 0.001 |
| Transferrin saturation (%) | 8.10±2.18 | 34.23±12.14 | 0.001 |
BP: Blood pressure, Hb: Hemoglobin, Htc: Hematocrit, LVDD: Left ventricular diastolic diameter, LVSD: Left ventricular systolic diameter, LVEF: Left ventricular ejection fraction, IVS: Interventricular septum, PW: Posterior Wall, LA: Left atrium, DT: Deceleration time, IVRT: Isovolumetric relaxation time, SI: Serum Iron.
Comparison of P wave variables and heart rate for iron-deficient anemic patients versus healthy subjects.
| IDA (n = 97) | Control (n = 50) | P value | |
|---|---|---|---|
| Pmax (msec) | 91.1±18.0 | 85.8±6.7 | 0.054 |
| P min (msec) | 44.8±9.3 | 44.9±9.1 | 0.957 |
| PWD (msec) | 48.1±7.7 | 40.9±5.6 | <0.001 |
| Heart rate (bpm) | 85.7±16.1 | 69.0±4.4 | <0.001 |
Pmax: Maximum P wave duration, Pmin: Minimum P wave duration, PWD: P wave dispersion.
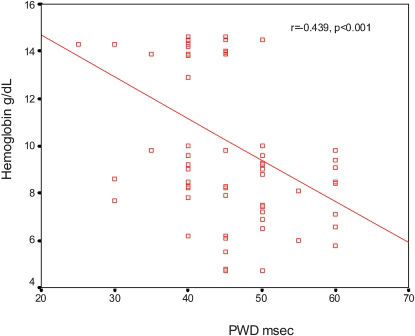
PWD was significantly correlated with the following: presence of anemia (r = 0.474, p<0.001), Hb level (r = -0.451, p<0.001) (Figure 1), IVRT (r = 0.347, p<0.001), DT (r = 0.255, p = 0.011) and heart rate (r = 0.252, p = 0.011). PWD was not significantly correlated with any other clinical or echocardiographic parameters, including age, gender, LVEF and systolic and diastolic blood pressure.
DISCUSSION
In this study, we found that P max and PWD were significantly prolonged in patients with iron deficiency anemia. In addition, the frequency of left ventricular diastolic dysfunction was increased in IDA.
Se-veral studies have shown that PWD has a predictive value for AF in patients with no underlying heart disease and in those who are hypertensive and have various other cardiac conditions.1-3 PWD is a simple electrocardiographic marker that could be used for the prediction of paroxysmal AF.3,16 Several factors have been shown to influence PWD. A seasonal variation has been demonstrated in healthy subjects; specifically, PWD is shortest in the summer and longest in the winter.17 Furthermore, the effects of obesity, acute caffeine ingestion, alcohol intake and high altitude on PWD in healthy subjects have been evaluated in several studies, and differences between trained athletes and control subjects have also been demonstrated.5,6,18-20 Therefore, it might be inappropriate to use a single PWD measurement as a predictor of AF in healthy people because PWD is influenced by many parameters, which may be risk factors for the long-term development of AF. To our knowledge, there is no study that has investigated the effect of iron deficiency anemia on P wave measurements.
Compromised oxygen delivery capacity due to anemia may result in chronic tissue hypoxemia, which may then lead to myocyte dysfunction. Because iron moieties bind to myoglobin, a total-body iron deficit could further impair the ability of myocytes to extract oxygen from circulating hemoglobin. Several mechanisms operate to compensate for tissue hypoxia induced by anemia. When the hemoglobin concentration drops below 10 g/dl or during non-resting conditions, non-hemodynamic factors are surmounted, and hemodynamic mechanisms begin to compensate for tissue hypoxia.21 Although increased cardiac output is the main hemodynamic factor and is mediated by lower afterload, increased preload and positive inotropic and chronotropic affects, the mechanisms of hemodynamic compensation are complex. These mechanisms include (i) a reduction in afterload due to a decrease in systemic vascular resistance, (ii) an increase in preload due to an increase in venous return and (iii) increased left ventricular (LV) function attributed to increased sympathetic activity and inotropic factors. In addition, heart rate is increased in anemic patients due to hypoxia-stimulated chemoreceptors.22,23
In the present study, the frequency of LV diastolic dysfunction was significantly increased in patients with IDA. Several mechanisms may explain this association. Tissue hypoxia induced by anemia may impair diastolic function. Diastolic dysfunction without systolic dysfunction may present at an early stage of myocardial ischemia, and this is consistent with the finding that left ventricular diastolic function is more susceptible to ischemia than systolic function.24 Adaptation to an anemic state involves the augmentation of heart rate, cardiac index, stroke work and increased plasma volume.23,25 This overall increase in sympathetic and inotropic activity places additional stress on the myocardium and may lead to the remodeling of myocytes and the vasculature. Anemia also has numerous hormonal and metabolic effects that can result in direct myocardial toxicity and ischemia.26 These specific effects have been observed when the anemia is severe (Hb <10 g/dl). Therefore, subendocardial ischemia, increased heart rate and altered loading conditions may contribute to the anemia-associated diastolic dysfunction. LV diastolic dysfunction has also been shown to be associated with increased PWD and may partially explain our finding of increased PWD in IDA.27
P wave duration and PWD have also been reported to be influenced by autonomic tone, which induces changes in the velocity of impulse propagation. Increased sympathetic activity causes a significant increase in PWD.28 Elevated levels of norepinephrine in plasma and urine in IDA patients support the role of increased sympathetic activity in this effect.29 Low oxygen tension in the tissues may explain the autonomic dysfunction in IDA. Hypoxia has an important pathophysiological role in various diseases, including anemia.30 Cardiac autonomic dysfunction has been documented in various anemic patient populations, such as those with vitamin B12 deficiency, sickle cell anemia, thalassemia and iron deficiency anemia.31,32 Although it is unknown how low oxygen tension is detected by cells, the influence of the carotid body on ventilatory and cardiovascular reflexes seems to play a major role in altered autonomic balance.33
LimitationsThe most important limitation of our study is the manual calculation of P-wave measurements using a magnifying lens instead of computer-assisted P-wave calculations. However, thermal, digital and signal-averaging ECG systems have been used to evaluate PWD, which was measured manually either on paper or on a high-resolution computer screen. Although several studies have demonstrated a low error in the measurement of PWD on paper-printed ECGs, other studies have suggested that manual PWD measurement on paper-printed ECGs obtained at a standard signal size and paper speed may have questionable accuracy and reproducibility.3,34 It is unclear whether prolonged PWD may be associated with the long-term development of AF. Pulsed wave Doppler indices used for the evaluation of LV diastolic properties have been known to be altered by numerous factors, including loading conditions and heart rate, both of which can be altered by anemia.35 However, to evaluate diastolic function, we also used tissue Doppler indices, which are relatively independent of loading conditions.
CONCLUSIONSIron deficiency anemia may be associated with prolonged P wave duration and dispersion and impaired diastolic left ventricular filling. Tissue hypoxia, altered loading conditions and impaired autonomic balance with increased sympathetic activity may be among the possible mechanisms that explain these findings.