


To estimate the correlation between indices of diet quality (DQIs), insulin sensitivity (QUICKI) and resistance (HOMA-IR), waist circumference (WHR) and body mass (BMI) and the alleles and genotypes of the TJP1 SNP rs2291166 and the VNTR of ATXN2 in adolescent patients.
Subjects and methodThe study enrolled 85 subjects aged 10–20years, from the city of Tuxtepec, Oaxaca, Mexico, recruited in the period 2017–2018. DQIs, BMI, WHR, HOMA-IR, QUICKI, and diet quality index were measured. The rs2291166 polymorphism in TJP1 was determined by allele-specific PCR and the (CAG)n expansion in ATXN2 was determined by hot start PCR. PCR products were analyzed using 8% PAGE electrophoresis and silver nitrate staining.
ResultsA correlation was found of indices DQIs, HOMA-IR, WHR and BMI with the heterozygous genotype of the TJP1 SNP rs2291166 and the long and short repeats of the ATXN2 CAG repeat in obese adolescent patients. A very strong positive correlation was seen between the TJP1 SNP and the HOMA-IR index (P<.05). A positive correlation was also found between the ATXN2 CAG repeat and the QUICKI index (P=.000) (P<.05), while the DQIs index correlated more closely with BMI and WHR.
ConclusionsDQIs, TJP1 SNP rs2291166, and ATXN2 CAG repeat are determinants of obesity-related risk parameters such as BMI, WHR, QUICKI, and HOMA-IR in the adolescent population analyzed.
Estimar la correlación entre los índices de calidad dietética (DQI), de sensibilidad (QUICKI) y de resistencia a la insulina (HOMA-IR), el índice cintura-cadera (ICC) y el índice de masa corporal (IMC) con los alelos y genotipos del SNP rs2291166 de TJP1 y el VNTR de ATXN2 en pacientes adolescentes.
Sujetos y métodoEl estudio se incluyó 85 sujetos con rango de edad entre 10-20años, originarios de la ciudad de Tuxtepec, Oaxaca, México, captados en el periodo 2017-2018. Se determinó el DQI, el IMC, el ICC, el índice HOMA-IR, el QUICKI y el índice de calidad dietética. El polimorfismo rs2291166 de TJP1 se determinó por PCR-alelo específico y la expansión (CAG)n de ATXN2 se determinó por PCR-Hot Start. Los productos de PCR se analizaron por electroforesis PAGE al 8% y tinción con nitrato de plata.
ResultadosSe encontró la correlación entre los índices DQI, HOMA-IR, ICC e IMC con el genotipo heterocigoto del SNP rs2291166 de TJP1 y los repetidos largos así como cortos del repetido CAG de ATXN2 en pacientes adolescentes con obesidad, con una correlación positiva muy fuerte entre el SNP de TJP1 y el índice HOMA-IR (p<0,05).También se encontró correlación positiva entre el repetido CAG de ATXN2 con el índice QUICKI (p=0,000) (p<0,05), mientras que el DQI correlaciona más con el IMC y el ICC.
ConclusionesEl DQI, el SNP rs2291166 de TJP1 y el repetido CAG de ATXN2 son factores determinantes de los parámetros de riesgo relacionados con la obesidad tales como el IMC, el ICC, el QUICKI y el HOMA-IR en la población adolescente analizada.
The growing prevalence of obesity has become a worldwide public health problem. Obesity is defined as the abnormal or excessive accumulation of adipose tissue in the body. When concentrated in the trunk region of the body during adolescence, this accumulation is positively and independently associated with multiple chronic metabolic disorders in adulthood.1 In individuals under 19years of age, obesity is diagnosed when the body mass index (BMI) is above percentile 95, according to the age and gender tables of the World Health Organization (WHO).2 In Mexico, the prevalence of obesity in adolescents increased by 1.4% from 2012 to 2016, with a combined prevalence of overweight/obesity of 36.3%.3
Different studies have shown the etiology of obesity to be multifactorial, with the intervention of both environmental and genetic factors. A multidisciplinary approach to the disease is therefore required. The environmental causes include eating habits, a sedentary lifestyle, economic factors, obesogenic environments, social factors, genetics, microbiota and/or endocrine alterations. Genetics has been the least studied of these factors in Mexico.4 It is therefore very important to conduct research on the genetic-environmental factors, their interactions, their outcomes in the form of clinical phenotypes, and the associated comorbidities. One of the most widely investigated aspects of this topic is the characterization of monogenic obesity, i.e., obesity caused by mutations in a single gene. This includes the genes that encode for proteins responsible for the regulation of appetite, such as leptin (LEP), the leptin receptor (LEPR), pro-opiomelanocortin (POMC), pro-convertase type1 (PC1), and the melanocortin receptor4 (MC4R).5,6 A recent study in the central region of Mexico (3938 adults and 636 schoolchildren) explored the influence of the interaction between polymorphisms rs9939609 of FTO and rs9282541 of ABCA1 (member1 of subfamilyA of the ATPase-binding cassettes) upon BMI and waist-hip ratio (WHR) values, and found a significant association between the FTO variant in heterozygosis and an increased BMI (p=0.043), as well as an increased WHR, though in the latter case statistical significance was not reached (p=0.067).7 However, further studies of this kind are needed due to the ethnic diversity that characterizes the Mexican population, which is directly related to the metabolic differences among individuals.
Two genes have been little studied to date in relation to nutritional status and obesity.
The first gene encodes for Tight Junction Protein 1 (TJP1), which is located on chromosome15 and is responsible for producing the Zonula Occludens type1 (ZO-1) proteins that form part of the tight junctions, regulating lateral and basolateral nutrient transport in the cell membranes, including those of intestinal epithelial cells.8
The second gene encodes for ataxin-2 (Spinocerebellar Ataxia Type 2 protein [ATXN2]) and has its locus on chromosome12, band q24.1. Ataxin-2 is an RNA-binding protein that interacts with the cytoplasmic poly[A] binding protein (PABPC1). The ataxin-2 gene belongs to a group of genes associated with microsatellite repeat expansion diseases (neurological and neuromuscular disorders caused by the expansion of short repeat DNA segments).8–10 Ataxin-2 is also a regulator of cellular stress in the Golgi system, and of the insulin signaling pathway (the GRB2 pathway). It likewise regulates the expression of Krebs cycle enzymes, fatty acid oxidation, and cell membrane transporters for fatty acids, amino acids, minerals, and other nutrients. As a result, it influences nutritional status, and obesity and insulin resistance may occur in the event of deficient ataxin-2 expression.10
The present study was carried out to evaluate the correlation of the indices of diet quality (DQI), insulin sensitivity (QUICKI) and insulin resistance (HOMA-IR), the WHR and the BMI with the alleles and genotypes of the TJP1 single nucleotide polymorphism (SNP) rs2291166 and the VNTR of ATXN2 in adolescent patients.
Material and methodsStudy subjectsA cross-sectional analytical study was carried out. It comprised 85 adolescents (170 chromosomes) between 10–20years of age from the city of Tuxtepec, Oaxaca (Mexico), of Chinanteca ethnic origin, representative of all the users of circumscription number 3 of the Health Services of the State of Oaxaca, Chronic Diseases Information System (Sistema de Información en Crónicas [SIC]), of the National Center for Preventive Programs and/or Disease Control (Centro Nacional de Programas Preventivos y/o del Control de Enfermedades [CENAPRECE)]. The included subjects or their guardians were not aware of any diseases or features associated with metabolic syndrome, and presented blood pressure<120/85mmHg, serum total cholesterol<180mg/dl, total triglycerides<170mg/dl, HDL-cholesterol 35–45mg/dl, LDL-cholesterol <140mg/dl and glycosylated hemoglobin HbA1c<6.0%. The following were established as dependent variables: the BMI, the WHR, HOMA-IR and the QUICKI. In turn, the following were established as independent variables: polymorphisms rs2291166 of TJP1, as well as (CAG)n of ATXN2 and DQI.
Ethical considerationsThe study was conducted in abidance with the WHO code of ethics and the revised edition of the Declaration of Helsinki. As the first requirement for inclusion in the study, each participant (parent or guardian in the case of minors) signed a legal informed consent form agreeing to participation. All data were processed anonymously. The study was approved by the research and ethics committees of Health Circumscription No.3 of Tuxtepec, the State of Oaxaca Health Service, with authorization reg. J3/EP/106/2019.
Anthropometric analysisBody weight was recorded using a scale (TANITA model UM-081, ZAPOPAN, Jalisco, Mexico), and height was measured with a stadiometer (SECA model 206, Hamburg, Germany). In turn, waist circumference was measured using a fibreglass tape (SECA model 201, Hamburg, Germany). All the above measures were obtained based on the guidelines established by the Ministry of Health of Mexico.11 The BMI was calculated from the formula described by Quetelet in 1833, and was analyzed using the BMI curves and tables adjusted for age of the WHO (2007).2
Blood pressure analysisBlood pressure was measured using a mercury sphygmomanometer (MI-300 MEDDEX FAB NACIONAL Model 030), manufactured under the references of Official Mexican Standard 009 SFCI 1993 and certified by the American Heart Association (AHA).
Biochemical analysisAll study subjects provided 5ml of peripheral blood by venipuncture in BD Vacutainer tubes for the biochemical tests. Glucose measurements were performed using enzymatic-colorimetric kits (Human Co.) of the Beckman Coulter DU730 analyzer (Brea, CA, USA). Serum insulin was analyzed by RIA using Alpco Kit 80-INSHU-E01.1 (Salem, NH, USA) with the Chromate Microplate Reader (Awareness-Technology, Inc., Palm City, FL, USA). In turn, the insulin resistance and sensitivity indices were determined using the HOMA-IR and QUICKI formulas. The insulin resistance indices were determined based on the following formulas: HOMA-IR=(fasting insulin (μU/mL)*fasting glucose [mmol/l])/22.5; the QUICKI index=1/(log plasma insulin [μU/mL]+log fasting plasma glucose 6 [mg/dl]).12
Lipid profile analysisTotal cholesterol and triglycerides, HDL-cholesterol (high density lipoprotein cholesterol) and LDL-cholesterol (low density lipoprotein cholesterol) were measured by direct photometry using automated equipment (ES-3000, Laboratorios Tolsa, Guadalajara, Jalisco, Mexico).
Glycosylated hemoglobin analysisGlycosylated hemoglobin (HbA1c) levels were analyzed by immunofluorescence using the CHROMA II system (Bodea, Korea)(Laboratorios Tolsa, Guadalajara, Jalisco, Mexico).
Molecular genetic analysisGenomic DNA was extracted from 5ml of peripheral blood obtained by venipuncture, using the magnetic bead method of the Genecatcher kit (Invitrogene) for the amplification reaction.13,14
PCR-Hot Start amplification for the VNTR (CAG)n of ATXN2Use was made of the primers ATXN2-1 5ʹ-GGGCCCCTCACCATGTCG-3ʹ, ATXN2-2 5ʹ-CGGGCTTGCGGACATTGG-3ʹ, synthesized by the company Sigma Aldrich™ and previously designed and tested.9,15 The following amplification program was performed with the 2720 Thermal Cycler (Applied Biosystems, Foster City, CA, USA): 1, 96°C 3min; 2, 96°C 60s; 3, 59°C 30s; 4, 72°C 1min; 5, 28times from cycle 2 to 4. Reaction mixture: Buffer10×2μl/reaction, primers ATXN2-1 and ATXN2-2 4pmol/μl/reaction, dNTP 10mM 2μl/reaction, MgCl2 2mM 2μl/reaction, 8% DMSO 2μl/reaction, Taq DNA Polymerase Recombinant (Invitrogene, Sao Paulo, Brazil) 5U/μl, DNA 100ng/μl. Final reaction volume: 25μl. The PCR product was mixed with deionized formamide and denaturalized in a water bath for 10min, and was then placed in ice for 3min for the electrophoretic run. The amplified products were subjected to electrophoresis with 8% polyacrylamide gels (19:1), at 180V during 2h. The gels were subsequently stained with 0.1g silver nitrate, 0.5ml acetic acid and 10ml ethanol, topped up to 100ml. The developing solution was based on 3% sodium hydroxide with 270μl of 37% formaldehyde, topped up to 100ml.9,15 Identification of the repeats was carried out based on the classification of the PCR products: 106bp corresponded to the allele of 14 repeats, 130bp to 22 repeats, and the highest frequency 154bp to the allele of 30 repeats.16
PCR-PASA amplification for SNP rs2291166 of the TJP1 geneDetection of polymorphism rs2291166 was performed using the primers: FW1G 5ʹ-CTTCATCTTCTTCAGGTT-3ʹ, FW2A 5ʹ-ATATTCTTCATCTTCTTC AGG TGʹ-3, RW3 5ʹ-GTCATTCATTATCTGTTAGG-3ʹ (Genosys Sigma-Aldrich), previously reported.17 The amplification program consisted of initial denaturalization at 95°C for 5min, followed by 30cycles with the following characteristics: 1, 30s of denaturalization at 95°C; 2, hybridization for 45s at 48°C; and 3, polymerization for 30s at 72°C, with a final extension at 72°C for 5min, as previously reported.17 The reaction mixture was: KCl buffer 2.5μl (1X), MgCl2 1.5μl (25mM), 0.5μl of dNTP (0.2mM), 0.5μl of each primer (25pmoles), 2μl of template DNA (200ng), Taq DNA Polymerase Recombinant 0.3μl (3U/μl) (Invitrogen, Sao Paulo, Brazil), and finally 17.20μl of water, final reaction 25ml. The PCR products were analyzed by 7% polyacrylamide electrophoresis (19:1 proportion),17 with electrophoretic run TBE buffer1X for 1.5h at 200V, 80-84mA. Silver nitrate was used to develop the gels. The products were differentiated by sizes: 102bp corresponded to theT allele, while 107bp corresponded to the G allele.17 The PCR reactions of the TJP1 and ATXN2 genes, as well as electrophoresis, were performed and interpreted on a triple blind basis.
Dietary analysisTo assess nutritional intake, two non-consecutive 24h reminders were sent to each study subject; the individual average intake and intake in grams of each ingested nutrient were then determined.
An 8-item diet quality index (DQI) was constructed, based on the 8 recommendations on healthy nutrient intake of the FAO/WHO Expert Committee for the prevention of chronic diseases.18 The percentage of ingested nutrients was determined based on the FAO/WHO recommendations.
The positive components of the index were: a daily consumption of ≥400g of fruit and vegetables; a daily protein intake ≥10% of total energy; a daily total fat intake <30% of total energy; a daily saturated fat intake <10% of total energy; a daily polyunsaturated fat intake 6–10% of total energy; a daily cholesterol intake <300mg, and ≥25g of total dietary fiber per day.18
Based on these items, a score of 1 was assigned to compliance with each item, while a score of 0 was assigned to non-compliance. Accordingly, the maximum index score was 8, and the observed scores could range from 2–8. For purposes of interpretation, we used index tertiles in the analyses (2–4, 5–6 and 7–8), corresponding to low, average and high dietetic preventive scores, respectively.18
Statistical analysisConvenience sampling was used. The minimum calculated sample was 100 chromosomes (50 people), based on the proportions of the alleles analyzed, in accordance with the Neale criteria. A total of 85 patients (170 chromosomes) were included, representing all adolescent users of healthcare circumscription number3 of the SIC-CENAPRECE program.
The allelic and genotypic frequencies of the two polymorphisms were established by direct counting, and were applied through the ratio as a measure of frequency. The tests used to compare nonparametric variables, as in the case of Hardy-Weinberg (HW) equilibrium or correlation with biomarkers and polymorphisms (CAGs)n in ATXN2 and rs2291166 of TJP1, were the Pearson χ2 statistic, the Spearman coefficient, and binominal multiple logistic regression analysis. The differences between the clinical, biochemical and anthropometric parameters were validated using the Student t-test (independent samples), with statistical significance being considered for p<0.05; χ2≥6.99. Analysis of variance (ANOVA) and the Dunnett test were subsequently applied between groups with the anthropometric and biochemical variables and genotypes found to be significant with the Student t-test. The SPSS version 25.0 statistical package (Chicago, IL, USA) was used throughout.
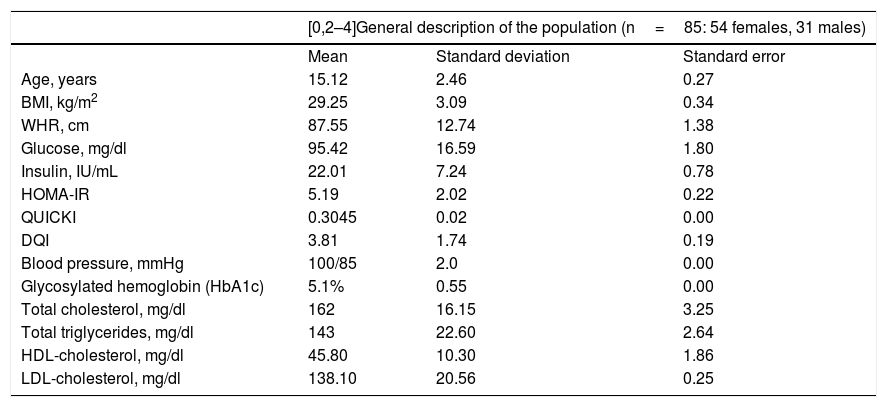
ResultsTable 1 provides a comparative description of the mean, standard deviation and standard error of the anthropometric, biochemical and dietary characteristics of the study population. It should be noted that the studied adolescent population presented glucose levels in the normal range, with hyperinsulinemia, insulin resistance and altered insulin sensitivity. However, none were diabetic at the time of inclusion in the study, as reflected by the glycosylated hemoglobin (HbA1C) values of <6.5% (Table 1). In addition, none of the index cases had high blood pressure or dyslipidemia, since the total cholesterol, triglyceride, LDL-cholesterol, and HDL-cholesterol levels were all within normal ranges (Table 1).
General description of the study population.
| [0,2–4]General description of the population (n=85: 54 females, 31 males) | |||
|---|---|---|---|
| Mean | Standard deviation | Standard error | |
| Age, years | 15.12 | 2.46 | 0.27 |
| BMI, kg/m2 | 29.25 | 3.09 | 0.34 |
| WHR, cm | 87.55 | 12.74 | 1.38 |
| Glucose, mg/dl | 95.42 | 16.59 | 1.80 |
| Insulin, IU/mL | 22.01 | 7.24 | 0.78 |
| HOMA-IR | 5.19 | 2.02 | 0.22 |
| QUICKI | 0.3045 | 0.02 | 0.00 |
| DQI | 3.81 | 1.74 | 0.19 |
| Blood pressure, mmHg | 100/85 | 2.0 | 0.00 |
| Glycosylated hemoglobin (HbA1c) | 5.1% | 0.55 | 0.00 |
| Total cholesterol, mg/dl | 162 | 16.15 | 3.25 |
| Total triglycerides, mg/dl | 143 | 22.60 | 2.64 |
| HDL-cholesterol, mg/dl | 45.80 | 10.30 | 1.86 |
| LDL-cholesterol, mg/dl | 138.10 | 20.56 | 0.25 |
DQI: diet quality index; HDL: high-density lipoprotein; HOMA-IR: insulin resistance index; BMI: body mass index; WHR: waist-hip ratio; LDL: low-density lipoprotein; QUICKI: insulin sensitivity index.
No significant gender or age differences were observed in relation to the BMI, the WHR, glucose, insulin, HOMA-IR, the QUICKI, the DQI, HbA1C, blood pressure, total cholesterol, total triglycerides, or HDL- and LDL-cholesterol (p>0.05).
Nutritional assessmentIn the total sample (n=85), 21 males were classified as overweight (24.7%) and 10 as obese (40%). In turn, 34 females were classified as overweight (11.8%) and 20 as obese (23.5%).
Allelic and genotypic frequencies of polymorphism rs2291166 of the TJP1 gene in the populationWith regard to the determination of the allelic frequencies of polymorphism rs2291166 of the TJP1 gene in the study population, a greater presence was observed of the Tallele (88.8%; n=75) than of the G allele (11.2%; n=10). In turn, with regard to the genotypic frequency of polymorphism rs2291166 of the TJP1 gene, we found genotypeT/T (80%; n=68) to be more prevalent than genotypeT/G (17.6%; n=15) and genotype G/G (2.4%; n=2).
Hardy-Weinberg (HW) equilibrium for polymorphism rs2291166 of the TJP1 geneThe HW equilibrium analysis compared the frequencies obtained for each genotype of polymorphism rs2291166 of the TJP1 gene (T/T=68; T/G=15; G/G=2) with the expected frequencies (T/T=67.3; T/G=16.7; G/G=1), with validation using the χ2 test yielding a value of 5.99 and p=0.55. The population was thus found to be in HW equilibrium.
Allelic and genotypic frequencies, and the HW test for the VNTR of ATXN2In the case of the allelic frequency of the alleles of the VNTR (CAG)n corresponding to the gene encoding for ataxin-2, the most common allele in the population analyzed was that of 22 repeats (87%), followed by that of 23 repeats (5.88%), 18 and 29 repeats (2.35% in both cases), and finally 20 and 24 repeats (1.18% in both cases). Alleles 18, 20, 22, 23, 24 and 29 were polymorphic in the study population, as their frequencies were higher than 1%.
The total sample (n=85) showed 6 homozygous genotypes for the 22 repeat allele, with heterozygous genotypes for 18/22, 20/22, 22/24 and 22/29. The most frequently observed genotype was homozygous for the 22 repeat allele (87%), followed by the 22/23 genotype (5.88%), 18/22 and 22/29 (both with 2.35%), and finally the 20/22 and 22/24 genotypes (with 1.17% each). The distribution of these genotypes was found to be in HW equilibrium.
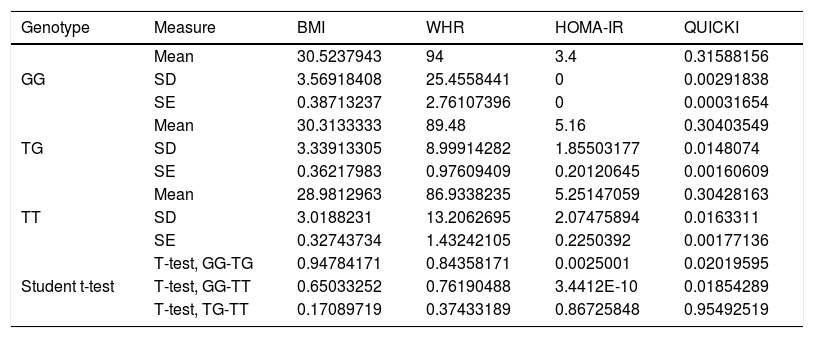
Association between nutritional risk markers and the SNP rs2291166 of TJP1 and VNTR of ATXN2 genotypesOn comparing the mean BMI, WHR, HOMA-IR and QUICKI values with the genotypes, significant differences were observed based on the Student t-test, with lower insulin resistance and impaired insulin sensitivity for homozygousG (G/G) versus heterozygous subjects. On comparing homozygous T (T/T) versus homozygous G (G/G), the homozygous T individuals exhibited greater insulin resistance and more impaired insulin sensitivity. However, no significant differences were observed with regard to the BMI or the WHR in relation to the distribution of means according to genotype (Table 2). The multivariate analysis (ANOVA) of polymorphism rs2291166 of TJP1 revealed significant inter- and intra-group differences (p=0.0001), particularly using the Dunnett test; significance was observed for the heterozygous T/C state versus the homozygousG (G/G) states (p=0.031) with respect to HOMA-IR. The mean BMI, WHR and QUICKI values showed no significant differences in the ANOVA test, nor did the values corresponding to blood pressure, total cholesterol, total triglycerides and HDL- and LDL-cholesterol in relation to the genotypes of SNP of TJP1 (p=0.10, 0.33, 0.44, 0.98 and 0.73, respectively).
Significance level with the Student t-test for dependent variables with TJP1 gene genotypes.
| Genotype | Measure | BMI | WHR | HOMA-IR | QUICKI |
|---|---|---|---|---|---|
| GG | Mean | 30.5237943 | 94 | 3.4 | 0.31588156 |
| SD | 3.56918408 | 25.4558441 | 0 | 0.00291838 | |
| SE | 0.38713237 | 2.76107396 | 0 | 0.00031654 | |
| TG | Mean | 30.3133333 | 89.48 | 5.16 | 0.30403549 |
| SD | 3.33913305 | 8.99914282 | 1.85503177 | 0.0148074 | |
| SE | 0.36217983 | 0.97609409 | 0.20120645 | 0.00160609 | |
| TT | Mean | 28.9812963 | 86.9338235 | 5.25147059 | 0.30428163 |
| SD | 3.0188231 | 13.2062695 | 2.07475894 | 0.0163311 | |
| SE | 0.32743734 | 1.43242105 | 0.2250392 | 0.00177136 | |
| Student t-test | T-test, GG-TG | 0.94784171 | 0.84358171 | 0.0025001 | 0.02019595 |
| T-test, GG-TT | 0.65033252 | 0.76190488 | 3.4412E-10 | 0.01854289 | |
| T-test, TG-TT | 0.17089719 | 0.37433189 | 0.86725848 | 0.95492519 |
SD: standard deviation; SE: standard error; HOMA-IR: insulin resistance index; WHR: waist-hip ratio; BMI: body mass index; QUICKI: insulin sensitivity index.
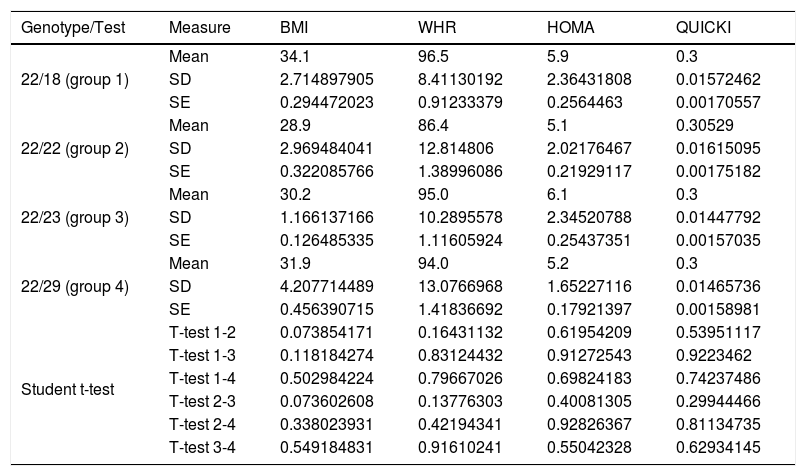
On comparing the mean BMI, WHR, HOMA-IR and QUICKI values with the four genotypes of the VNTR of ATXN2, no significant differences were observed with the Student t-test referring to the WHR, HOMA-IR and the QUICKI. However, a direct and inverse relationship was recorded between the increase or decrease in the expansion length of the CAG repeat and high BMI values (carriers of genotype 18/22 and 22/23), when compared to the values of the carriers of the most common genotype, the homozygous 22 repeats (Table 3). The means showed no significant differences (Student t-test and ANOVA) in relation to blood pressure, total cholesterol, total triglycerides, or HDL- and LDL-cholesterol with respect to the genotypes of the VNTR (CAG)n of the ATXN2 gene (p=0.21, 0.64, 0.56, 0.71 and 0.35, respectively).
Significance level with the Student t-test for dependent variables with ATXN2 gene genotypes.
| Genotype/Test | Measure | BMI | WHR | HOMA | QUICKI |
|---|---|---|---|---|---|
| 22/18 (group 1) | Mean | 34.1 | 96.5 | 5.9 | 0.3 |
| SD | 2.714897905 | 8.41130192 | 2.36431808 | 0.01572462 | |
| SE | 0.294472023 | 0.91233379 | 0.2564463 | 0.00170557 | |
| 22/22 (group 2) | Mean | 28.9 | 86.4 | 5.1 | 0.30529 |
| SD | 2.969484041 | 12.814806 | 2.02176467 | 0.01615095 | |
| SE | 0.322085766 | 1.38996086 | 0.21929117 | 0.00175182 | |
| 22/23 (group 3) | Mean | 30.2 | 95.0 | 6.1 | 0.3 |
| SD | 1.166137166 | 10.2895578 | 2.34520788 | 0.01447792 | |
| SE | 0.126485335 | 1.11605924 | 0.25437351 | 0.00157035 | |
| 22/29 (group 4) | Mean | 31.9 | 94.0 | 5.2 | 0.3 |
| SD | 4.207714489 | 13.0766968 | 1.65227116 | 0.01465736 | |
| SE | 0.456390715 | 1.41836692 | 0.17921397 | 0.00158981 | |
| Student t-test | T-test 1-2 | 0.073854171 | 0.16431132 | 0.61954209 | 0.53951117 |
| T-test 1-3 | 0.118184274 | 0.83124432 | 0.91272543 | 0.9223462 | |
| T-test 1-4 | 0.502984224 | 0.79667026 | 0.69824183 | 0.74237486 | |
| T-test 2-3 | 0.073602608 | 0.13776303 | 0.40081305 | 0.29944466 | |
| T-test 2-4 | 0.338023931 | 0.42194341 | 0.92826367 | 0.81134735 | |
| T-test 3-4 | 0.549184831 | 0.91610241 | 0.55042328 | 0.62934145 |
SD: standard deviation; SE: standard error; HOMA-IR: insulin resistance index; WHR: waist-hip ratio; BMI: body mass index; QUICKI: insulin sensitivity index.
The multivariate analysis (ANOVA) corresponding to the ATXN2 genotypes revealed no significant inter- or intra-group differences regarding the WHR, HOMA-IR or the QUICKI (p=0.5671, 0.3621 and 0.4438, respectively). The BMI values showed p=0.0507 between groups 1, 2 and 3. The Dunnett test revealed a significant increase in the BMI among carriers who were not homozygous for the most common genotype (22/22) (p=0.01).
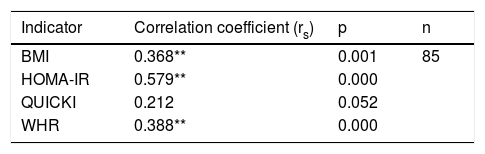
Correlation between polymorphism rs2291166 of the TJP1 gene and the BMI, HOMA-IR, the WHR and the QUICKIThe Spearman correlation test revealed a statistically significant positive correlation between the heterozygous state of polymorphism rs2291166 of the TJP1 gene and the BMI (p=0.001; average significance), HOMA-IR (p=0.000; considerable significance) and the WHR (p=0.000; average significance). By contrast, no correlation was found with the QUICKI insulin sensitivity marker (p=0.052). Thus, it was seen that the BMI, HOMA-IR and the WHR could be correlated to polymorphism rs2291166 of the TJP1 gene, but not the QUICKI (Table 4).
Spearman correlation for TJP1 gene polymorphism.
| Indicator | Correlation coefficient (rs) | p | n |
|---|---|---|---|
| BMI | 0.368** | 0.001 | 85 |
| HOMA-IR | 0.579** | 0.000 | |
| QUICKI | 0.212 | 0.052 | |
| WHR | 0.388** | 0.000 |
HOMA-IR: insulin resistance index; WHR: waist-hip ratio; BMI: body mass index; QUICKI: insulin sensitivity index.
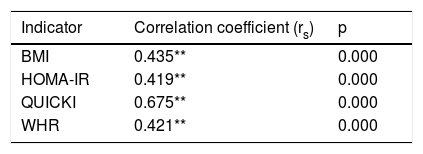
The Spearman correlation test between the (CAG)n repeat of the ATXN2 gene and the nutritional risk variables revealed an average positive correlation with the BMI (rs=0.435; p=0.000), HOMA-IR (rs=0.419; p<0.01) and the WHR (rs=0.421; p<0.01), and a highly positive correlation with the QUICKI (rs=0.675; p<0.01)(Table 5).
Spearman correlation for polymorphism of repetition (CAG)n of the ATXN2 gene (n=85).
| Indicator | Correlation coefficient (rs) | p |
|---|---|---|
| BMI | 0.435** | 0.000 |
| HOMA-IR | 0.419** | 0.000 |
| QUICKI | 0.675** | 0.000 |
| WHR | 0.421** | 0.000 |
HOMA-IR: insulin resistance index; WHR: waist-hip ratio; BMI: body mass index; QUICKI: insulin sensitivity index.
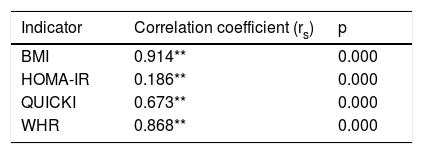
The Spearman correlation test for the DQI with respect to the indicators associated with obesity yielded a fully positive association for the BMI (rs=0.914), an average positive correlation for HOMA-IR (rs=0.186), a highly positive correlation for the QUICKI (rs=0.673) and a very strong positive correlation for the WHR (rs=0.868) (Table 6).
Spearman correlation for the DQI, BMI, HOMA-IR, WHR and QUICKI (n=85).
| Indicator | Correlation coefficient (rs) | p |
|---|---|---|
| BMI | 0.914** | 0.000 |
| HOMA-IR | 0.186** | 0.000 |
| QUICKI | 0.673** | 0.000 |
| WHR | 0.868** | 0.000 |
HOMA-IR: insulin resistance index; WHR: waist-hip ratio; BMI: body mass index; QUICKI: insulin sensitivity index.
This study is the first to describe the relationship between SNP rs2291166 of the TJP1 gene and the VNTR (CAG)n of the ATXN2 gene, as well as the DQI, and the risk parameters related to obesity in the adolescent population, such as the BMI, the WHR and HOMA-IR. While SNP rs2291166 of TJP1 exerts the greatest effect upon insulin resistance, reflected in high HOMA-IR values, the VNTR (CAG)n of ATXN2 exerts the greatest effect upon insulin sensitivity, reflected in the QUICKI values. In turn, the DQI exerts greater influence upon the indices directly related to obesity, such as the BMI and the WHR. The pathogenic and physiological effects of SNP rs2291166 of TJP1 are known.17,19 This polymorphism leads to a conformational change in ZO-1, due to the replacement of alanine with aspartate at residue 1334 of ZO-1, which results in a modification of apical-lateral or basal-lateral cell membrane permeability that can affect nutrient flow to the intestine and tissues, as well as deposits in the adipose tissue.20
The ATXN2 gene is a cellular and nutritional stress sensor. It regulates insulin sensitivity in tissues, acts as a sensor of nutrients through TORC-1, and activates nutrient transporter genes for different molecules in cell membranes, such as SLC5A6, SLC16A1, BTD, SGLT4, through the GRB2 pathway that regulates insulin receptor substrate (SUR-1). This is related to the development of type2 diabetes mellitus and obesity, with activity linked to the transcriptional activity of long and short alleles of repeat (CAG)n10. Very few studies in humans can be found in the international literature on the role of ATXN2 in carbohydrate and lipid metabolism. However, Lv et al.21 and Meierhofer et al.22 coincide in concluding that mutations implicating the loss of functions or the deactivation of ATXN2 (which are both related to greater or fewer CAG repeats) may cause susceptibility to obesity, insulin resistance and dyslipidemia. Figueroa et al.,23 Ma et al.24 and Gardiner et al.25 coincide with the present study in stating that the greater the number of repeats of polymorphism CAG of ATXN2, the greater the genetic risk of adiposity and obesity. This, combined with the high frequency of the ancestral allele of SNP rs2291166 of TJP1 - which is very common in the Mexican population10 - further increases this risk.26,27
Metagenomics has become of increasing significance for our understanding of the role played by the commensal microbiota in metabolic diseases. In the case of obesity, it constitutes a frontier of research between genetic variants and genetic expression with the host genetic factors and the environment in which both are immersed. In this regard, it has been reported that the intestinal microbiota of obese people is different from that of individuals with normal body weight.28 This in turn has repercussions in terms of energy extraction from food, fatty acid metabolism, regulation of the synthesis of intestinal hormones (incretins) involved in energy homeostasis and regulation of body adipose tissue deposits, since bacteria are directly involved in the catabolism of nutrients to facilitate their absorption.28 This symbiosis was acquired during the quaternary glaciation, when humans had to hunt for their food, run fast to survive, and spend days fasting. Thus, the presence of an intestinal microbiota allowing maximum energy to be extracted from food (when available) favored body fat storage. This was a selective advantage at that time, and is a sparing genotype factor as proposed by Neel in 1962.29–31 Humans have probably been selecting microorganisms with these properties over time. However, in modern society, characterized by a high energy content, the sparing genotype and the sparing microbiota phenotype favor adipogenesis and obesity. In effect, both our nutritional habits and food types have changed, and the intestinal sparing microbiota phenotype therefore becomes a disadvantage, contributing to fat accumulation and to the development of diseases related to insulin resistance.28
Based on the above observations demonstrating interaction between nutritional and genetic factors, it is important to consider the interaction among the microbiota, the thrifty genes of microorganisms and humans, alterations in the permeability of the cells of the intestinal mucosa secondary to disruption of the tight junctions – particularly ZO-1 (encoded by TJP1) – and changes in cell permeability related to SNP rs2291166 of TJP1, leading to conformational changes as seen in experimental models of autoimmune uveitis or cell toxicity in the case of uremia.20,32,33 In addition to this, there have been reports of increased ZO-1-mediated endothelial permeability, circulating levels of lipopolysaccharide-binding protein (LBP), and metabolic endotoxemia caused by LPS from the microbiota, these being parameters of intestinal origin associated with the development of obesity.28 Undoubtedly, studies in humans, as well as experimental in vitro and in vivo studies designed to increase our understanding of these interactions in the relationship TJP1-homeostasis-microbiota, are the pathway to elucidate TJP1 as a pathogenic mechanism in obesity. Such research falls beyond the scope of this study, however, due to legal (the age of the subjects: pediatric patients) and ethical issues, and the customs of the community from which the study subjects originated (one not very receptive to inclusion in research).
In terms of genetic and population demographics, this study is the first from Oaxaca (Mexico), taking into account Mexican national population diversity, allele frequencies and genotypes of SNP rs2291166 of the TJP1 gene and the VNTR (CAG)n of ATXN2 in a population with Chinanteca ancestry from Tuxtepec, as well as their relationship to obesity parameters. This is highly significant from the public health perspective, since the study subjects are treated by the Health Services of the State of Oaxaca through the epidemiological surveillance system. Accordingly, the polymorphisms studied may be used as predictive and preventive markers of obesity. Indeed, as in other studies, the two polymorphisms were found in Hardy Weinberg equilibrium, and the allelic and genotypic frequencies were very similar. This is consistent with the theory that the two loci where these polymorphisms are found have been highly conserved in the course of evolution and among Amerindian ethnic groups.9,15–18
This study offers an advantage over other research conducted in relation to obesity and/or overweight, since it shows the direct effect of the studied polymorphisms and of the DQI upon obesity and insulin resistance. The corresponding phenotype, at least in this study, did not overlap with metabolic syndrome or cardiovascular risk factors. The effects of the analyzed polymorphisms of TJP1 and ATXN2, and of the DQI upon HOMA-IR and the QUICKI are therefore highly suggestive. This is corroborated by examining the averages of the biochemical variables of the included subjects (Table 1), which reflect values within the normal range for glucose, cholesterol, triglycerides, HDL-cholesterol and LDL-cholesterol. This consequently excludes information bias due to the effect or the relationship they may have with dyslipidemia, diabetes mellitus or arterial hypertension. These findings should be confirmed by epidemiological studies with more index cases from the region, including the adult population, in order to validate them as biomarkers at state or regional level. This constitutes a challenge, because the area of Tuxtepec and other localities of the State of Oaxaca are characterized by environmental (such as highly caloric regional food) and cultural factors leading to obesity.34
At nutritional level, few studies are available assessing the DQI of the FAO and its direct relationship to the BMI and the WHR, corroborating similar results in the adult populations of Valles Centrales, Oaxaca (Mexico) with metabolic syndrome.35
Our study has limitations, the main one being the fact that it was not a causality study directly demonstrating the relationship between polymorphisms and the DQI and obesity-related nutritional risk parameters. It was only a study of associations requiring corroboration through molecular experimental in vivo and in vitro studies demonstrating the physiological effect of polymorphisms and the DQI, including the analysis of inflammation parameters related to intestinal permeability, such as LBP or LPS levels.20 In this regard, biopsies guided by endoscopy would be useful for analyzing the mRNA expression of intestinal barrier genes such as TJP1 and ATXN2, among others, as well as for quantifying proteins by immunohistochemistry and measuring the effect of cell permeability. This would be very difficult to do in our community setting, since invasive practices and research are very restricted, particularly in pediatric or adolescent patients.
A second limitation is that the number of subjects included in comparison with other studies on polymorphisms was very small.5–7 Nevertheless, the sample comprised over 50 chromosomes, the minimum required sample size for genetic analysis.36 Further confirmatory epidemiological studies are therefore needed in other populations. In any case, our small Chinanteco sample from Tuxtepec was a well-controlled group in which it proved possible to eliminate the bias that would have been involved if obese subjects with cardiovascular risk or metabolic syndrome parameters had been included. Moreover, the analyzed population constitutes a vulnerable group that had not been metabolically studied to date, and this constitutes a novel contribution of our study. However, we suggest increasing the number of included individuals in future studies.
In conclusion, the present study, based on association and correlation tests, demonstrates a direct relationship between polymorphisms and the DQI and certain obesity risk parameters: SNP rs2291166 of the TJP1 gene exerts a greater influence upon insulin resistance (HOMA-IR), while the VNTR (CAG)n of ATXN2 influences insulin sensitivity (QUICKI), and the DQI exhibits an effect upon the BMI and the WHR.
Acknowledgements and fundingThanks are due to CONACYT for postgraduate grant no. 2018 in favor of Arturo Caballero-Avendaño. Funding is acknowledged from academic body CA-UDG-701 Immune-metabolism and aging, of the University of Guadalajara, with registry no. 01-34-2019, and health circumscription number 3, Health Services of the State of Oaxaca, registry no. J3/EP/106/2019.
Conflicts of interestNone.
Please cite this article as: Aldrete MEA, López-Toledo S, Avendaño AC, Ruano NV, Hernández REN, Alvarado LJF, et al. Asociación entre marcadores de riesgo nutricionales con los polimorfismos rs2291166 de TJP1 y el VNTR (CAG)n de ATXN2 en población mexicana adolescente con obesidad. Endocrinol Diabetes Nutr. 2021;68:99–108.
