

Shared decision-making between patients and healthcare professionals involves active participation and the availability of all necessary information from the best scientific evidence. In this regard systematic reviews (SR) have become an essential aspect in driving scientific knowledge synopses when taking medical decisions.1,2 However, not all nurses have the time, skills and resources to identify, evaluate and interpret this evidence and incorporate it into shared healthcare decisions. For appropriate usage reviews must meet with all the essential requisites. If this is not so we would find ourselves looking at narrative or expert reviews essentially based on opinion and therefore not contrastable. A SR is the only tool capable of containing all the empirical evidence to meet with the previously selected criteria to respond to a specific research question. For this, systematic methods and criteria are used to help contrast outcomes, extract conclusions and take decisions.3 It is therefore of utmost importance to acquire the necessary skills and expertise to judge their quality, with critical analysis of their strengths and weaknesses to correctly interpret results and evaluate their practical use for patients. SR may be from observational studies, diagnostic or prognostic tests or from qualitative studies, but their most generalized use is in studies of intervention or treatment, i.e. clinical trials.
When possible and appropriate, data from the SR are combined with statistical methods in meta-analysis, leading to quantitative summaries of the review results and graphs, in addition to an examination of their consistence and data comparisons.4
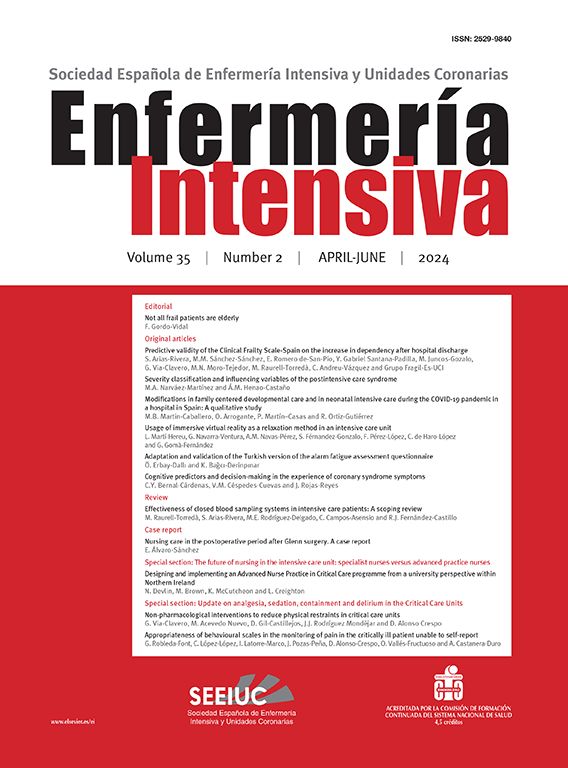
The essential elements of a SR are: a set of clearly established objectives, with eligibility criteria of previously defined studies; an explicit and reproducible methodology and a systematic search to identify all possible studies; an explicit evaluation of the validity of the results of included studies through evaluation of different bias risks; a systematic summary of the characteristics and results of studies included and their interpretation (Fig. 1).5
. Own source: adapted from Gisbert and Bonfill.5")
Steps required to prepare a systematic review (For interpretation of the references to colour in this figure legend, the reader is referred to the web version of this article).
Own source: adapted from Gisbert and Bonfill.5
Following an exhaustive search for information in the different data bases and their coding it is necessary and recommendable to assess the quality of evidence and risk of bias, using well established tools to help generate recommendations. A multitude of scales and lists have been identified to assess the validity and quality of the studies. All of these require training and identification of three basic aspects to assess: internal validity, results (magnitude, direction and precision), and external validity.6,7
Internal validity refers to the ability to avoid systematic errors (biases) through study design and completion while external validity is related to the generalisation or applicability of results of a specific population group.
The main types of biases are: selection bias, related to the process of comparable group recruitment (random assignation of treatments, concealment); performance bias related to the differences in attention offered; attrition and loss bias, related to the losses of participants during the study and detection bias, related to the systematic differences between the groups of comparison in assessment of results.
Risk of bias assessment should be made by two independent researchers and should be blind. For intervention studies one of the most common risk of bias assessment tools is the Cochrane Collaboration. This tool includes variables such as randomisation, allocation concealment sequence, participant and assessor blinding, follow-up losses, data analysis management and reporting of results, and classifying the risk of bias into high, low and unclear risk.3
For non experimental studies there are different methods of assessment. Some authors suggest the Newcastle-Ottawa scale or the ACROBAT-NRSI tool, developed by the Cochrane Collaboration. Useful verification lists for improving article publication also exist. However, quality is not ensured by whether they are well written or not. These tools are: STROBE (observational studies), STARD (diagnostic method studies), CONSORT (experimental studies) and Preferred Reporting Items for Systematic reviews and Meta-analysis (PRISMA).4,8,9
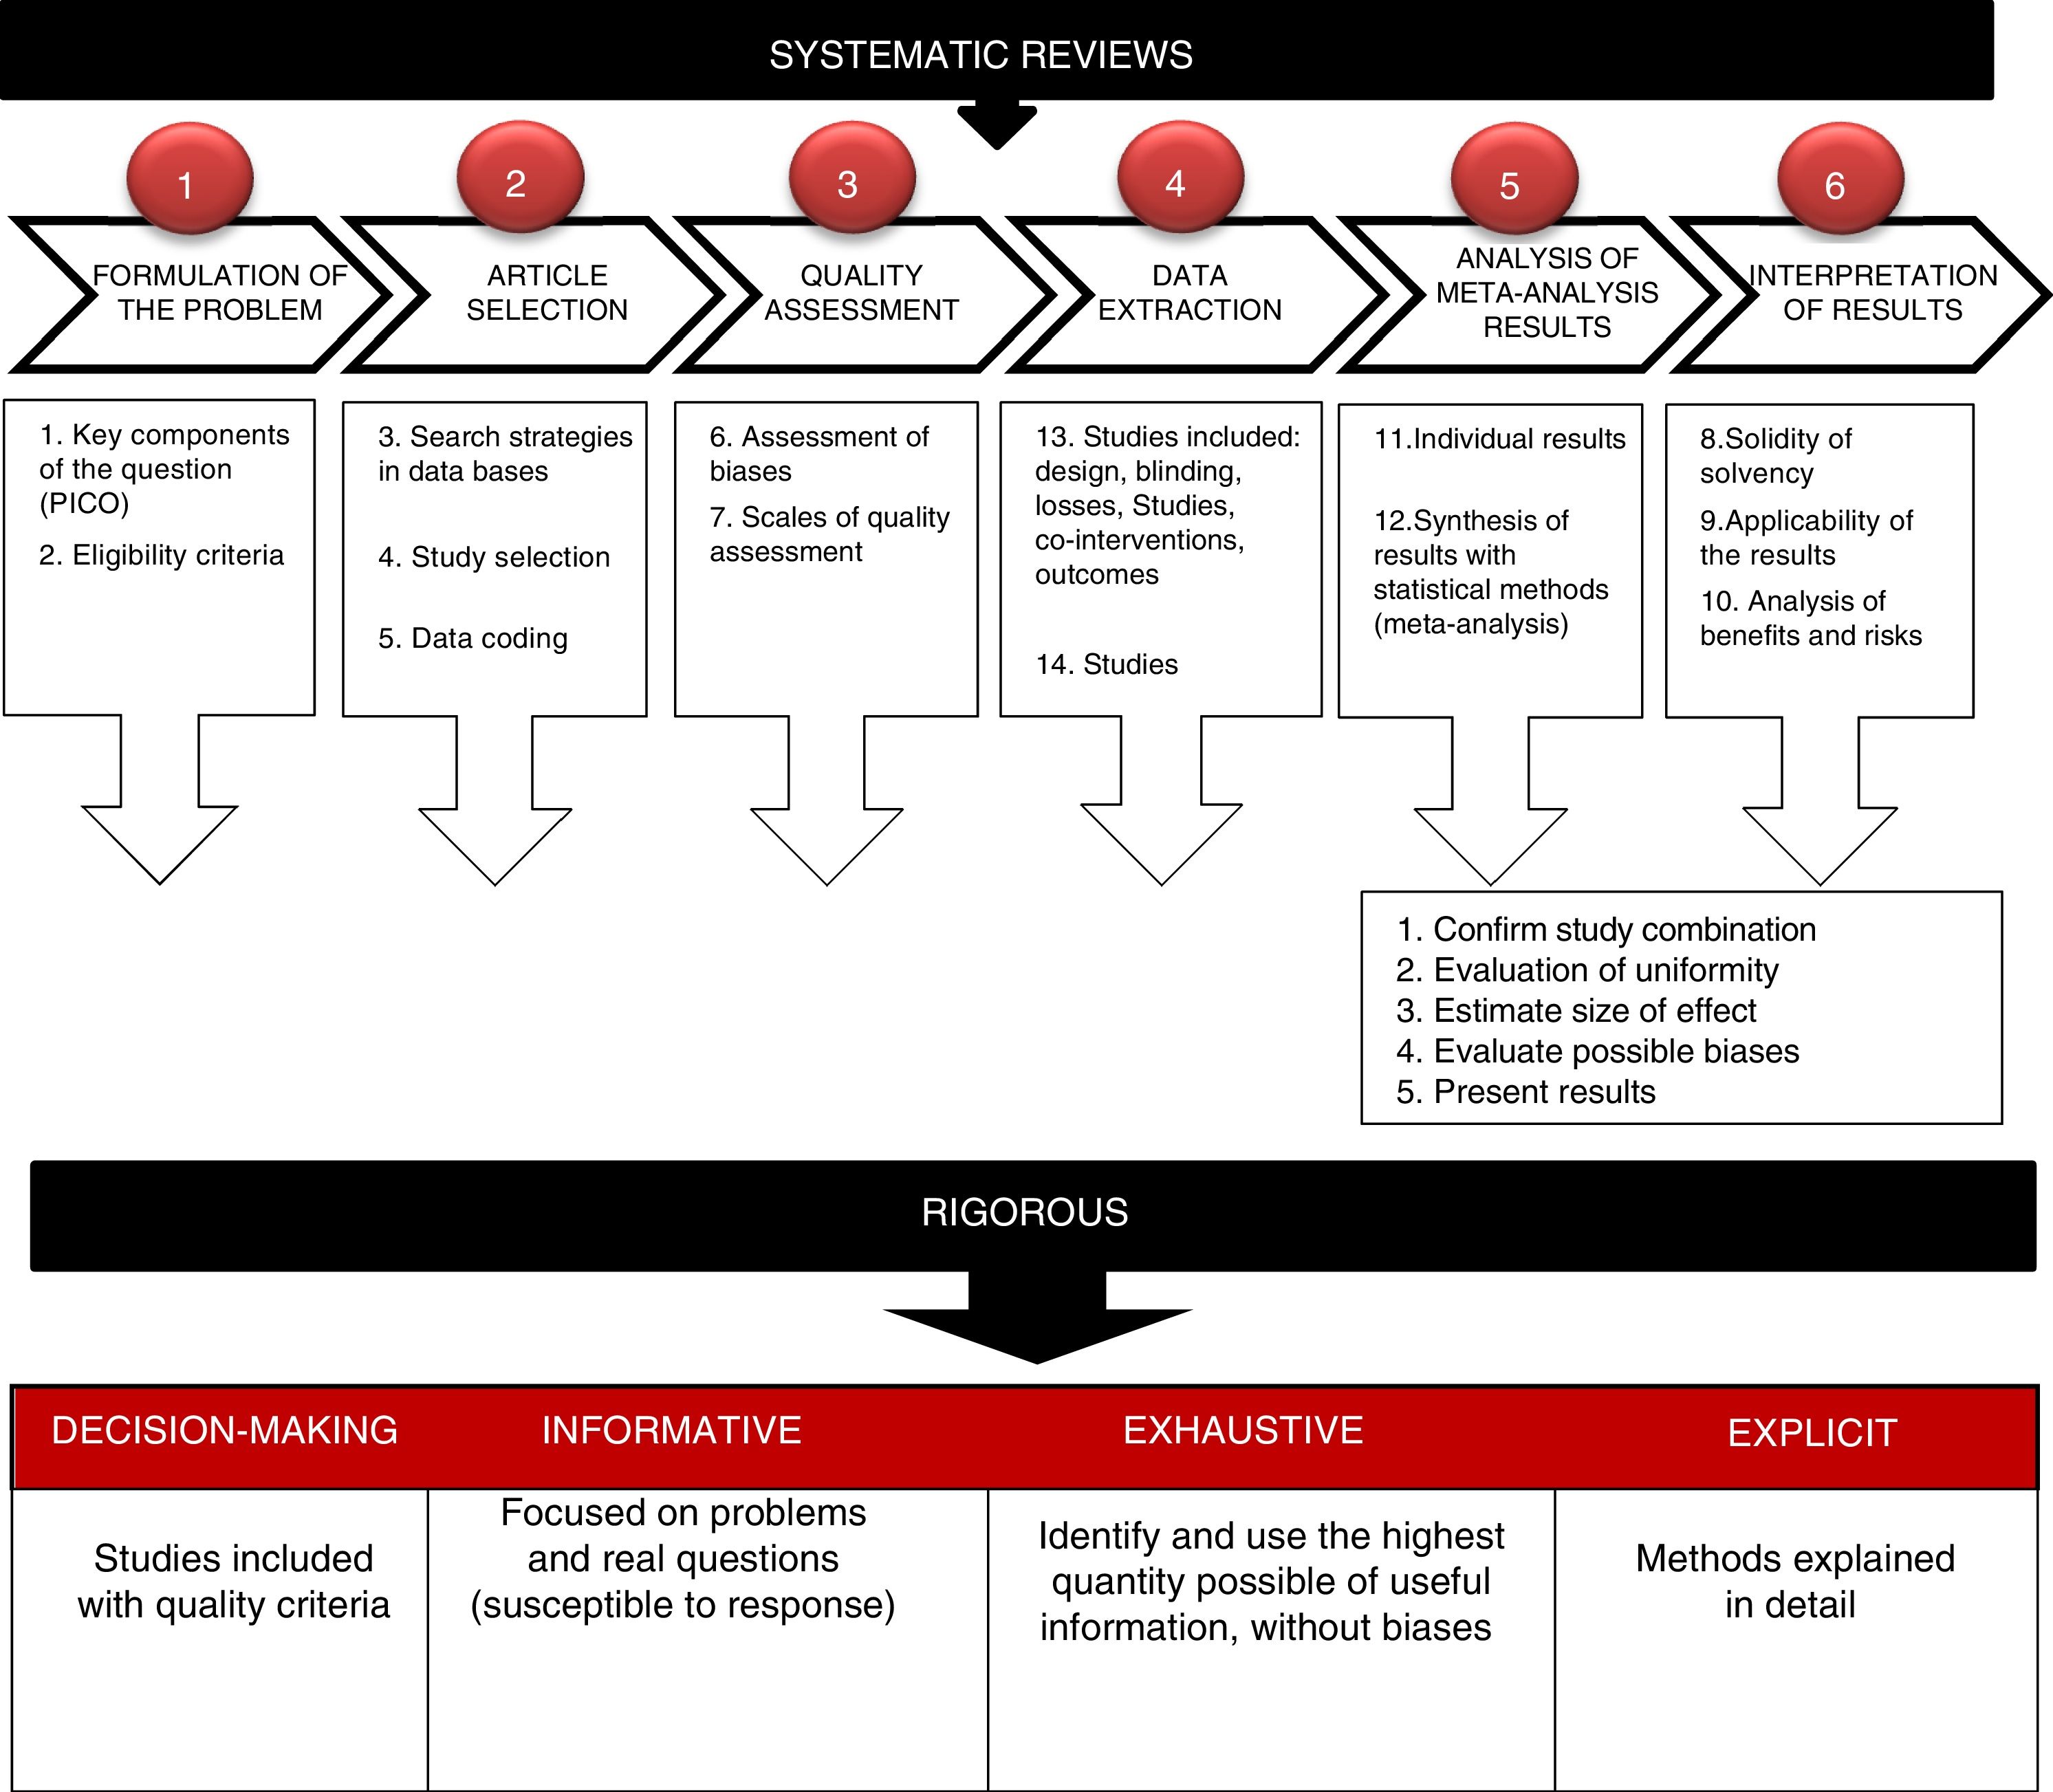
Extraction, analysis and interpretation of resultsData from a SR used appropriately are a very useful tool for reaching conclusions which may help to avoid interpretation errors. Firstly, individual study data should be obtained and later statistical methods may be used to summarise these data.3 The findings from these studies are systematically organised and contained in a summary table, preventing any inclusion of comparisons or results about which there are no data. Results are aggregated to form a graph on clinical intervention efficacy. The most common manner of presenting data is through a graph called “forest plot” or diagram of effects, which shows the results of a meta-analysis (Fig. 2). In this graph the results from each study are represented by an OR (odds ratio) with a square (effect size summary measurement) and a horizontal line (confidence interval [CI] of 95%). The size of the square varies depending on the amount of information each study has and the length of the line represents the precision of the effect of treatment. As a result, the longer the line, the lower the effect size will be (normally, due to the small sample size) and the less power to detect significant differences. When there are no differences between treatments, the OR is 1, implying the value of non effect and is represented by a vertical line; values less than 1 are to the left and correspond to the favourable effect of the treatment. If meta-analysis is conducted, the OR is represented with a rhombus.5,10,11

Representation outline of meta-analysis primary studies using forest plot or diagram of effects.
Own source. Adapted from Urrutia and Bonfill.9
After confirming that results may be combined, the heterogeneity is assessed to ask whether study results are similar or homogeneous and may be combined with one another. To do this, the CI of each study is assessed and if they do not overlap they cannot be combined, because the observed differences are not randomly explained. Statistical tests which assess heterogeneity are usually lower in statistical power.3,8,10,11 The homogeneity test may be carried out using the chi square test and if the result is not statistically significant it is interpreted that the studies are homogenous and may be combined. If in contrast the result is significant (p<.01), the conclusion is that they are heterogeneous and not combinable. In this case the authors may decide to terminate the study or continue with analysis to measure the magnitude of the effect.
Apart from the OR, another statistic used is the number needed to treat (NNT), which is obtained from the risk difference, a useful form of expressing the results.
Sometimes it is interesting to conduct a subgroup analysis to evaluate a highly specific group of participants. However, this type of analysis should be minimized when possible.
Different statistical programmes are available for SR evaluation. One of the most commonly used is Review Manager (RevMan), a statistics software from the Cochrane Collaboration for SE and meta-analysis which interacts with GRADEpro to generate summary tables and evaluation of evidence. Other programmes which offer good results are Stata® and the R programmes®.4,7
Aspects such as solidity of evidence, applicability of results, risk-benefit balance or intervention costs may be of some help when taking decisions and should be discussed.
ConclusionsOne of the most important aspects of SR is to become aware of the primary information obtained from results and decide to what extent it may be applied to certain patients. However, it is only through care that the professionals may decide whether the results are clinically relevant to be applied to specific patients in different environments.
The volume and capacity of what we know exceeds our individual capacity and the benefits may thereby be safely and reliably put to correct use.
Conflict of interestsThe author has no conflict of interests to declare.
Please cite this article as: Robleda G. Cómo analizar y escribir los resultados de una revisión sistemática. Enferm Intensiva. 2019;30:192–195.