


To describe the characteristics of the body components and phase angle of patients with MAFLD according to those different to fibrosis and hepatic steatosis.
Material and methodsObservational and descriptive study in a cohort of 585 volunteers from our center with MAFLD criteria. The risk of liver fibrosis was determined by APRI, NAFLD score and FIB-4; at an indeterminate and high risk of fibrosis, a transient elastography (Fibroscan) were realize. Bioimpedance body composition analysis (SECA®) was performed. Patients with ET and SECA® registry were included. Bioimpedance body composition analysis (SECA®) was performed. Patients with ET and SECA® registry were included.
Results125 participants (21.4%) were evaluated, age 53.9 ± 13.9 years, 62.1% women, BMI 33.2 ± 5.8 kg/m2. The SECA® analysis showed mean fat mass of 42% ± 7.32 and muscle mass 21.18 kg ± 6.6. The PhA was 5.1 ± 0.69, in women 4.92 ± 0.62 and men 5.41 ± 0.70. PhA in patients without fibrosis was 5091 vs with fibrosis 5121, (P = .813). In advanced fibrosis, it reported a low value compared to the rest of the groups (P = .031). The PhA in S3 was higher compared to S1 and S2 (5.3 vs 4.82, 4.81) (P = .027).
ConclusionsIn MAFLD the PhA was lower than the healthy Mexican population. In patients without fibrosis and severe steatosis, PhA rises proportionally to the increase in fat mass and BMI and in advanced liver fibrosis, PhA decreases.
Describir las características de la composición corporal y ángulo de fase (AF) en pacientes con MAFLD de acuerdo fibrosis y esteatosis hepática.
Pacientes y métodosEstudio transversal, observacional y descriptivo en una cohorte de 585 voluntarios de nuestro centro con criterios de MAFLD. El riesgo de fibrosis hepática se determinó por APRI, NAFLD score y FIB-4; en riesgo indeterminado y elevado de fibrosis se realizó elastrografía hepática de transición (ET) con Fibroscan®. Se realizó análisis de la composición corporal por bioimpedancia (SECA®). Se incluyeron pacientes con registro de ET y SECA®.
ResultadosSe evaluaron 125 participantes (21.4%), edad 53.9 ± 13.9 años, 62.1% mujeres, IMC 33.2 ± 5.8 kg/m2. El análisis SECA® mostró media de masa grasa de 42% ± 7.32 y masa muscular 21.18 kg ± 6.6. El ángulo de fase fue 5.1 ± 0.69, en mujeres 4.92 ± 0.62 y hombres 5.41 ± 0.70. El AF en pacientes sin fibrosis fue 5.091 vs con fibrosis 5.121, (P = .813). En fibrosis avanzada se reportó valor bajo en comparación con el resto de los grupos (P = .031). El AF en S3 fue mayor en comparación con S1 y S2 (5.3 vs 4.82, 4.81) (P = .027).
ConclusionesEn MAFLD el AF fue menor vs población sana mexicana. Pacientes sin fibrosis y esteatosis severa el AF se eleva proporcional al incremento de masa grasa e IMC y en fibrosis hepática avanzada el AF disminuye.
Ever since it was first reported, fatty liver disease has been a subject of particular interest in gastroenterology due to its close relationship to metabolic abnormalities and risks of progression to cirrhosis and development of hepatocellular carcinoma.1 Therefore, joint efforts have been made to standardise the diagnostic criteria, and with those efforts, the term “metabolic associated fatty liver disease” (MAFLD) arose in 2020. Since then, MAFLD has been defined as fatty liver disease demonstrated on imaging, biomarkers or biopsy plus evidence of at least one of the following: overweight or obesity; type 2 diabetes; and, in patients with a normal body mass index (BMI), evidence of metabolic dysregulation.2
Various methods for measuring body composition have been implemented for purposes of comprehensive clinical evaluation of patients with MAFLD, such as dual-energy X-ray absorptiometry (DXA), magnetic resonance imaging and computed tomography. These evaluations measure muscle mass and identify sarcopenia, which has proven to be a factor of vital importance in the clinical course and outcome of MAFLD; they also establish the relationship between fat mass and metabolic syndrome.3 One technique that has shown growth due to its practicality and accessibility is bioimpedance spectroscopy (BIS). BIS is characterised by being a non-invasive, painless, easy and affordable procedure that determines the passive electrical characteristics of tissue by applying a low-intensity alternating electrical current that is imperceptible to the patient; it is based on the different behaviour of the cell structure in response to the electrical current applied, thus distinguishing between the different body compartments. A low-amplitude electrical current is applied through electrodes in contact with the skin, which record levels of impedance (Z) at different frequencies (Hz) in the tissue evaluated to calculate its resistance (R) and reactance (Xc) and, with that, mathematically determine the phase angle (PA) as well as the percentages of lean mass, fat mass and muscle mass.4,5 The PA is the value in degrees of the curve that results from the impedance record at different frequencies. As it is directly proportionate to a system's reactance and resistance, any tissue-level abnormality with repercussions for such electrical properties will be directly reflected in the PA. Pathological abnormalities tend to decrease the PA value; for this reason, it is a good predictor of prognosis and mortality in patients on haemodialysis; patients with cancer, human immunodeficiency virus (HIV) infection or lung diseases; postoperative patients; and patients with chronic liver diseases, congestive heart failure or other conditions.6 Savegnago et al.4 reported applications of BIS to monitoring of chronic diseases and highlighted the PA as the parameter with the best clinical applicability, as they observed deviations from normal levels in different diseases.7–9
Fibrosis and subsequent cirrhosis represent the final outcome of chronic liver diseases. In early-stage fibrosis, the PA has been seen to show a trend towards recording determinations below the lower limit of normal.10 However, in patients with fatty liver disease, clear trends have not been found and outcomes remain a subject of debate.11 It is important to note that, in chronic liver disease, deviations in the PA may be present even before the appearance of abnormalities in other markers of undernutrition. Considering this and the fact that abnormalities in nutritional status are closely linked to survival, the European guidelines on nutrition in patients with liver disease recommend daily determination of BIS with an emphasis on measurement of muscle mass. As ascites and oedema are common abnormalities in advanced liver disease, they limit the reliability of the different anthropometric methods for monitoring of nutritional status; evaluation with BIS and the PA hold potential as a day-to-day tool in clinical evaluation.12
Therefore, the objective of our research study was to report the characteristics of body components (fat mass, lean mass and muscle mass) in patients with MAFLD, as well as the characteristics of the PA depending on the different grades of fibrosis and fatty liver disease.
Patients and methodsThis was a cross-sectional, observational, descriptive study conducted in a cohort of 585 patients seen at the Instituto de Investigaciones Médico-Biológicas [Medical/Biological Research Institute] at Universidad Veracruzana [Veracruz University] and the Centro de Servicios en Salud [Health Services Centre] (CESS) from February to March 2020. Following targeted sampling, a cohort of subjects residing in the municipalities of Veracruz and Boca del Río, in the state of Veracruz, was recruited. After having granted their informed consent, these subjects underwent a comprehensive medical evaluation consisting of anthropometrics (weight, height and BMI), clinical chemistry (blood count, glucose, creatinine, lipid panel, aspartate aminotransferase [AST], alanine aminotransferase [ALT], alkaline phosphatase [AP], bilirubin and albumin), Homeostatic Model Assessment for Insulin Resistance (HOMA-IR) score, liver ultrasound and analysis of body composition by BIS (SECA®), which consisted of determining muscle mass, lean mass, fat mass and PA, the latter being interpreted as low, normal or high depending on each patient's age and BMI. Subsequently, NAFLD Fibrosis Score, AST-to-Platelet Ratio Index (APRI) and FIB-4 scores were calculated, and patients at high risk of significant fibrosis underwent transient elastography (TE) with FibroScan®.
Subjects 18–85 years of age who met the diagnostic criteria for MAFLD and had complete records for SECA® and TE with FibroScan® were included. Patients with a diagnosis of cancer or any terminal illness and pregnant women were excluded.
The results were analysed with the IBM SPSS® Statistics software program, version 22.0, depending on the sample distribution which was determined using the Kolmogorov–Smirnoff test and subsequently corroborated using the Shapiro–Wilk test. Mean and standard deviation were calculated for nominal variables. Spearman's rho was used to report monotonic associations and Pearson's p was used in case of a linear correlation. A P value <.05 was considered statistically significant.
The project was conducted in compliance with good clinical practice principles with the prior approval of the independent ethics committee of the Instituto de Investigaciones Médico-Biológicas at Universidad Veracruzana with the number IIMB-UV 2021/02.
ResultsPopulation characteristicsOf the epidemiological cohort, which included 585 subjects, 271 (46%) volunteers met the diagnostic criteria for MAFLD; 139 patients were excluded as they lacked complete TE and/or SECA® reports. Altogether, we evaluated 125 patients (22.5%) who met the inclusion criteria, of whom 82 (62.12%) were women and 50 (37.8%) were men, with a female-to-male ratio of 1.64:1. The mean age was 53.9 ± 13.9 years. The mean BMI was 33.2 ± 5.8 kg/m2. A total of 51 patients (39.3%, the largest share) had grade 1 obesity, 23 (17.4%) had grade 2 obesity, 16 (12.1%) had grade 3 obesity, 37 (28%) had overweight and four (3%) had normal weight. Regarding comorbidities related to metabolic dysregulation, type 2 diabetes was found in 18 (13.7%) patients, systemic hypertension in 42 (32%) patients and dyslipidaemia (hypercholesterolaemia and/or hypertriglyceridaemia) in 57 (43.1%) patients. Table 1 lists clinical chemistry values according to fibrosis severity on TE.
General characteristics of patients with MAFLD and their relationship to grade of liver fibrosis on TE (n = 132).
| Grade of fibrosis on TE | Correlation | ||||||
|---|---|---|---|---|---|---|---|
| Variables | n = 132 (%) | 0n = 43 (%) | 1n = 29 (%) | 2n = 19 (%) | 3n = 19 (%) | 4n = 22 (%) | Spearman's rho P |
| Sex | |||||||
| Male | 50 (37.8) | 17 (12.9) | 11 (8.3) | 5 (3.8) | 8 (6.1) | 9 (6.8) | NC |
| Female | 82 (62.12) | 26 (19.7) | 18 (13.6) | 14 (10.6) | 11 (8.3) | 13 (9.8) | NC |
| Age (years) | 53.9 ± 13.9 | 52 ± 14 | 53 ± 14 | 52 ± 13 | 55 ± 11 | 61 ± 11 | R: 0.19; P = .029 |
| BMI (kg/m2) | 33.2 ± 5.8 | 31.3 ± 3.9 | 34.2 ± 7.3 | 32.3 ± 4.3 | 36 ± 6.7 | 34.4 ± 6.1 | R: 0.23; P = .007 |
| Normal weight | 4 (3.03) | 2 (1.5) | 1 (0.8) | 1 (0.8) | 0 | 0 | |
| Overweight | 37 (28) | 14 (10.6) | 9 (6.8) | 4 (3.0) | 5 (3.8) | 5 (3.8) | |
| G1 obesity | 52 (39.3) | 22 (16.7) | 8 (6.1) | 11 (8.3) | 4 (3.0) | 7 (5.3) | |
| G2 obesity | 23 (17.4) | 4 (3.0) | 5 (3.8) | 2 (1.5) | 4 (3.0) | 8 (6.1) | |
| G3 obesity | 16 (12.1) | 1 (0.8) | 6 (4.5) | 1 (0.8) | 6 (4.5) | 2 (1.5) | |
| Comorbidities | |||||||
| T2DM | 18 (13.7) | 6 (4.6) | 2 (1.5) | 3 (2.3) | 3 (2.3) | 4 (3.1) | NC |
| SH | 42 (32) | 15 (11.5) | 8 (6.1) | 6 (4.6) | 2 (1.5) | 11 (8.4) | NC |
| Hypercholesterolaemia | 28 (21.1) | 8 (6.1) | 5 (3.8) | 5 (3.8) | 5 (3.8) | 5 (3.8) | NC |
| Hypertriglyceridaemia | 29 (22) | 4 (3.0) | 5 (3.8) | 5 (3.8) | 9 (6.8) | 6 (4.5) | R: 0.246; P = .004 |
| Laboratory | |||||||
| PLT (⋅103/mm3) | 220 ± 62 | 239 ± 61 | 214 ± 47 | 230 ± 64 | 224 ± 65 | 184 ± 67 | R: –0.204; P = .019 |
| Glucose (mg/dl) | 113 ± 51 | 107 ± 42 | 108 ± 48 | 115 ± 55 | 105 ± 44 | 142 ± 67 | R: 0.173; P = .047 |
| TB (mg/dl) | 0.73 ± 0.36 | 0.64 ± 0.20 | 0.70 ± 0.42 | 0.74 ± 0.25 | 0.76 ± 0.3 | 0.92 ± 0.59 | R: 0.186; P = .032 |
| IB (mg/dl) | 0.62 ± 0.30 | 0.55 ± 0.18 | 0.59 ± 0.36 | 0.63 ± 0.21 | 0.63 ± 0.21 | 0.78 ± 0.47 | R: 0.201; P = .021 |
| DB (mg/dl) | 0.11 ± 0.12 | 0.11 ± 0.14 | 0.10 ± 0.09 | 0.11 ± 0.06 | 0.13 ± 0.18 | 0.13 ± 0.13 | NC |
| AST (IU) | 40.4 ± 20.4 | 31.2 ± 11.7 | 37.1 ± 17.3 | 44 ± 21.1 | 48.8 ± 25.2 | 52.6 ± 24.1 | R: 0.474; P < .001 |
| ALT (IU) | 45.8 ± 34.5 | 30.5 ± 15.5 | 45.3 ± 29.4 | 58.1 ± 42.6 | 65.5 ± 54.5 | 48.8 ± 27.3 | R: 0.42; P < .001 |
| Albumin | 4 ± 0.29 | 4.1 ± 0.26 | 4 ± 0.2 | 4.1 ± 0.2 | 4.0 ± 0.2 | 3.8 ± 0.04 | NC |
| LDL (mg/dl) | 112 ± 33.2 | 117.9 ± 27.2 | 112.6 ± 38 | 120.4 ± 37.3 | 105.4 ± 31.1 | 98.2 ± 32.7 | NC |
| HDL (mg/dl) | 52.4 ± 15.6 | 51.8 ± 20.1 | 53.4 ± 11.3 | 52.7 ± 11.2 | 53.1 ± 11.9 | 51.5 ± 17.4 | NC |
| TG (mg/dl) | 186.6 ± 83.5 | 179.8 ± 89.9 | 211.3 ± 102 | 192 ± 60.8 | 172.4 ± 59.7 | 175 ± 75.95 | NC |
| HOMA-IR | 3.5 ± 8.8 | 2.7 ± 3.9 | 2.4 ± 1.8 | 2.2 ± 1.4 | 4.22 ± 7.12 | 7.31 ± 19.5 | NC |
ALT: alanine aminotransferase; AST: aspartate aminotransferase; BMI: body mass index; DB: direct bilirubin; G: grade; HDL: high-density lipoproteins; IB: indirect bilirubin; LDL: low-density lipoproteins; NC: no correlation; PLT: platelets; SH: systemic hypertension; T2DM: type 2 diabetes mellitus; TB: total bilirubin; TG: triglycerides.
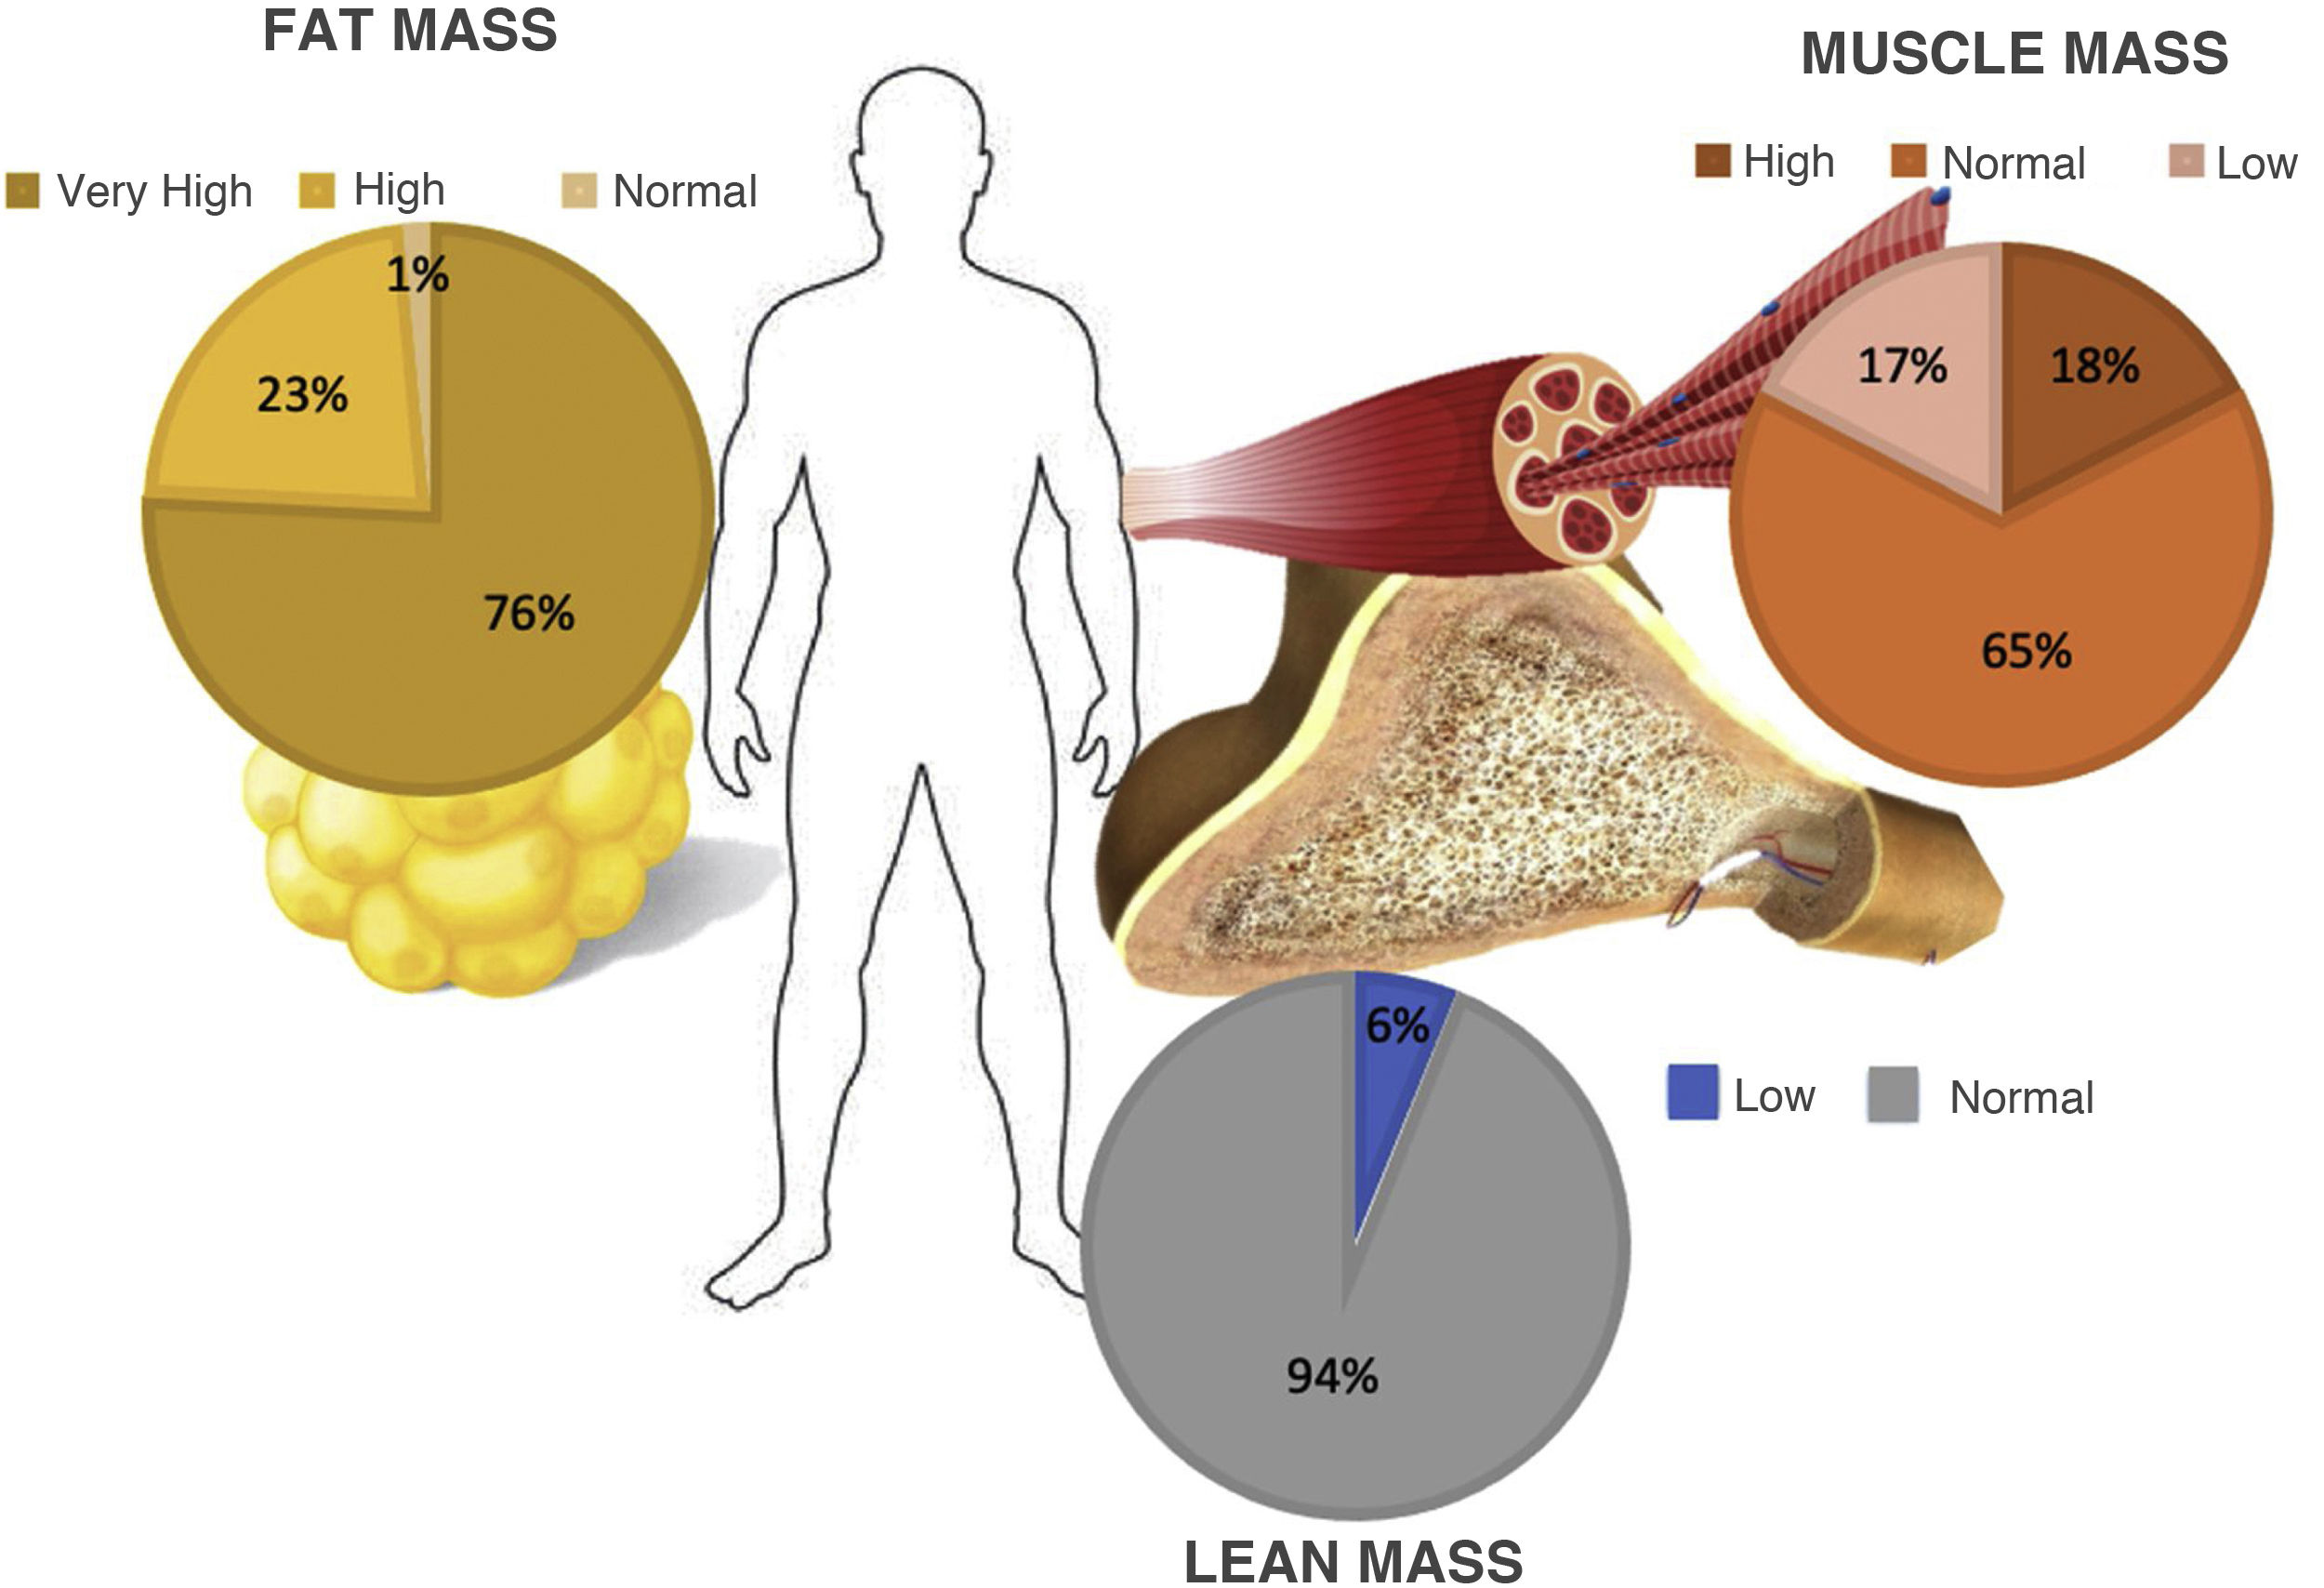
Evaluation of BIS showed a mean percentage of lean fat of 42.6% ± 7.32. 100 patients (75.7%) were classified with a very high degree of lean mass for their BMI, 30 (22.7%) were classified with a high degree, and the remaining two patients (1.5%) had normal fat mass percentages.
Muscle mass had a mean value of 21.18 ± 6.6 kg. Just 23 patients (17.4%) had a muscle mass percentage below the range according to their age, 86 (65.1%) were found to be below the lower limit of normal and 23 (17.4%) scored above the upper limit of normal. In addition, analysis of lean fat determined that eight patients (6%) were below the lower limit of normal corresponding to their BMI, while the 124 remaining patients (93.9%) had normal values (Fig. 1). PA analysis yielded a mean of 5.1 ± 0.69: 4.92 ± 0.62 in women and 5.41 ± 0.70 in men. PA values below the ranges corresponding to their age were seen in 31 cases (23.4%) out of the total study population.
Evaluation by transient elastography with FibroScan®.")
TE analysis reported fibrosis in 89 patients (67.4%), distributed as follows: F1 in 29 (21.9%), F2 in 19 (14.3%), F3 in 19 (14.3%) and F4 in 22 (16.6%). In 43 patients (32.5%), fibrosis was ruled out (F0). Regarding analysis of liver fat infiltration by controlled attenuation parameter (CAP), 114 (86.3%) patients were reported to have estimated fat infiltration greater than 5% (grade S1 or higher on TE); these patients were distributed as follows: 17 subjects in S1 (12.8%), 11 (8.3%) in S2 and 86 (65.1%) in S3.
A positive correlation was seen between age and grade of fibrosis (rho 0.19; P = .029). Similarly, grade of fibrosis increased in direct proportion to BMI (rho 0.23; P = .007). A statistically significant correlation was found between a personal history of hypertriglyceridaemia and severity of fibrosis (rho 0.24; P = .004). Analysis of both variables by χ2 ruled out such a relationship as an effect of chance. χ2 value: 12.12; P = .016.
Concerning laboratory results, an inverse relationship was seen between platelet count (rho –0.204; P = .019) and grade of fibrosis. In addition, a directly proportionate relationship was found between grade of fibrosis and the following variables: glucose, indirect bilirubin (IB), direct bilirubin (DB), AST and ALT. In all cases, the relationship was statistically significant (P < .05) (Table 1).
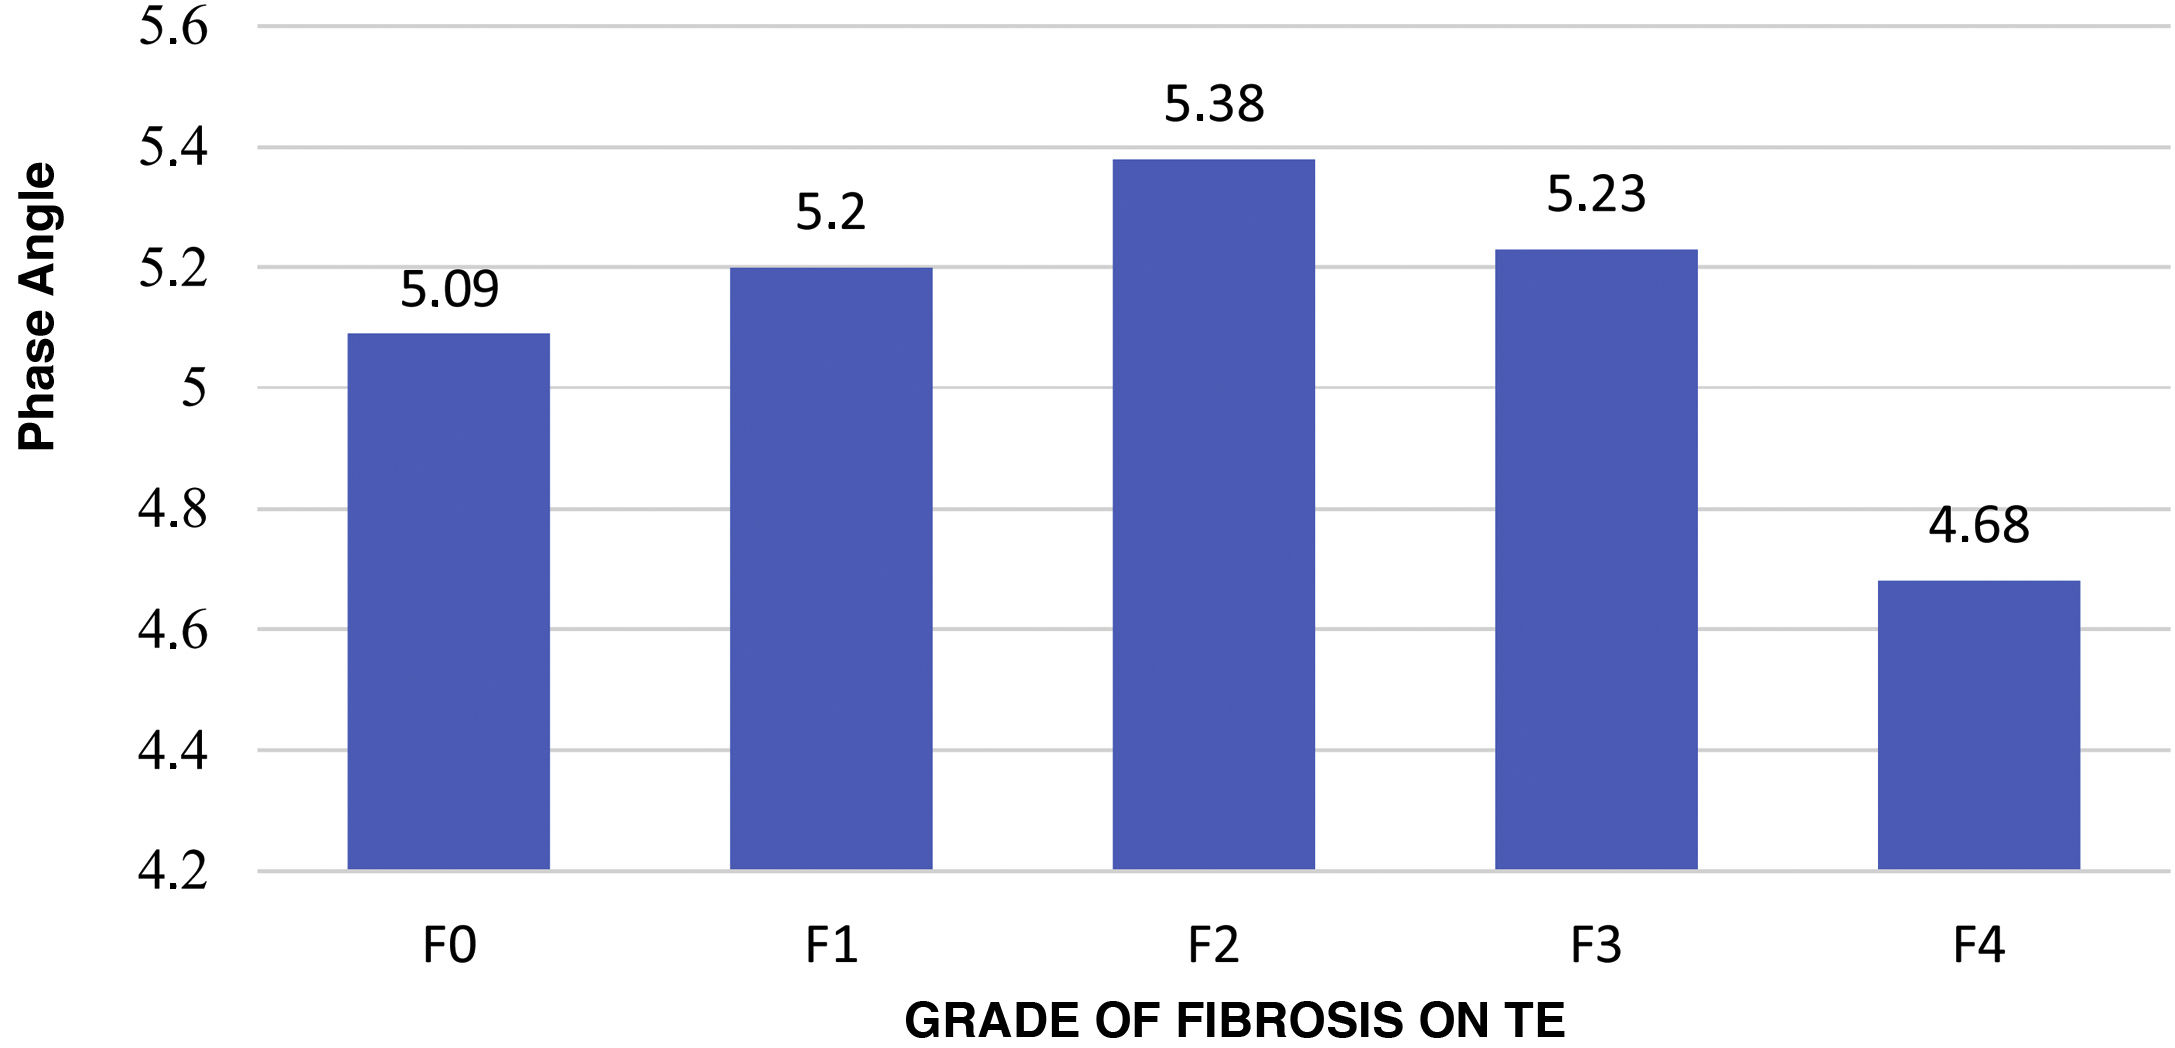
Correlation between SECA® and TE analysisThe mean PA in patients without fibrosis (F0) was 5.091 versus 5.121 in patients with fibrosis, with no significant differences (P = .813). However, patients with advanced fibrosis were seen to achieve lower PA values compared to all other groups, yielding a significant difference (P = .031); see Fig. 2. The correlation between the PA and fibrosis (kPa) showed inverse proportionality with a Pearson correlation coefficient of –0.27 (P = .001).

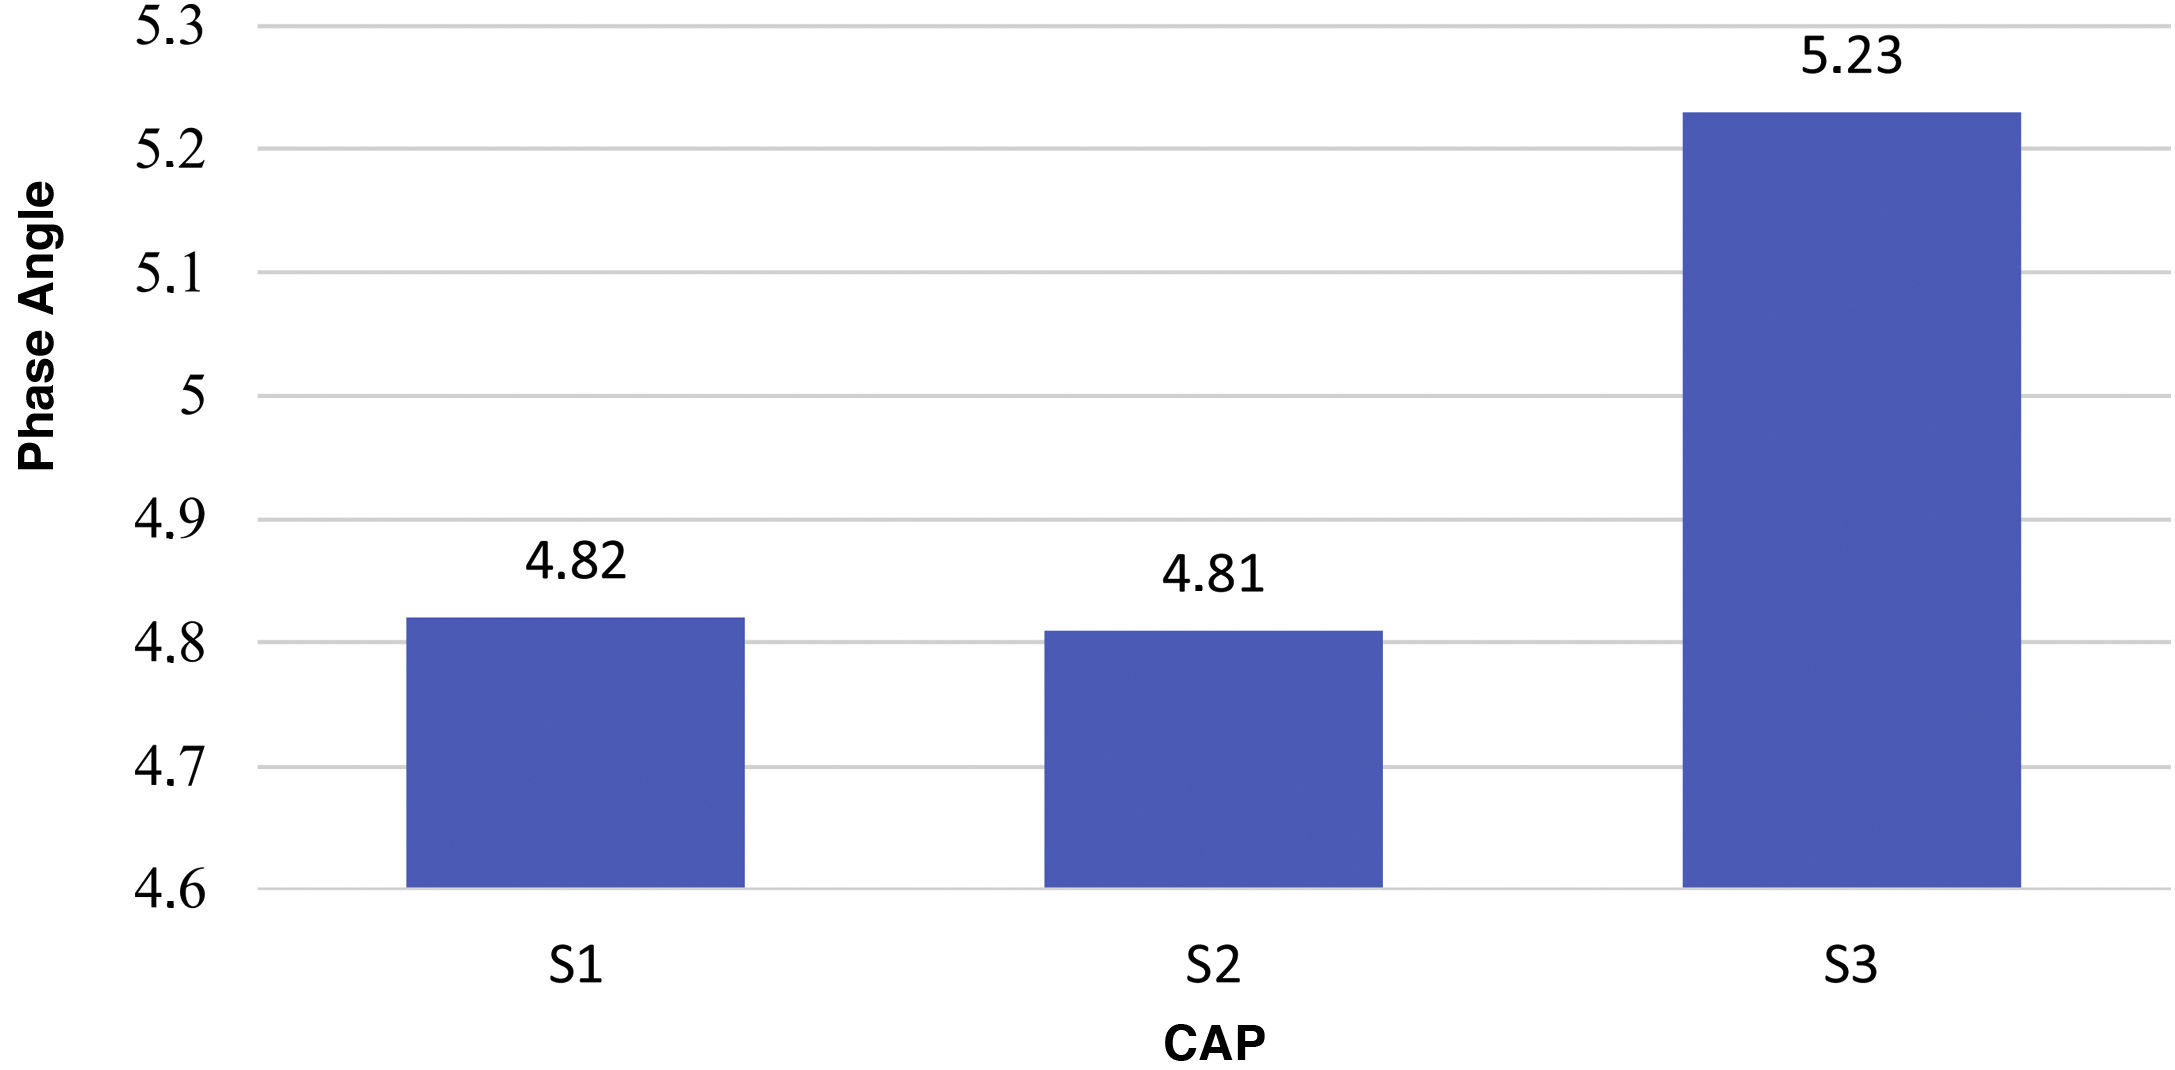
The mean PA in patients with S3 was higher compared to S1 and S2 (5.3 versus 4.82): 4.81 (P = .027). Fig. 3 shows mean PA values in relation to CAP (P = .001). A positive correlation was found, with a Spearman's coefficient with a value of 0.285 (P < .001).

Consideration of PA percentiles revealed that, of the patients with a PA classified as “below the normal range” for their BMI and age, 15 (13.9%) subjects had liver fibrosis on TE. No significant differences were found between the distribution by percentiles and the presence of significant fibrosis (F3, F4) (P = .862). Table 2 shows the distribution of patients with MAFLD by percentiles according to the presence of fibrosis and its severity (P = .582).
Distribution by PA percentiles in patients with MAFLD and its relationship to liver fibrosis on TE.
| Grade of fibrosis on TE | |||||
|---|---|---|---|---|---|
| Percentile | F0 | F1 | F2 | F3 | F4 |
| 1 to 5 | 8 | 4 | 1 | 0 | 4 |
| 6 to 10 | 3 | 2 | 0 | 2 | 1 |
| 11 to 25 | 7 | 3 | 3 | 5 | 3 |
| 26 to 50 | 7 | 7 | 2 | 3 | 4 |
| 55 to 75 | 5 | 5 | 3 | 4 | 2 |
| 76 to 90 | 2 | 3 | 4 | 3 | 0 |
| 91 to 100 | 3 | 1 | 3 | 0 | 1 |
| Total | 35 | 25 | 16 | 17 | 15 |
MAFLD is the most common liver disease around the world, with an estimated prevalence of 25%–30% in the global population.13,14 Liver fibrosis has been shown to be the main prognostic factor in this disease, regardless of severity of fat infiltration.15 Our study, conducted in a Mexican population considering the new MAFLD criteria, found that 22.5% of healthy volunteers met the diagnostic criteria for fatty liver disease; notably, of these, 30.9% had advanced-stage fibrosis (F3 or F4). That is to say, up to one sixth of patients with MAFLD had some grade of fibrosis, of which two out of every 10 will be grade F4, equivalent to cirrhosis according to the Meta-analysis of Histological Data in Viral Hepatitis (METAVIR) scoring system.
The current definition of MAFLD considers evidence of fatty liver disease plus obesity and diabetes, as well as, in patients with normal weight, evidence of metabolic dysfunction. Given these considerations, we found ourselves before a population with metabolic abnormalities requiring comprehensive clinical evaluation. Therefore, evaluation by electrical BIS is considered very useful for analysis of body composition, since it is based on the principles of reactance and cell conductance. BIS records the change in voltage of the current applied; conductance delays conduction speed in relation to voltage, resulting in the change in phase that is geometrically measured as the PA. It enables evaluation of nutritional status in individuals and can provide prognostic information in various diseases such as cancer, lung diseases and cirrhosis. In our cohort we found that 13.7% of the population had a history of diabetes mellitus; this prevalence is similar to that seen in the general Mexican population, estimated at 13.4% according to the latest Encuesta Nacional de Salud y Nutrición [Mexican National Health and Nutrition Survey] (ENSANUT). This differed from findings in other cohorts of patients with MAFLD, in which a prevalence of 70%–90% was reported; this was probably due to our method for selecting our population.16
The vast majority of patients with MAFLD have overweight or obesity based on their BMI, and this was clearly reflected in our cohort of patients, in which we saw a mean BMI of 33.2 ± 5.8 kg/m2, corresponding to obesity. Just 3% of the study population with MAFLD was seen to have normal weight; this has been termed fatty liver disease in thin patients and refers to patients with metabolic disease in the context of a normal BMI but increased visceral adiposity and insulin resistance; its frequency is estimated at 5%–45%, depending on the population studied.17 Alarmingly, 75.6% of the patients evaluated had very high levels of fat mass for their BMI evaluated by SECA analysis and just 1.5% had normal fat mass levels. Prior studies have found that, in patients with an elevated BMI, PA values on BIS were elevated in proportion to increases in lean mass and fat mass. This was replicated in our patients with a BMI reflecting overweight or obesity in a significant manner (P = .001). It must be taken into account that in our patients with a normal BMI these results could not be replicated and this should be considered a different population.18 In addition, we found a significant association between PA values and CAP degrees (P = .001), suggesting that these values could be taken as part of follow-up in the management of patients with MAFLD and overweight, especially in patients with S3 and a mean PA greater than 5.23.19
Some studies have reported that BIS tends to overestimate lean mass in patients with obesity, as fatty tissue is presumed to be free from water and lean mass is calculated by subtracting fat mass from total body weight. This happens in patients with obesity as they have larger amounts of free extracellular water, reported as lean mass.20 Evaluation of muscle mass revealed that 6% of the patients evaluated showed scores below the upper limit of normal; however, when compared by stage of fibrosis, no significant differences were found in patients with and without fibrosis. Although PA abnormalities and sarcopenia in patients with cirrhosis have been found to be determinant of prognosis, in our patients we found no significant differences in decreased muscle mass with advanced fibrosis, which could be explained by the way in which we selected our population. Advanced fibrosis was an incidental finding and patients were found to have compensated advanced liver disease, as none of them had presented complications of cirrhosis, nor was ascites detected on ultrasound. Therefore, this decreased muscle mass may have been due to external factors rather than a result of advanced liver disease.21
The normal PA value was determined individually by each patient, according to BMI and age group. Efforts have been made to establish cut-off points according to study population characteristics. Bosy-Westphal et al.22 reported values of 6° to 7° as normal for the healthy population. There are few studies in the Mexican population on normal PA values. Espinosa-Cuevas et al.23 conducted an analysis of BIS in 439 healthy subjects with a BMI >18 and <31 kg/m2 at the Instituto Nacional de Ciencias Médicas y Nutrición Salvador Zubirán [Salvador Zubirán Mexican National Institute of Medical Sciences and Nutrition] that showed a mean PA of 7.3 ± 0.9 in men and 6.4 ± 1.0 in women. In addition, Topete-Reyes et al.24 assessed the relationship between PA and risk of undernutrition in patients with chronic kidney disease and reported that, in a normal nutritional status for this population the PA value was 5.2 ± 1.0, and with a nutritional deficiency the value was 4.4 ± 1.2 (P = .002). A study conducted in a Chinese population reported a PA of 5.53 ± 0.66 in patients with NAFLD and overweight versus a PA of 5.43 ± 0.60 in patients without NAFLD (P = .04).11 In Brazil, Teixeira et al.25 analysed 379 patients with NAFLD who underwent bariatric surgery and reported a mean PA value of 5.89 ± 0.62. Our population with MAFLD showed a mean PA of 5.1 ± 0.69 (in women 4.92 ± 0.62 and in men 5.41 ± 0.70), thus setting precedents for establishing benchmark PA values in this type of patient, as we could see significant variations when we compared these values to those established in the healthy Mexican population. Another recommendation, stemming from the variation seen among the different population types, is to draw on percentiles by age and BMI.
At present, the evidence continues to point to diet and exercise as cornerstones of MAFLD treatment. When a treatment plan is established, equilibrium of body homeostasis should be considered, taking into account the components that we evaluated in our patients, which are clearly altered in all patients with MAFLD. Here, BIS, with analysis of body components and PA, takes on importance in early stages of the disease. Various series reported in patients with NAFLD following bariatric surgery have shown a direct correlation with weight loss, changes in body composition and a decreased PA.26,27
It is important to mention that PA evaluation by BIS is a useful tool in nutritional assessment of patients with MAFLD. However, we must acknowledge that our study had limitations in that it did not measure arm circumference, triceps skin-fold thickness or mid-arm muscle circumference for purposes of complete clinical analysis, nor did it have a control group. Moreover, it was conducted in a cohort of patients with MAFLD from a region of the Mexican state of Veracruz; therefore, the study population could not be considered representative of Mexico as a whole. It should be borne in mind that the gold standard in assessing the presence and severity of fibrosis and fatty liver disease in MAFLD is liver biopsy, which was not performed in our patients, thus limiting the correlation between elastography and histology findings.
ConclusionOur results showed that patients with MAFLD had lower PA values than those previously reported in the healthy Mexican population. Patients without fibrosis and with severe fatty liver disease on CAP showed a mean PA that was elevated in proportion to increases in fat mass and BMI. In addition, in the presence of liver fibrosis, the mean PA value decreased significantly in advanced stages of fibrosis. Therefore, the PA can be considered an alternative clinical marker in patients with MAFLD.
FundingThis study received no specific funding from public, private or non-profit organisations.
Conflicts of interestThe authors declare that they have no conflicts of interest.
