


Analizamos el registro de ocho estaciones autónomas con sismógrafos de banda ancha de la red conjunta entre la Universidad de Utrecht, Instituto Tecnológico de California y Centro de Investigación Científica y de Educación Superior de Ensenada, del sismo Mw. 5.6, que ocurrió el 12 de noviembre de 2003, en la cuenca oceánica Salsipuedes en la parte media del Golfo de California, a 2km al oeste de la isla Ángel de la Guarda. Este evento se localizó en las coordenadas geográficas 29.16ºN y 113.37ºO a 30 kilómetros al noreste de Bahía de los Ángeles, además un precursor y cientos de réplicas se registraron en las 48 horas siguientes de su tiempo origen. Con la localización de 29 sismos identificamos el segmento activo, perpendicular a la principal falla tranformante NW-SE del Canal de Ballenas que representa el límite transtensional entre las placas del Pacífico y Norte América. La dirección de la falla activa descrita es congruente con el mecanismo de falla normal propuesto por el NEIC dependiente del United States Geological Survey, cuyos valores indican un rumbo de 39º, echado de 34º y deslizamiento de -44º.
Con el análisis de la magnitud de duración de 456 réplicas, calculamos un valor de b=1.14±0.28. Además determinamos un momento sísmico de (3.5±3.3)X1017Nm, el radio de la fuente fue de 3.7±2.63km y la caída de esfuerzos estática fue de 3.94±1.15 MPa (39.4±11.5 bar.).
We analyzed records of eight seismic stations of the autonomous broadband seismograph network of a joint project between Utrecht University (the Netherlands), California Institute of Technology, and Centro de Investigación Científica y de Estudios Superiores de Ensenada (CICESE). These stations recorded the Mw 5.6 earthquake that occurred on 12 November 2003 at Salsipuedes basin in the middle of the Gulf of California 2km west of the island Angel de la Guarda. This event was located at 29.16º N and 113.37º W, 30km northeast of Bahia de los Angeles. A foreshock and hundreds of aftershocks were recorded in the 48 hours after its origin time. With the location of 29 earthquakes we identified the active segment, perpendicular to the main transform fault NW–SE of Canal de Ballenas, representing the transtensional boundary between the Pacific and North American plates. The direction of the active fault described is consistent with the normal fault mechanism reported by the National Earthquake Information Center (strike=39º, dip=34º, slip=–44º).
From the duration magnitude of 456 aftershocks, we calculated a b-value of 1.14±0.28; furthermore, we calculated a seismic moment of (3.5±3.3)X1017Nm, a source radius of 3.7±2.63km, and a static stress drop of 3.94±1.15 MPa (39.4±11.5 bar.).
Since the Miocene, the Gulf of California has been continuously affected by a slow rifting with NW-SE displacement between the North American and the Pacific plates. This process generates a high seismicity rate, volcanism, seafloor spreading, thinning of the continental crust and geothermal processes (Lomnitz et al., 1970).
The Centro de Investigación Científica y de Educación Superior de Ensenada (CICESE), in a joint project with Utrecht University (the Netherlands) and the California Institute of Technology (Trampert et al., 2003) deployed 22 broadband digital seismic stations of continuous recording, more than one year prior the occurrence of the studied earthquake, as part of the Network of Autonomously Recording Seismographs, (NARS-Baja) array.
The stations were deployed all along the 1200km of the Baja California peninsula, Sonora, and Sinaloa states around the Gulf of California. The purpose of this network was to study local and regional seismicity and the crust and upper-mantle structure.
In this study, we relocated the 12 November 2003 Mw 5.6 earthquake. We examined the source parameters of the mainshock using the local seismic network. We also estimated source displacement spectra, Mo•(f) and, through the analysis of seismicity we identified the alignment of rupture and estimated the b- value.
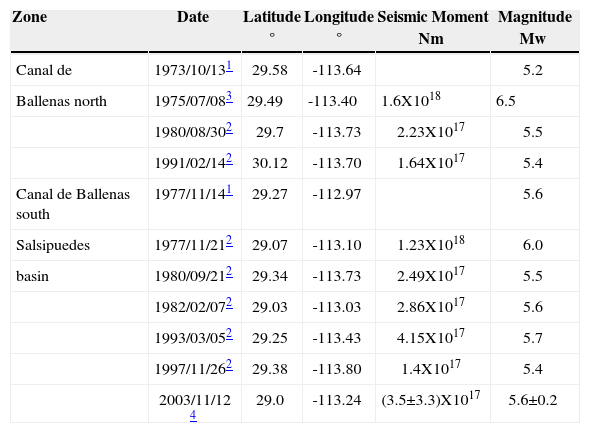
Tectonics and seismicityIn the middle of the Gulf of California the Salsipuedes basin is bounded by the Baja California peninsula to the west and the Angel de la Guarda Island to the east. Frequent earthquake swarms are well documented to occur in the northern end of this zone (Rebollar et al., 2001). Eventhough there is a transform fault connecting the Salsipuedes with Tiburon and Delfin basins (at the southeast and northwest ends, respectively), serious doubts arise to the plate boundary position due to the complexity of the structures interpreted, and by the bathymetric information showing faults at both sides of the island. In addition, Vaquier and Whiteman (1973) in an experiment conducted between 1970-1971 determined 4mm/year of relative displacement between Angel de la Guarda Island and the peninsula of Baja California. Kasser et al. (1987) using laser geodimeter measurements between stations located on elevated points of Baja California and Sonora, estimated a right lateral shear motion direction (N46ºW and 8mm/year) in the Salsipuedes basin. Lonsdale (1989) indicated the existence of grabens and horsts structures at the Gulf of California, nearby to Angel de la Guarda Island with azimuth of 312°, which is the same direction of the transform fault. From 1973 until 2003, the reported seismicity includes few earthquakes of magnitude greater than 5; all of them with right-lateral strike slip fault mechanism (Goff et al., (1987), GCMT catalog, www.globalcmt.org). In Table 1 relevant information of the earthquakes mentioned above is provided. Among them in 1975, an Ms=6.5 earthquake is of particular interest because it was associated with the structure of Salsipuedes basin, as well as its aftershocks (Munguía et al., 1977).
Earthquakes with magnitude greater than 5 that have occurred in the neighbourhood of Salsipuedes basin and Canal de Ballenas.
| Zone | Date | Latitude° | Longitude° | Seismic Moment Nm | Magnitude Mw |
|---|---|---|---|---|---|
| Canal de | 1973/10/131 | 29.58 | -113.64 | 5.2 | |
| Ballenas north | 1975/07/083 | 29.49 | -113.40 | 1.6X10¹⁸ | 6.5 |
| 1980/08/302 | 29.7 | -113.73 | 2.23X10¹⁷ | 5.5 | |
| 1991/02/142 | 30.12 | -113.70 | 1.64X10¹⁷ | 5.4 | |
| Canal de Ballenas south | 1977/11/141 | 29.27 | -112.97 | 5.6 | |
| Salsipuedes | 1977/11/212 | 29.07 | -113.10 | 1.23X10¹⁸ | 6.0 |
| basin | 1980/09/212 | 29.34 | -113.73 | 2.49X10¹⁷ | 5.5 |
| 1982/02/072 | 29.03 | -113.03 | 2.86X10¹⁷ | 5.6 | |
| 1993/03/052 | 29.25 | -113.43 | 4.15X10¹⁷ | 5.7 | |
| 1997/11/262 | 29.38 | -113.80 | 1.4X10¹⁷ | 5.4 | |
| 2003/11/12 4 | 29.0 | -113.24 | (3.5±3.3)X1017 | 5.6±0.2 |
On 12 November 2003, an earthquake occurred in the Salsipuedes basin and was recorded by the NARS-Baja network as well as its associated foreshock, and 456 aftershocks occurred during the following two days.
The NARS-Baja seismic stations, NE74, NE75, NE80, NE81, and NE82, consisted of a Streckeisen STS-2 broadband sensor with a generator constant of 1500 V*s/m and a bandwidth response between corners 0.0083 Hz (120 sec) and 50 Hz, a Global Positioning System (GPS), and a laptop for data acquisition and timing (Trampert et al., 2003). The RESBAN station network consists of a Guralp CMG-40T or CMG-3ESP broadband sensor. All seismic stations recorded continuously with a rate of 20 samples per second (See Figure 1).
 and the 12 November 2003 Mw 5.6 earthquake (white star). The location of the centroid proposed by Global CMT Project and CMT GS are indicated by red circles. Dashed line indicate section AA’ to which the seismicity was projected. The relative motion of tectonic plates is indicated with large arrows.")
Location of broadband seismic stations (filled triangles) and the 12 November 2003 Mw 5.6 earthquake (white star). The location of the centroid proposed by Global CMT Project and CMT GS are indicated by red circles. Dashed line indicate section AA’ to which the seismicity was projected. The relative motion of tectonic plates is indicated with large arrows.
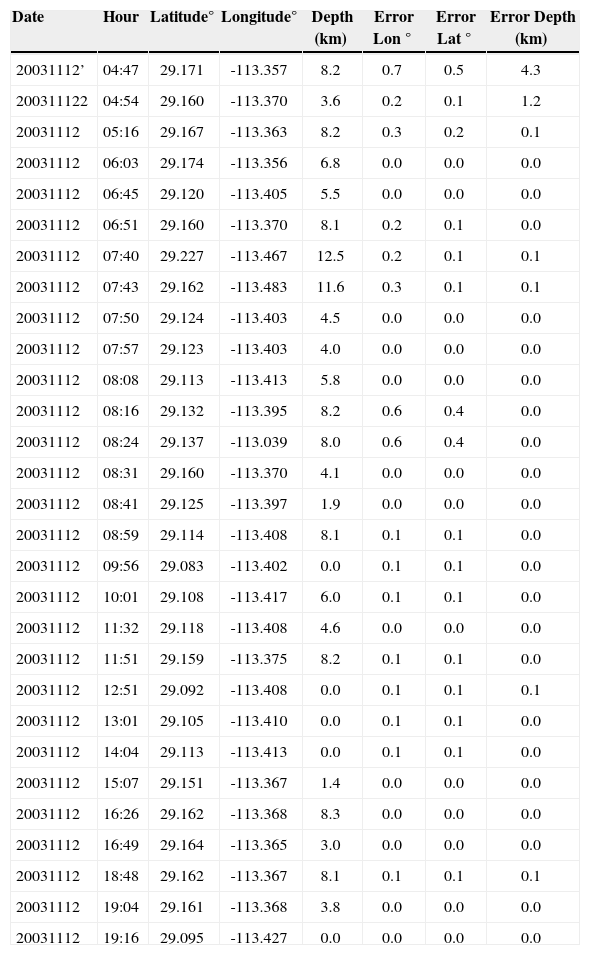
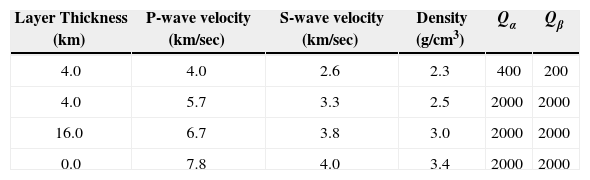
Using the closest stations of the NARS-Baja network (NE74, NE75, NE80, NE81, NE82), and the ones of RESBAN network (BAHB, IAGU, PLIB) to the epicenter, we relocate the mainshock using the HYPOCENTER code (Lienert et al., 1988; Lienert and Havskov, 1995) and a velocity model that includes a thin continental crust with a Moho depth in the range from 20 to 24km. This model was used by Rebollar et al. (2001) and it is displayed in Table 3. The records with the best signal-to-noise ratio correspond to the stations shown in Figure 2. The mainshock was located at 29.16ºN and 113.37°W. This event had a Mw 4.4 foreshock, with epicentral location at 29.17ºN and 113.356ºW. Table 2 and Figure 3 show the location of the mainshock, the foreshock and 27 aftershocks at the rupture area and post-event seismic activity. You can see the rupture area marked by a white star and a set of aftershocks that identify it, also showed the post-event seismicity, and associated with an existing structure in the oceanic floor. Note the perfect partnership between the structures and seismicity.
Location: ‘Foreshock, 2 mainshock, and aftershocks using HYPOCENTER code.
| Date | Hour | Latitude° | Longitude° | Depth (km) | Error Lon° | Error Lat° | Error Depth (km) |
|---|---|---|---|---|---|---|---|
| 20031112’ | 04:47 | 29.171 | -113.357 | 8.2 | 0.7 | 0.5 | 4.3 |
| 200311122 | 04:54 | 29.160 | -113.370 | 3.6 | 0.2 | 0.1 | 1.2 |
| 20031112 | 05:16 | 29.167 | -113.363 | 8.2 | 0.3 | 0.2 | 0.1 |
| 20031112 | 06:03 | 29.174 | -113.356 | 6.8 | 0.0 | 0.0 | 0.0 |
| 20031112 | 06:45 | 29.120 | -113.405 | 5.5 | 0.0 | 0.0 | 0.0 |
| 20031112 | 06:51 | 29.160 | -113.370 | 8.1 | 0.2 | 0.1 | 0.0 |
| 20031112 | 07:40 | 29.227 | -113.467 | 12.5 | 0.2 | 0.1 | 0.1 |
| 20031112 | 07:43 | 29.162 | -113.483 | 11.6 | 0.3 | 0.1 | 0.1 |
| 20031112 | 07:50 | 29.124 | -113.403 | 4.5 | 0.0 | 0.0 | 0.0 |
| 20031112 | 07:57 | 29.123 | -113.403 | 4.0 | 0.0 | 0.0 | 0.0 |
| 20031112 | 08:08 | 29.113 | -113.413 | 5.8 | 0.0 | 0.0 | 0.0 |
| 20031112 | 08:16 | 29.132 | -113.395 | 8.2 | 0.6 | 0.4 | 0.0 |
| 20031112 | 08:24 | 29.137 | -113.039 | 8.0 | 0.6 | 0.4 | 0.0 |
| 20031112 | 08:31 | 29.160 | -113.370 | 4.1 | 0.0 | 0.0 | 0.0 |
| 20031112 | 08:41 | 29.125 | -113.397 | 1.9 | 0.0 | 0.0 | 0.0 |
| 20031112 | 08:59 | 29.114 | -113.408 | 8.1 | 0.1 | 0.1 | 0.0 |
| 20031112 | 09:56 | 29.083 | -113.402 | 0.0 | 0.1 | 0.1 | 0.0 |
| 20031112 | 10:01 | 29.108 | -113.417 | 6.0 | 0.1 | 0.1 | 0.0 |
| 20031112 | 11:32 | 29.118 | -113.408 | 4.6 | 0.0 | 0.0 | 0.0 |
| 20031112 | 11:51 | 29.159 | -113.375 | 8.2 | 0.1 | 0.1 | 0.0 |
| 20031112 | 12:51 | 29.092 | -113.408 | 0.0 | 0.1 | 0.1 | 0.1 |
| 20031112 | 13:01 | 29.105 | -113.410 | 0.0 | 0.1 | 0.1 | 0.0 |
| 20031112 | 14:04 | 29.113 | -113.413 | 0.0 | 0.1 | 0.1 | 0.0 |
| 20031112 | 15:07 | 29.151 | -113.367 | 1.4 | 0.0 | 0.0 | 0.0 |
| 20031112 | 16:26 | 29.162 | -113.368 | 8.3 | 0.0 | 0.0 | 0.0 |
| 20031112 | 16:49 | 29.164 | -113.365 | 3.0 | 0.0 | 0.0 | 0.0 |
| 20031112 | 18:48 | 29.162 | -113.367 | 8.1 | 0.1 | 0.1 | 0.1 |
| 20031112 | 19:04 | 29.161 | -113.368 | 3.8 | 0.0 | 0.0 | 0.0 |
| 20031112 | 19:16 | 29.095 | -113.427 | 0.0 | 0.0 | 0.0 | 0.0 |

Crustal velocity model used to locate the 12 November 2003 earthquake Mw 5.6 and its associated foreshocks and aftershock (Rebollar et al., 2001).
| Layer Thickness (km) | P-wave velocity (km/sec) | S-wave velocity (km/sec) | Density (g/cm3) | Qα | Qβ |
|---|---|---|---|---|---|
| 4.0 | 4.0 | 2.6 | 2.3 | 400 | 200 |
| 4.0 | 5.7 | 3.3 | 2.5 | 2000 | 2000 |
| 16.0 | 6.7 | 3.8 | 3.0 | 2000 | 2000 |
| 0.0 | 7.8 | 4.0 | 3.4 | 2000 | 2000 |
. The diamonds indicate the post-event activity which covers a pre-existing alignment (Observed structures on the ocean floor). White open triangles indicate stations and concentric white circles denote the location of the centroid according to GCMT and CMT GS.")
Seismicity of the study area, the star shows the location of the 12 November 2003 Mw 5.6 earthquake at Salsipuedes basin, the square shows the foreshock. The size of the star indicates the extent of aftershock area (open circles). The diamonds indicate the post-event activity which covers a pre-existing alignment (Observed structures on the ocean floor). White open triangles indicate stations and concentric white circles denote the location of the centroid according to GCMT and CMT GS.
We constructed a vertical section perpendicular to the strike of the fault and plot the position of the mainshock, foreshock and aftershocks with respect to depth; this vertical section is shown in Figure 4. We note that the seismogenic zone reaches a depth of 12km, suggesting a brittle crust of similar thickness.

Vertical section of the recorded seismicity projected along the line AA’ shown in Figure 1. The foreshock and mainshock are indicated by a square and a star respectively.
The statistical Gutenberg-Richter (1942)b-value was estimated for the aftershock sequence in order to identify a seismotectonic pattern of the Salsipuedes basin. The duration magnitude (Md) of 476 aftershocks recorded at seismic station BAHB, was calculated using the equation (1):

where T is the duration of the signal. This relationship has been used by Rebollar and Reichle (1987), López-Pineda and Rebollar (2005).
Duration magnitudes of the located earthquakes range from 2.3 to 3.5. The b-value from the Gutenberg-Richter relationship was calculated and the estimated b-value was 1.14±0.28 using a least-squares approach (Figure 5).

This b-value contrasts with that obtained for Loreto earthquake of 12 March 2003 using 333 aftershocks. López-Pineda and Rebollar (2005) obtained a b-value of 0.68. This difference suggests larger heterogeneous concentration of stresses at Salsipuedes basin than Carmen basin (Scholz, 1968).
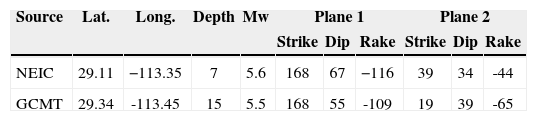
Regarding the moment tensor solution, there are two proposed mechanisms for the earthquake fault of 12 November 2003 Mw 5.55±0.05; these solutions are shown in Table 4. As it is noted in Figure 3, the seismicity location agrees with a trend perpendicular to the main transform NW-SE fault. A strike of 39º is therefore more consistent with the tectonics of the area.
Earthquake location and fault geometry calculated by CMT GS, http://earthquake.usgs.gov earthquakes/eqarchives/sopar/ and Global CMT Project, www.globalcmt.org.
| Source | Lat. | Long. | Depth | Mw | Plane 1 | Plane 2 | ||||
|---|---|---|---|---|---|---|---|---|---|---|
| Strike | Dip | Rake | Strike | Dip | Rake | |||||
| NEIC | 29.11 | −113.35 | 7 | 5.6 | 168 | 67 | −116 | 39 | 34 | -44 |
| GCMT | 29.34 | -113.45 | 15 | 5.5 | 168 | 55 | -109 | 19 | 39 | -65 |
We estimated the average displacement spectra, Mo•(f), of the mainshock from the analysis of the S-wave group recorded at horizontal components of 5 stations within a hypocentral distance of 475km. Following Singh et al. (1999), the Fourier acceleration spectral amplitude of the intense part of the ground motion at a station, under far-field, point-source approximation, may be written as

where

In the equations above, Mo•(f) is the moment rate spectrum so that Mo•(f) → M0 as f → 0, R=hypocentral distance, Rθφ=average radiation pattern (0.55), F=free surface amplification (2.0), P takes into account the partitioning of energy in the two horizontal components (12)β=shear-wave velocity at the source (3.00km/s), r=density in the focal region (2.65kg/m3), and Q(f)=quality factor, which includes both anelastic absorption and scattering. The appropriate geometrical spreading term, G(R), is R–1 for R≤R0 and (RR0)–1/2 for R>R0. The form of G(R) implies dominance of body waves for R≤R0 and of surface waves for R>R0. For this earthquake, we took Q( f )=213f0.72 (Rebollar et al., 1995) and R0=100km. Taking logarithms of equation 2 we obtain

We solved equation (4) in the least-squares sense to obtain log [ f 2 Mo•(f)] and so Mo•(f).
The source displacement spectra of the mainshock for the 5 stations are shown in Figure 6. We interpret these spectra within the framework of a ω2-source model and obtain an estimation of the seismic moment (M0) and corner frequency (Δσ). The stress drop (Δσ) is computed using the Brune (1970) model. The source spectra can be fit by M0, fc and Δσ values indicated in these figures.
 BAHB, B)PLIB, C)NE82, D) NE80, E)NE75 seismic stations. Continuous line is the observed spectrum and dashed line is the theoretical, assuming a w2 source model.")
The Brune model consists in a circular fault plane with finite radius on which a shear stress pulse is applied instantaneously on the whole fault area and there is no fracture propagation. This model is commonly used to obtain fault dimensions from spectra of S waves for earthquakes of small-to-moderate size (M<6), for which the circular fault is a good approximation. Under this hypothesis, the source radius is given by:

The moment magnitude was calculated by Equation (6), proposed by Hanks and Kanamori (1979)

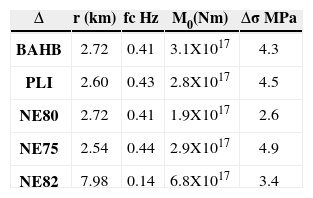
Taking the average value for these parameters, we obtain finally M0=(3.5±3.3)X1017Nm, fc=0.36±0.15 Hz, r=3.7±2.6km and Δσ=3.9±1.15 MPa (39±11.5 bar.).
Discussion and ConclusionsAccording to results of seismic reflection studies conducted in the upper part of the Gulf of California by Lonsdale (1989) and GonzálezFernández et al. (2005), the Salsipuedes basin is in its early stage of development. In this region the basins are aligned in an en echelon trend linking the pull-apart basin by NW-SE transform faults. Canal de Ballenas transform fault connects the Salsipuedes basin at SE with the Delfin basin at the NW. In this zone, six earthquakes with magnitude larger than 5 have occurred during the last thirty years. The focal mechanisms of the great majority of these earthquakes were strike-slip. The earthquake studied here is the first one with a dip-slip mechanism in this part of the Gulf of California, which was located off the west coast of Angel de la Guarda Island. Other earthquakes with normal faulting mechanisms have been reported by Rebollar et al. (1995) at Bahia de las Animas (30km south of the epicenter of study) and Reichle and Reid (1977) following a seismic swarm pattern at Delfin basin, (60km northwest of the epicenter of study). Castro et al. (2011) associates this type of faulting in the Gulf of California to spreading centers.
The distribution of earthquakes with magnitude larger than 5 during the last thirty years suggests a seismic activity migration from north to south.
Calculated source parameters. r is the source radii, M0 is the seismic moment calculated from the displacement spectra, Δσ is the static stress drop calculated with the displacement spectra.
| Δ | r (km) | fc Hz | M0(Nm) | Δσ MPa |
|---|---|---|---|---|
| BAHB | 2.72 | 0.41 | 3.1X10¹⁷ | 4.3 |
| PLI | 2.60 | 0.43 | 2.8X10¹⁷ | 4.5 |
| NE80 | 2.72 | 0.41 | 1.9X10¹⁷ | 2.6 |
| NE75 | 2.54 | 0.44 | 2.9X10¹⁷ | 4.9 |
| NE82 | 7.98 | 0.14 | 6.8X10¹⁷ | 3.4 |
Considering that the elastic energy stored in rocks in the form of deformation stress is released when the rocks reach their rupture, part of the energy propagates as vibrational energy producing seismic waves and another part of the energy remains in the rock as residual energy, this energy is transmitted to other parts of the same stress axis increasing the stress level of the adjacent regions (Husseini et al., 1975). So the seismic energy released by fracturing and sliding at the northern edge of the Canal de Ballenas transform fault, triggered off significant seismicity at the southern edge of the transform. Examples of these sequences are: (i) the 1973-1975-1977 earthquakes, (ii) the 1980-1982 earthquakes, and (iii) the 1997-2003 earthquakes. All of these shocks were presumably seismically associated (see their latitudes shown in Table 1).
The earthquake studied here represents an example of active extensional faults at north of Gulf of California. Eventhough Sumy et al. (2013) propose that much of the extension across the plate boundary is accommodated aseismically, this activity shows that, at least in this zone, normal faulting plays an important role.
A Mw 4.4 foreshock occurred seven minutes before the 12 November 2003 Mw 5.6 earthquake. Both events were located on a dip slip fault perpendicular to the main Canal de Ballenas transform fault according their locations indicated on Figure 3.
The b value represent properties of the seismic medium in some respect, like stress or material conditions in the focal region Scholz (1968) and we expect an inverse correlation between the b value and the level of stresses accumulated in the seismic region. Others like Mogi (1962) have associated high b-values with the material heterogeneity. Through a comparative analysis of b-values estimations at north of Gulf of California between 1.5 (Reichle and Reid, 1977; Rebollar and Reichle, 1987), 0.68 for Loreto’s earthquake of 12 March 2003 at Carmen basin (López-Pineda and Rebollar, 2005) and the b value of 1.14±0.28 for this Salsipuedes basin earthquake at the middle of Gulf of California, we can infer that there is a transition of stress distribution from north, where the stresses are more heterogeneous, to south where concentration of stresses are more homogeneous, as well as in the central region of the Gulf of California.
From spectral analysis and assuming a Brune model of circular fault, we obtain the following source parameters:
M0=(3.5±3.3)X1017Nm
Corner frequency fc=0.36±0.15 Hz
r=3.7±2.6km
Δσ=3.9±1.15 MPa (39±11.5 bar.)
In agreement with the magnitude of 5.6 previously reported by NEIC; the calculated static stress drop is typical of this tectonic region ranging between 2 and 49 bars (López-Pineda and Rebollar, 2005) and the rupture radius is consistent with the magnitude of a moderate earthquake.
The greatest thanks to Dr. Cecilio Javier Rebollar Bustamante, deceased on September 2006, who was director of doctoral theses of two of the authors (LLP. and HERL); this work is part of LLP’s thesis. For health reasons and a long process of struggle against cancer Dr Rebollar could not publish it. Moreover we thank Arturo Perez Vertti and Arie van Wettum for the field work that they performed during the deployment of the seismic stations. We also thank Juan A. Mendoza and Omar Lugo Castillo for help in handling the digital data. Finally we wish to thank Dr. Xyoli Pérez-Campos her suggestions for improving the manuscript of this paper. The Consejo Nacional de Ciencia y Tecnología (CONACYT) sponsored partially this Project (Proyecto 37038-T). L.L.P was supported by Programa al Mejoramiento de Profesores (Promep).