


La presa Cerro Prieto, relativamente una pequeña reserva de agua en el noreste de México, es uno de los principales recursos de agua potable para Monterrey, ciudad con una población cerca de cuatro millones de habitantes. Se llevó a cabo un estudio de sísmica de alta resolución en esta reserva de agua con un equipo SES-2000 que utiliza un efecto acústico paramétrico no lineal. La interpretación de los datos de acústica de alta resolución muestra que el espesor de los sedimentos recientes alcanza 3.5-4.0m debido a la sedimentación del embalse. Esto demuestra una alta velocidad de sedimentación reciente (de 1-2 hasta 14cm por año). Con base a los resultados de este estudio, se ha preparado un mapa batimétrico y un modelo de espesores de sedimentos. Se reveló una diferencia significativa (5-12%) entre el valor de la capacidad de volumen calculado por la Comisión Nacional del Agua (CNA) y los resultados acústicos. La diferencia entre dichos datos indica pérdidas de almacenamiento de 12-17 hasta 30millones de metros cúbicos. Los resultados obtenidos de un estudio como éste, son útiles para mejorar un sistema de gestión de los recursos hídricos.
The Cerro Prieto dam, a relatively small water reservoir in NE Mexico, is one of the main resources of potable water for Monterrey, a city with a population of about fourmillion inhabitants. A high resolution seismic study using non-linear parametric sub-bottom echo-sounder SES-2000 was carried out in this water reservoir. High resolution acoustic data interpretation shows that the thickness of recent sediments due to siltation of the reservoir reaches 3.5-4.0m. It shows a high recent sedimentation rate (1-2 up to 14cm/ year). Based on the echo-sounder data, the first bathymetric map and a digital model of recent sediment thickness were designed. A significant (5-12%) difference between the volume capacity value used by National Commission of Water (CNA) and acoustic survey results was revealed. Differences between the CNA and acoustic data indicate storage losses from 12-17 up to 30million cubic meters. The results obtained through study such as this one, could be useful to improve a water resources management.
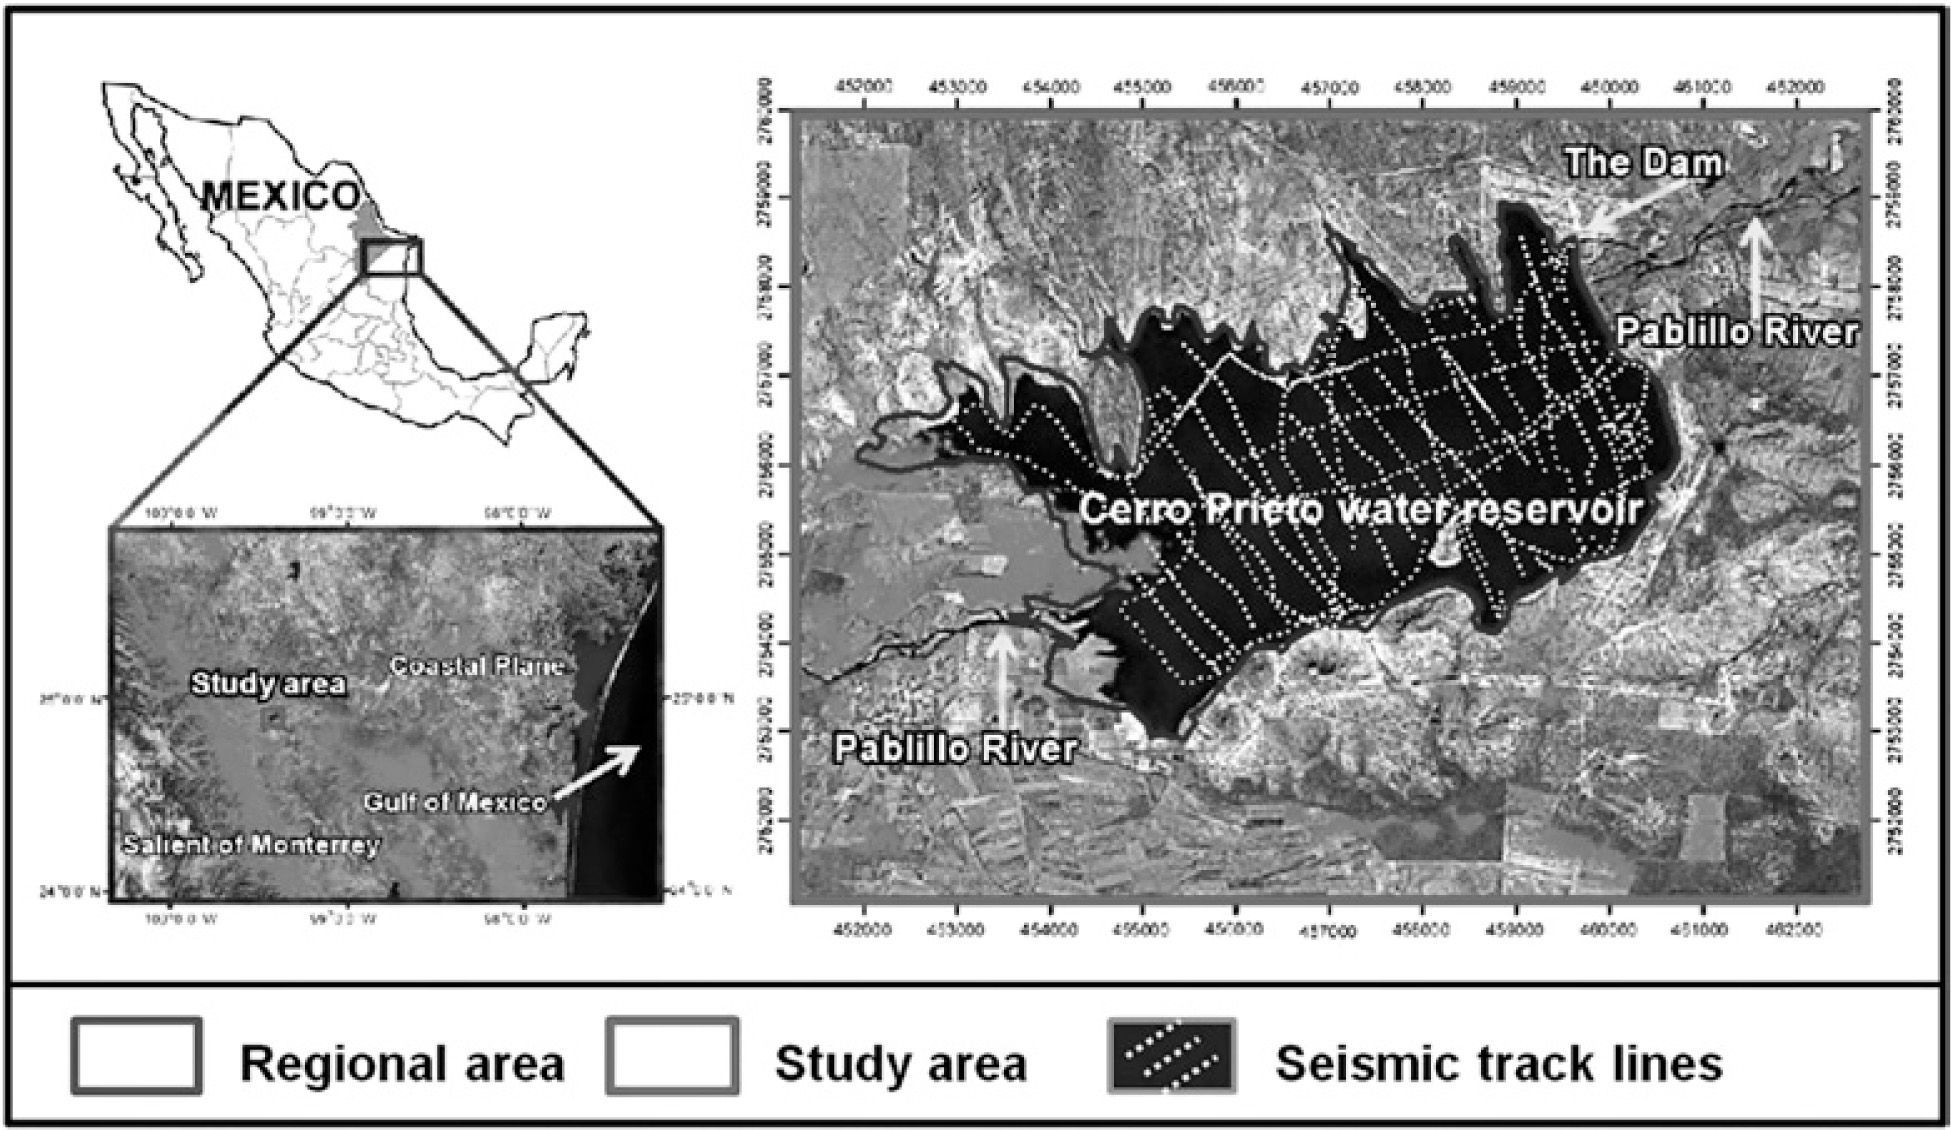
The role of bathymetry and recent sedimentation in water reservoir management is very important (Bowen, 1982), especially in the case of semi-arid countries (Annandale, 1987; Martínez et al., 2010; Schleiss, 2008). Dueto its physiography, the State of Nuevo León in North-East Mexico is characterized by semi-arid climate, undeveloped drainage, mostly low precipitation, and high evapotranspiration rates, as well as rapid demographic growth. Due to these characteristics, domestic water supply shortages have been occurring since 1979, making this a major problem for the state government. Monterrey, the most important industrialized city in the state with a population of about fourmillion inhabitants (INEGI, 2009), faces a serious water supply scarcity (Navár, 2001; Navár, 2004). At present, ground water sources (Campo de Pozos de Mina, Sistema Santa Catarina, Sistema Santiago I, and Campo de Pozos Monterrey) and superficial waters (La Boca, Cerro Prieto and El Cuchillo dams) form the main water supply. The overall water supply demand for Monterrey city is calculated as a daily amount of 370 liters per capita, with an additional 17m3/s required for domestic, industrial and city usage. Yet the actual supply is about 11m3/s, i.e. city demand is short of about 6m3/s (De LeónGómez, 1993; De León-Gómez et al., 2004; De León-Gómez et al., 2006).
The Cerro Prieto dam was built in a two years period (1980-1982) by the Secretaria de Agricultura y Recursos Hidráulicos (SARH) now known as National Commission of Water (Comision Nacional del Agua, CNA). The dam is located 130km southeast of Monterrey and 20km northeast of Linares. Cerro Prieto dam belongs to the regional system of water supply known as Linares-Monterrey. The storage capacity of the dam was calculated as almost 400millionm3 (De León-Gómez, 1993). The main objectives for the construction of this dam were to supply 4.1m3/s of water for city of Monterrey, to irrigate 673 hectares, and to control peak discharge during hurricane seasons. The hydrological basin has an area of 1708km2 and is influenced by the southeastern part of the Monterrey Salient (Sierra Madre Oriental) and the northeastern part by the “Planicie Costera del Golfo Norte” (Coastal Plane, see Figure 1). The main sources are the Pablillo and Camacho rivers.
 and the position of the acoustic lines.")
Concerns exist about the future of many Mexican reservoirs which are prone to soil erosion and subsequent siltation produce losses in storage capacity. Additionally, the number of studies of these problems is poor. Lake Cerro Prieto shares this problem with most impoundments in Nuevo León State.
The first step of the integral geological study of the Cerro Prieto water reservoir was geophysical prospecting including gravity, magnetic, electrical and shallow (onshore) seismic methods (Izaguirre Valdez, 2008; Yutsis et al., 2009). It was oriented to recognition of sedimentary and upper basement structures of the Cerro Prieto area. As a follow-up to the earlier study, new research has been focused on the question whether recent sediments of artificial basins are significant and whether the volume of recent sediments affects the reservoir volume? If so, what are the consequences for water supply?
The objective of this study is to conduct a detailed bathymetric and geo-acoustic survey of the artificial reservoir in order to: (1) obtain an accurate map of Lake Bathymetry (depth) and reservoir volume values, and (2) study the distribution, thickness and volume of recent sediments in the reservoir.
Various ways could be used for this purpose. They are time-lapse bathymetry survey or some traditional tools like coring (Helsel and Hirsch, 2002; Anderson, 1986; Jones, 1999) and/or geophysical studies (Bièvre, 2005; Kirsh, 2006; Mainali, 2007; Rubin et al., 2006; Sharma, 2002). The present study applies a geo-acoustic tool (a non-linear parametric sub-bottom echo-sounder) combined with typical techniques of geophysical survey. It is shown that high resolution seismic profiling is useful to quantify sedimentation rates and reservoir storage loss effectively. Especially it should be useful for initial studies of reservoirs where no previous bathymetry or bottom topography maps exist.
Data collectionSedimentation of artificial reservoirs tends to be low. For example, a sedimentation rate of 1-2cm/year causes a total accumulation of about 20-40cm for 20 years of the reservoir operation. In order to be effective, new techniques for the estimation of sedimentation (such as acoustic equipment) should be able to provide a high vertical resolution.
Non-linear parametric acoustics equipmentIn this study, we used the SES-2000 parametric (non-linear) dual frequency echo-sounder. The instrument simultaneously transmits two signals of slightly different high frequencies; their interaction creates a new low frequency signal. It has a large bandwidth and a short signal length, which allows good use in very shallow water and results a high (~15 - 20cm) vertical resolution (Missiaen et al., 2008) at acceptable sub-bottom penetration up to 10m or more. Some favorable near sub-bottom seismic and geological conditions permit to achieve a vertical resolution up to 10cm.
Parametric (non-linear) sound generation allows designing acoustical systems with small transducer dimensions and narrow sound beams at low frequencies. An Innomar SES-2000 parametric transducer has an active area of 20 by 20cm and provides a beam width of less than four degrees (at 3dB), valid for all adjustable low frequencies between 5kHz and 15 kHz (Wunderlich and Müller, 2003). The transmit directivity of the parametric sound beam does not show any significant side lobe characteristic, which reduces ambiguities during the interpretation of individual reflectors. Short transmit signals of single sinusoidal cycles without any ringing and high ping rates of up to 50 pings per second are further advantages. They contribute to a high spatial resolution of this acoustical system and permit to apply it in a shallow basin.
Innomar’s software tool ISE provides near real-time processing of the collected SES data. The operation procedure can be tuned on-line. A value of the sound velocity in water is used to convert sound travel time to the depth. The depth values are screened online.
Some advantage of the SES-2000 parametric (non-linear) dual frequency echo-sounder is the survey of small water reservoirs, which often requires the collection of sub-bottom data from small boats in water depths of down to one meter and to resolve thin layers of recent sedimentation due to damming. Furthermore, the determination of near surface structures, e.g. shallow fault zones, is of interest at the same time and can be achieved with the application of such a mobile parametric profiler system (Wunderlich and Wendt, 2001; Vasudavan et al., 2007; Wunderlich, 2007).
Data acquisition methodologyThe aquatic survey of the Cerro Prieto water reservoir was conducted on-board of a small motor boat (5m). The SES-2000 transducer was mounted on the front side of the boat 0.75m down from the water level using a light metal pipe, and all electronic equipment was installed on the deck. Accurate positioning of the boat was reached using Global Positioning System (GPS). Average speed was 8-10km/h.
A total of 32 acoustic profiles have been acquired. The track map is shown at the Figure 1. Line separation is about 300m. Twenty six profiles were made at near right angles to the axis of the basin. Five lines were oriented along the river Pablillo valley and finally one profile was made circular, skirting the shoreline. Some lines have been repeated to provide the quality control. Difference in depth measurement for different data sets does not exceed±2-5cm.
A sound velocity profile in the lake was not taken. Acoustic depth measurements were calibrated by direct depth measurements (at some points) at different parts of the lake.
Results and discussionAs it is mentioned above the water depth and sediment layer thickness are calculated from sound pulse travel times. The water sound velocity mean value of 1450m/s was used (Kinsler et al., 1991). Velocity uncertainty is evaluated of 0.5-1%. Calibration of acoustic bottom depth for some points allows us to obtain the depth accuracy±10-20cm. This is limited mainly by weather conditions. The same velocity value was used for sub-bottom sediments. It is supposed velocity uncertainty of 3-4%. For mean value of sediment thickness 50cm the velocity uncertainty of 4% corresponds to±2cm of thickness uncertainty. Uncertainties of sediment velocity of 3-4% for 3-4m sediment layer thickness could cause±12-15cm variations.
Integral model based on CNA data of water balance and lake surface area allows evaluating storage loss due to uncertainties of water sound velocity (maximum±8x10⁶m3 for 4% and±2x10⁶m3 for 1 %). For this study estimated sound velocity uncertainty is about 0.5%, which corresponds to maximum volume loss±(1-1.5)x106m3. The value±5cm of sediment thickness uncertainty corresponds to±(0.6-1.4)x106m3 of uncertainty of sediment volume.
Acoustical reflectors on the depth sections have been picked and digitized. Digital data sets of the bottom depth and the depth of the base of recent sediments (the acoustic basement depth) were used to generate the bathymetric model, the model of sediment thickness and to calculate water storage volume.
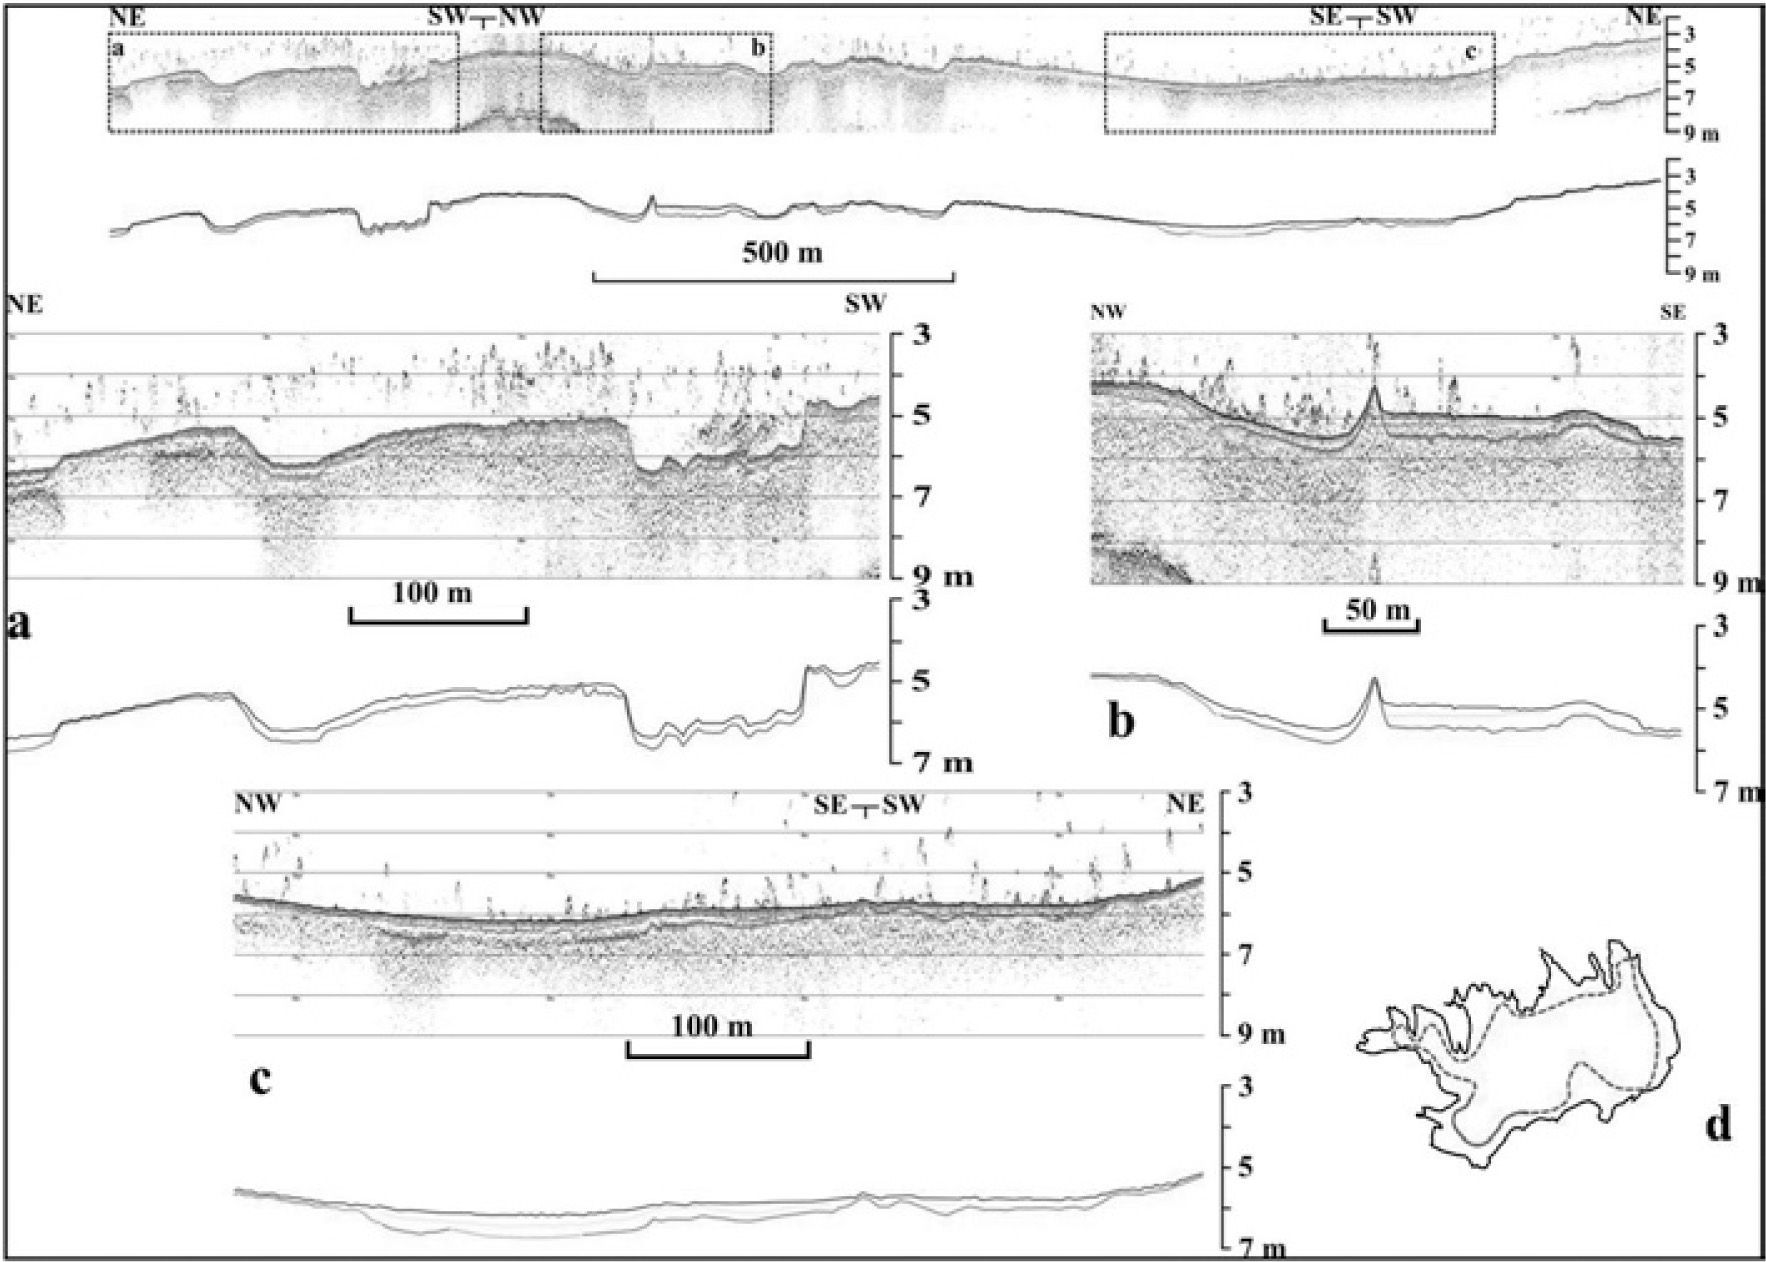
Bathymetry and bottom morphologyAcoustical sections provide detailed information of bottom morphology and sub-bottom sediments. Figure 2 and Figure 3 show typical echo-plot samples. Figure 2 shows a fragment of the circular profile, which is located in the western part of the lake. This is a relatively shallow part of the water reservoir. The depth of the bottom is not more than 4-6meters. In general, the bottom is relatively smooth (Figure 2c), but in places the detailed topography is somewhat complex and irregular (Figures 2a, 2b).
 data. Fragment of the circular profile at the western shallow part of the Cerro Prieto water reservoir: (a) irregular (erosional) bottom relief and recent sediments thickness from zero to 25-30cm; (b) sharp peak of the relief; (c) smooth topography and recent sediments thickness up to 0.75cm; (d) the fragment (solid) and complete circular line (dashed).")
Example of dual frequency echo-sounder (acoustic) data. Fragment of the circular profile at the western shallow part of the Cerro Prieto water reservoir: (a) irregular (erosional) bottom relief and recent sediments thickness from zero to 25-30cm; (b) sharp peak of the relief; (c) smooth topography and recent sediments thickness up to 0.75cm; (d) the fragment (solid) and complete circular line (dashed).
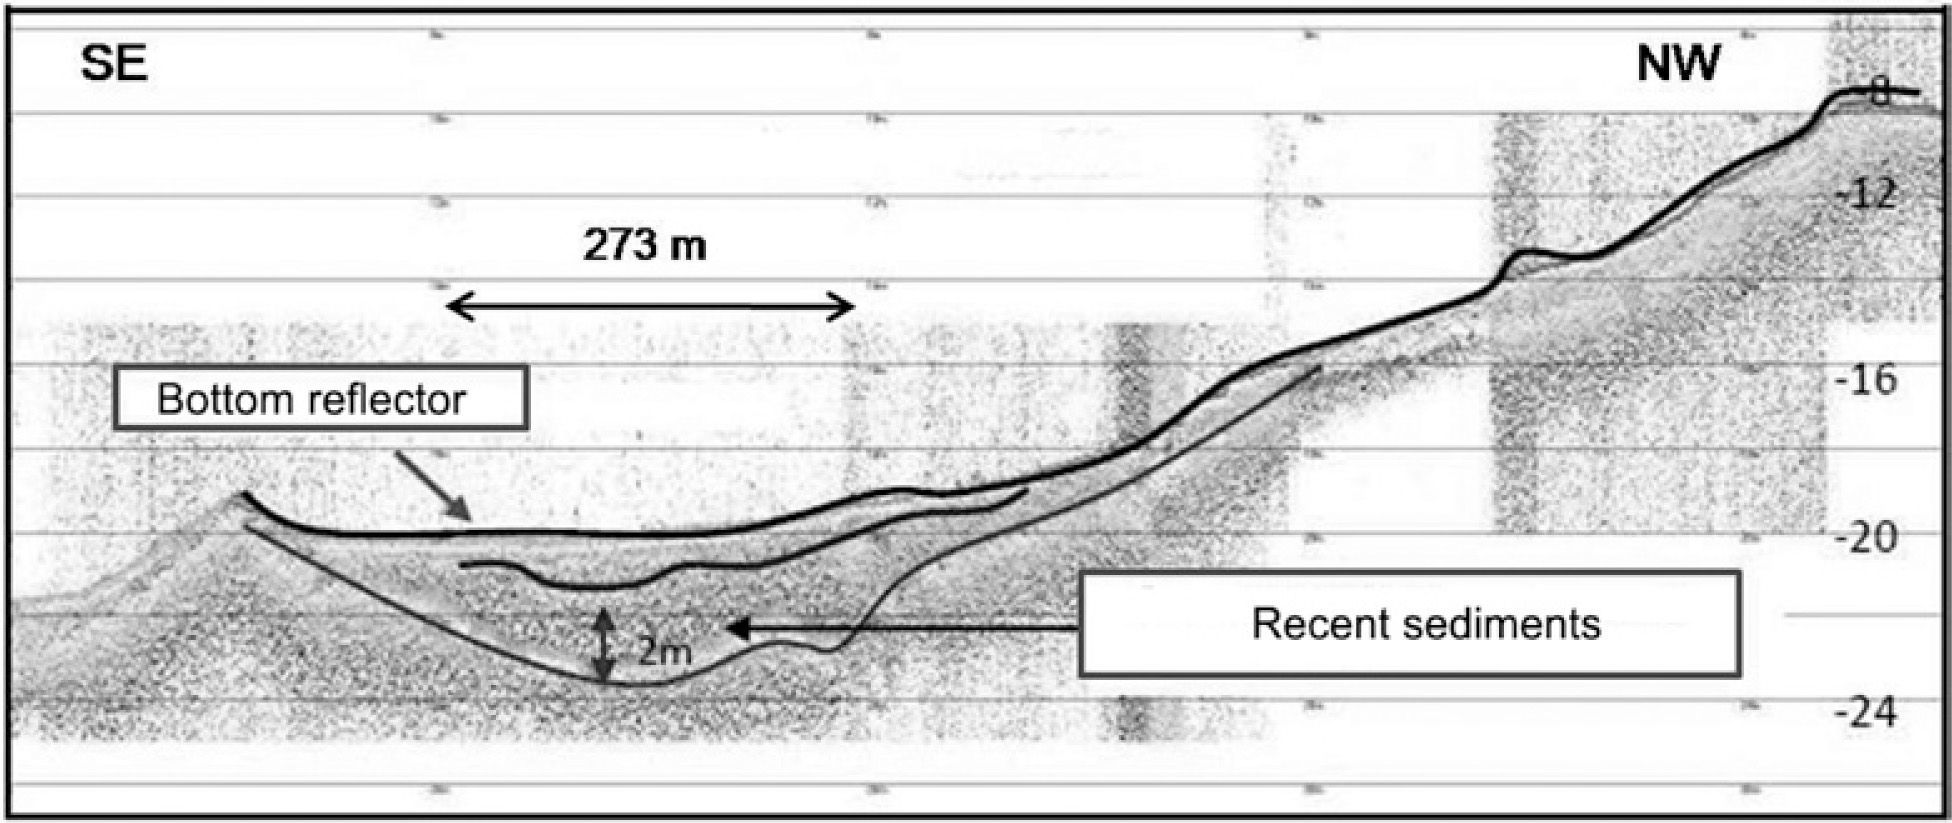
 irregular bottom topography and variation of sediment thickness; (b) small depression (trough) in the central part of the line; (c) smooth bottom topography and layered sediments of 1.5meters thickness; and (d) smooth bottom and wavy sub-bottom topography. LF – Lake Floor; B – acoustic basement; (e) position of the acoustic line.")
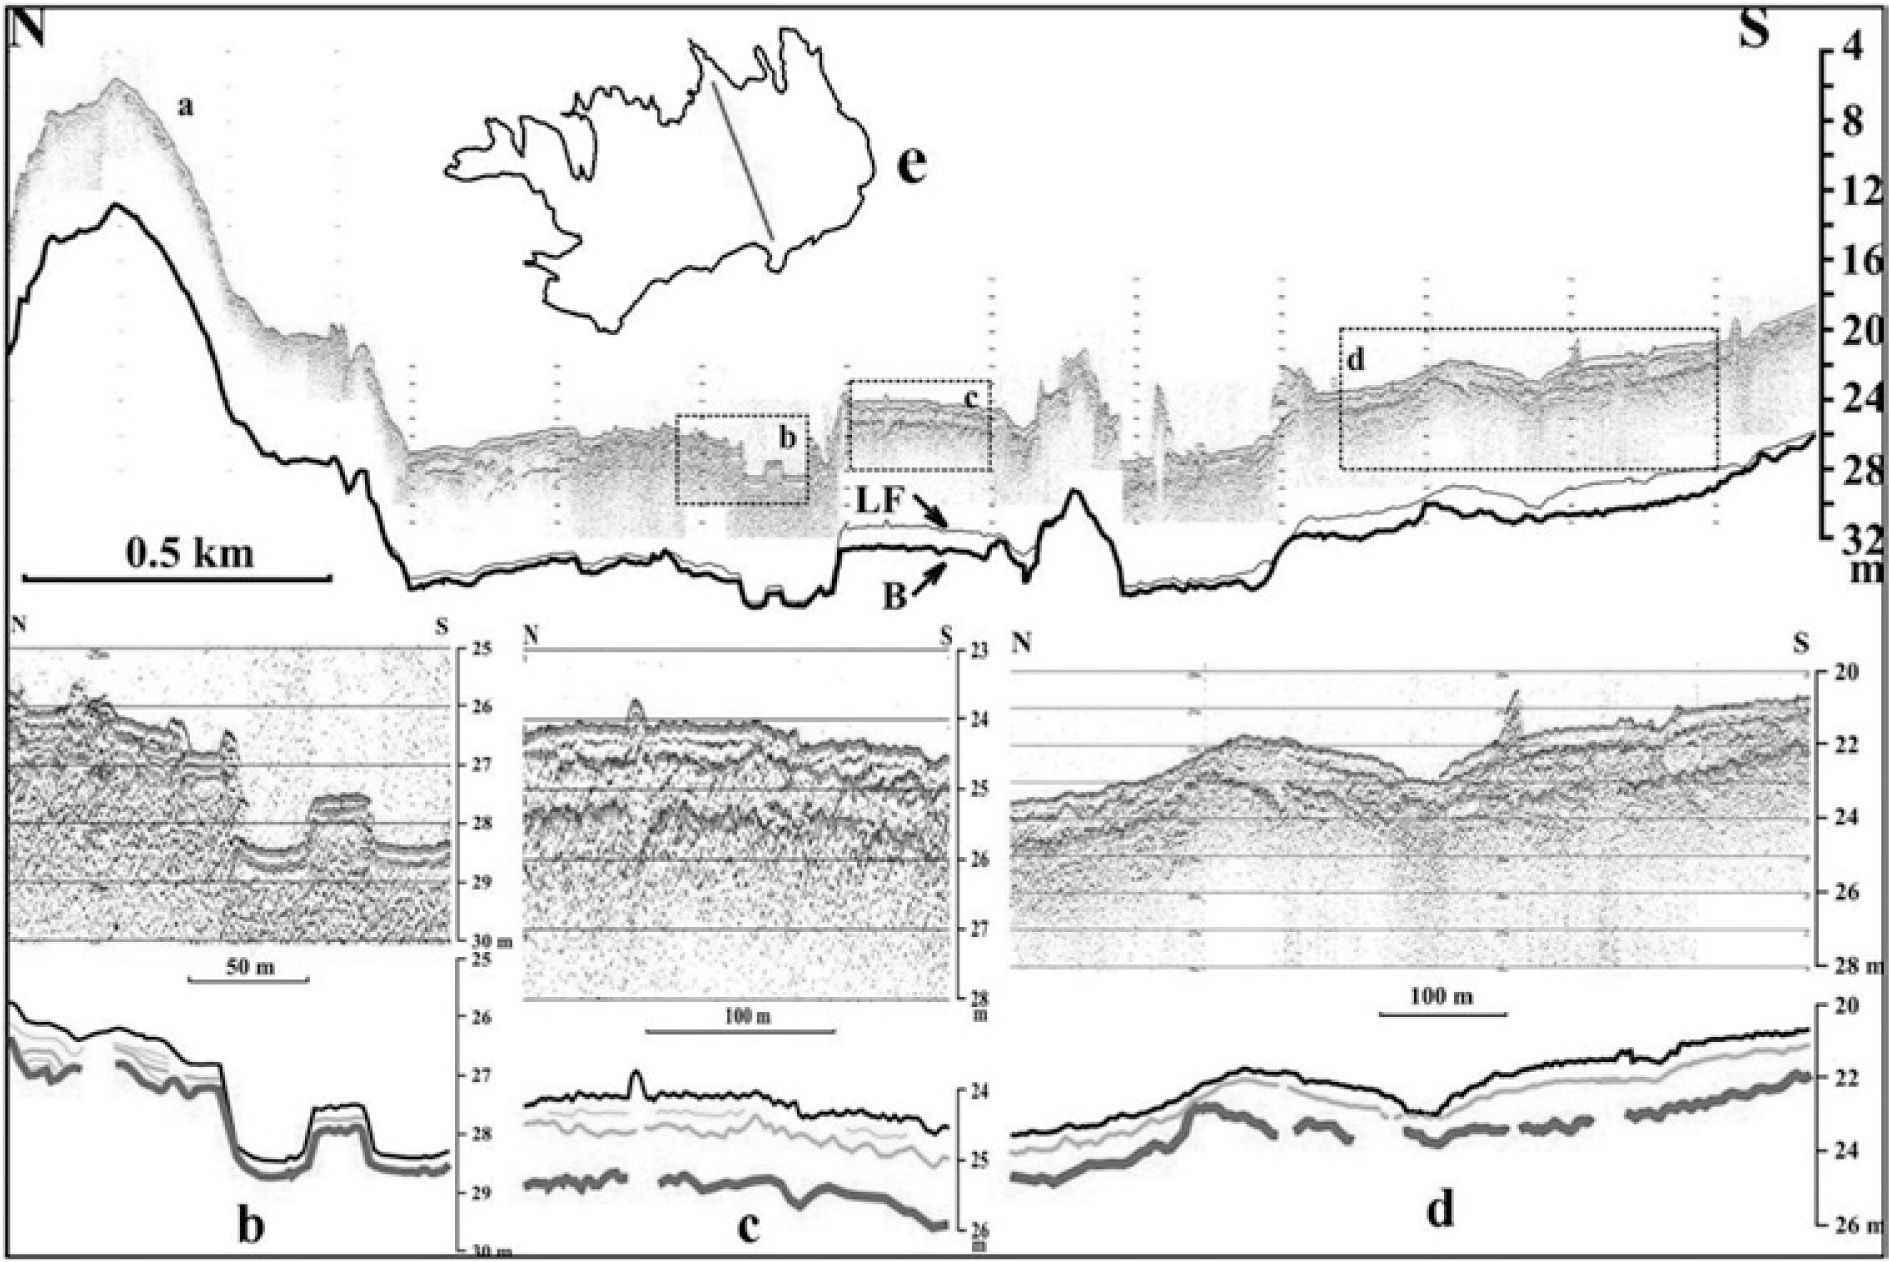
Example of the acoustic profile situated in the eastern deep area of the Cerro Prieto water reservoir: (a) irregular bottom topography and variation of sediment thickness; (b) small depression (trough) in the central part of the line; (c) smooth bottom topography and layered sediments of 1.5meters thickness; and (d) smooth bottom and wavy sub-bottom topography. LF – Lake Floor; B – acoustic basement; (e) position of the acoustic line.
Figure 3 shows an acoustic line, which is situated in the eastern deep part of the Cerro Prieto Lake crossing the ancient river Pablillo valley in NW-SE direction. The water depth here is calculated as 18-24m (Figure 3a). In this area the bottom is mainly smooth. A small trough extending in WSW-ENE direction is shown at Figure 3b. The trough bottom depth is more than 28m, and width ranges 40-60m (Figure 3b).
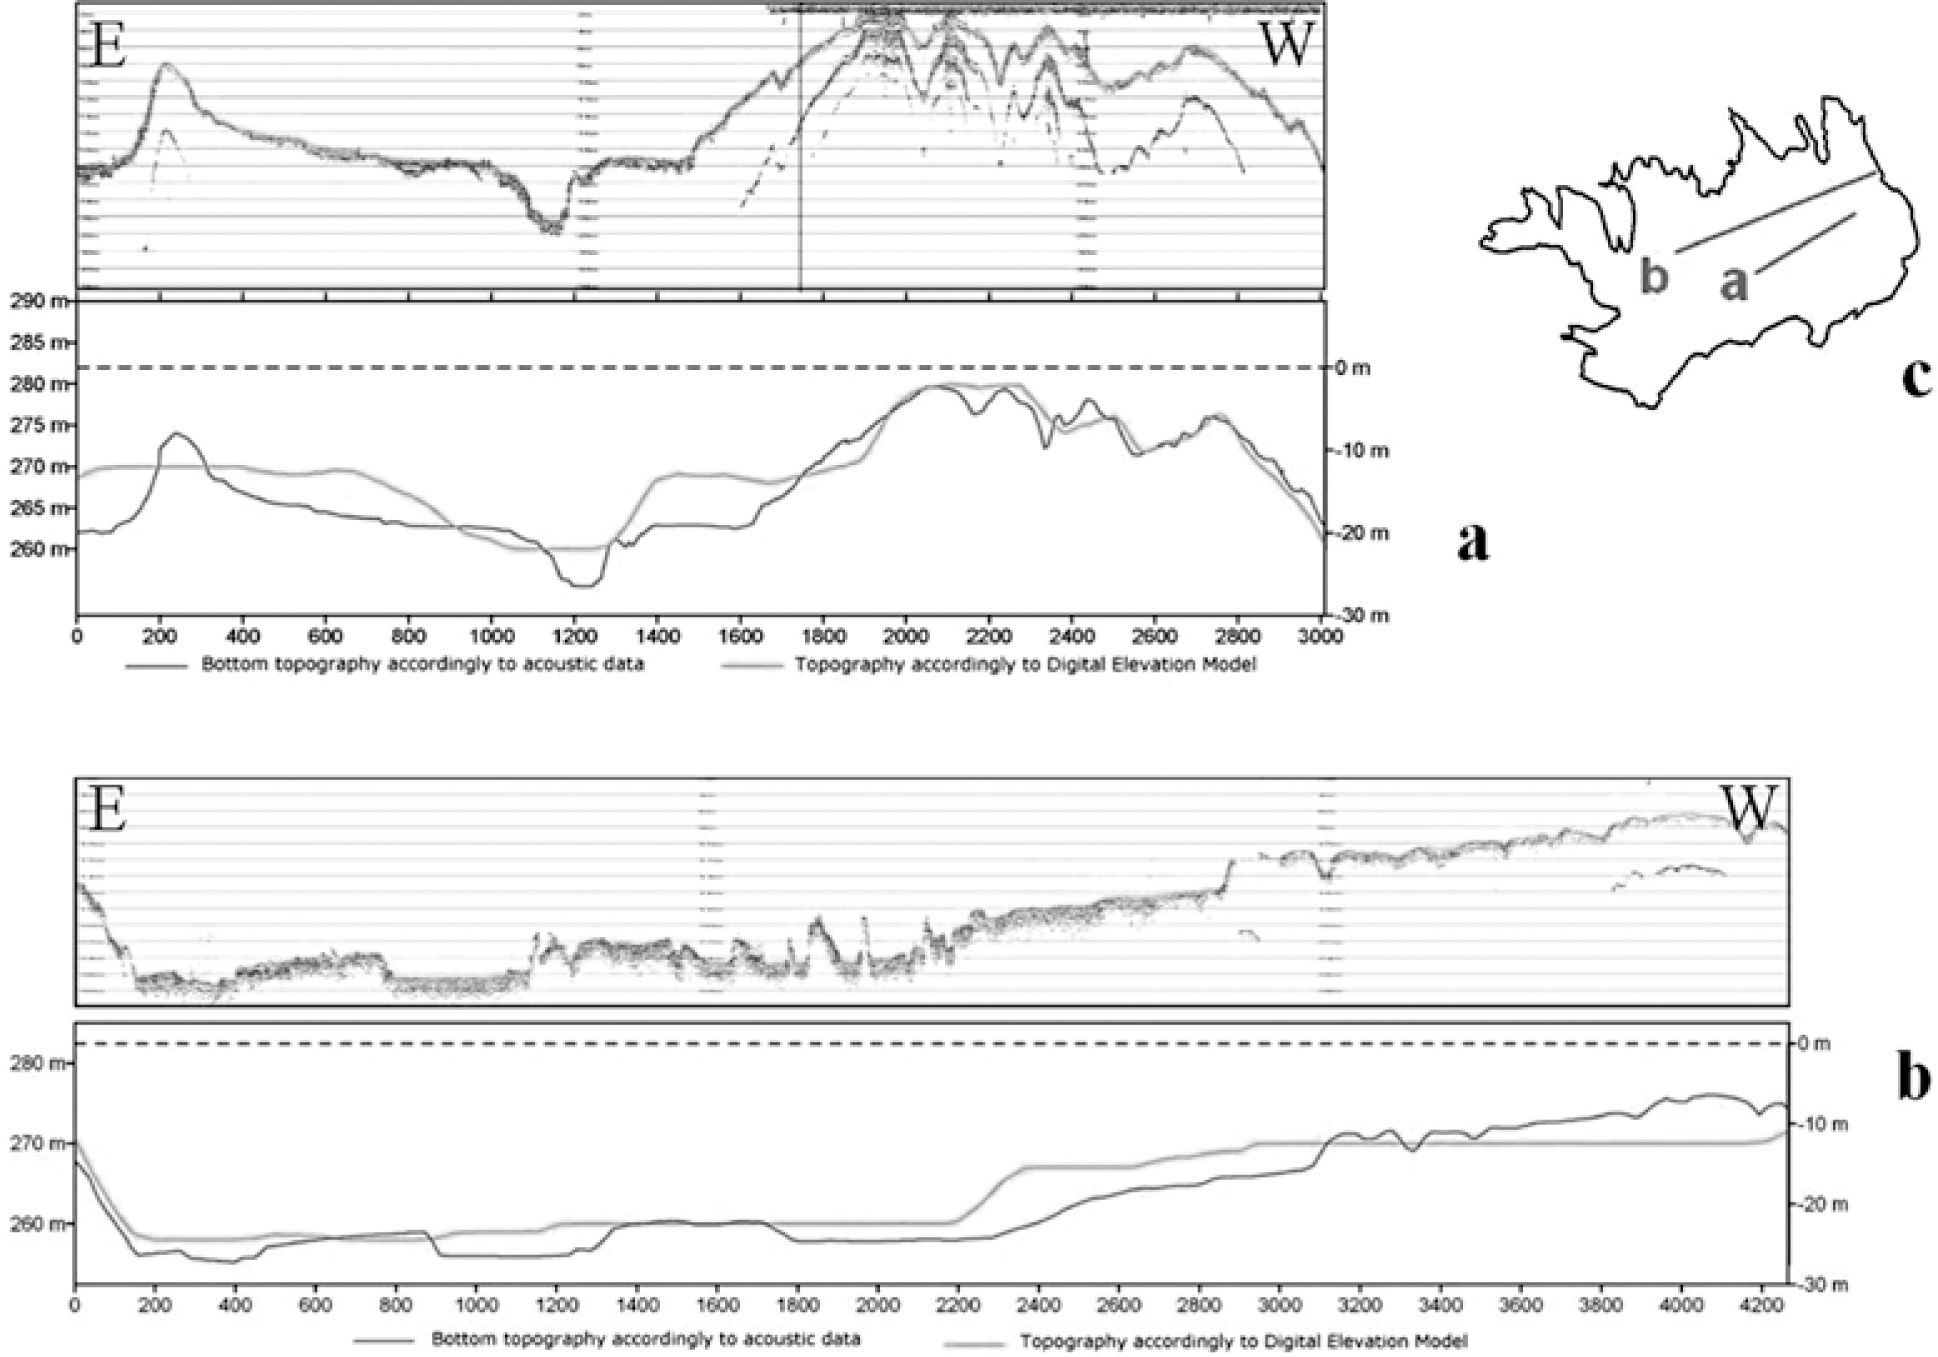
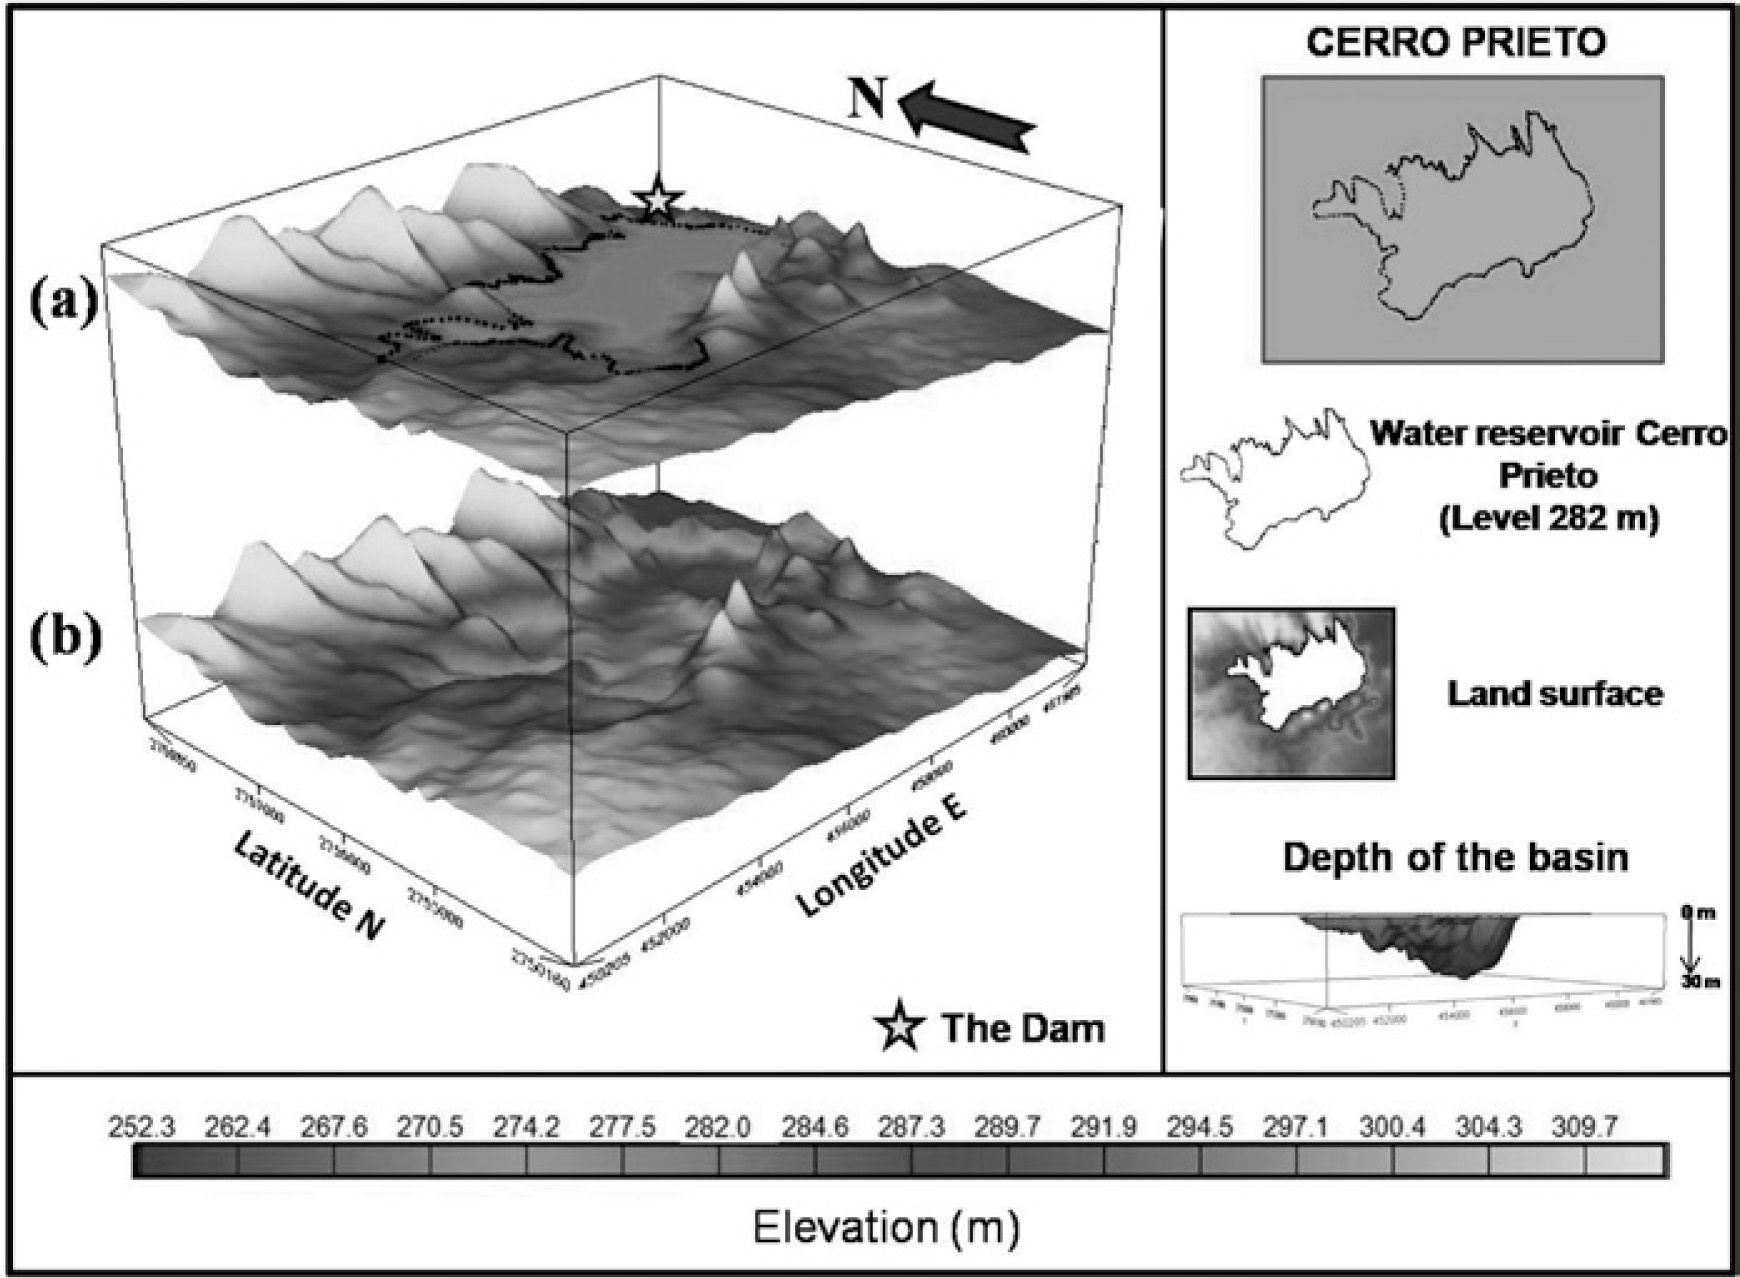
It is observed significant difference (up to 5-7m) between acoustical depths and a previous topographic map. It is supposed that the original topography (land surface) has been changed and the river Pablillo valley has been deepened during construction of the dam (De León, 1993, Figure 4). The previous topographic map by Instituto Nacional de Estadística y Geografía (INEGI) (INEGI, 1980) demonstrates the smoothed topography features of the area. They are the undulating surface of the river Pablillo valley at the elevation between 252-310m (Figure 6). The bathymetric survey with the SES-2000 parametric echo-sounder has resulted in a modification of some important aspects of this map and, also, in the construction of the first bathymetric map of the Cerro Prieto water reservoir (Figure 7).
. The difference reaches 5-7m.; (c) position of the acoustic lines. Horizontal scale is shown in meters (m).")
.")
. Seismic track lines are shown at the Figure 1.")
Bathymetric map of the Cerro Prieto water reservoir (water level at the dam is 282m above sea level). Seismic track lines are shown at the Figure 1.
The irregular bottom topography of the reservoir is revealed. Taking into account that the water surface was at the altitude of 282m above sea level during acoustic study, the depth of the reservoir ranges from 0.0-1.0 to 28m (figures 6, 7). Figure 7 shows the general topography of the Cerro Prieto Lake bottom based on survey results in combination (co-kriging) with the Digital Elevation Model (The Consortium for Spatial Information, 1980).
It is possible to recognize two different areas in the lake basin. The western shallow-water area is largely occupied by a flat bottom (depth 0.5-10m), except for a bottom elevation trending in the northeastern direction. The elevation has a relative height of about 2-3m from the bottom of the lake. The western area is divided into NE and SW regions. To the southeast of the elevation, a smooth floor tends to be gently inclined from its peripheral parts towards the east. The North of the western area is characterized by relatively low relief (up to -12 -13m) and tends to be deeper toward southeast (Figure 7).
A chain of islands is located in the central part of the water reservoir. The large island called the Cerro Prieto Island, and rises up to 25-30m above the surrounding bottom floor near the south coast (figures 7). Another one situated to the west-northwest and has a single pointed peak. An area of four small islands occurs to the north of the Cerro Prieto Island, topographic high which divides the water reservoir into western and eastern areas.
The eastern deep-water area is situated to the northeast of the Cerro Prieto Island (Figure 7). It is characterized by irregular topography. The bottom depth is generally more than 15-20m and attains a maximum depth of approximately 28-30m (Figure 7). So the deepest part of this area occupies the easternmost region which is situated near the dam and artificial dykes. At the southeastern part of the lake the basin bottom lies at a depth of between 22-24m, interrupted by small bottom hills in some places.
Recent sedimentationRecent sediments of the Cerro Prieto water reservoir have been deposited on the floor of river Pablillo valley for about 28 years. In case of recent non-consolidated sediments (case of Cerro Prieto dam) we have some kind of pulp, or suspension of fine particles (silt, mud), and it is supposed that usually the silt has a velocity the same (or slightly less) as the water.
The interpretation of the SES profile at the western shallow-water area (Figure 2) shows two reflectors. We identify a strong sub-bottom reflector distributed almost throughout the whole lake as the most likely base of recent sediments. We also identify a few hypothetical bright seismic sub-bottom facies, which we attribute to recent “lake” sediments, quaternary river “pre-lake” sediments (alluvium), and cretaceous bed rocks. The uniform thinness of the upper acoustic unit for the whole basin is more relevant for new “lake” sediments than for alluvium. The quaternary river sediment thickness demonstrates essential variability around the water reservoir. In the western part of the lake the thickness of this layer is usually less than 1meter. Most of the profiles here show a sediment thickness of 30-50cm or, even, an absence of sediments. At the eastern deep part of the Cerro Prieto Lake thickness of recent sediments is 1.0–1.5m (Figures 3c, 3d). The maximum thickness values are from 3.5 up to 4.0m (figures 5, 8). It may be partly caused by a sub-water slumping process or redistribution of sediments (Figure 5). And it means the maximum sedimentation rate could be over 14cm/year.

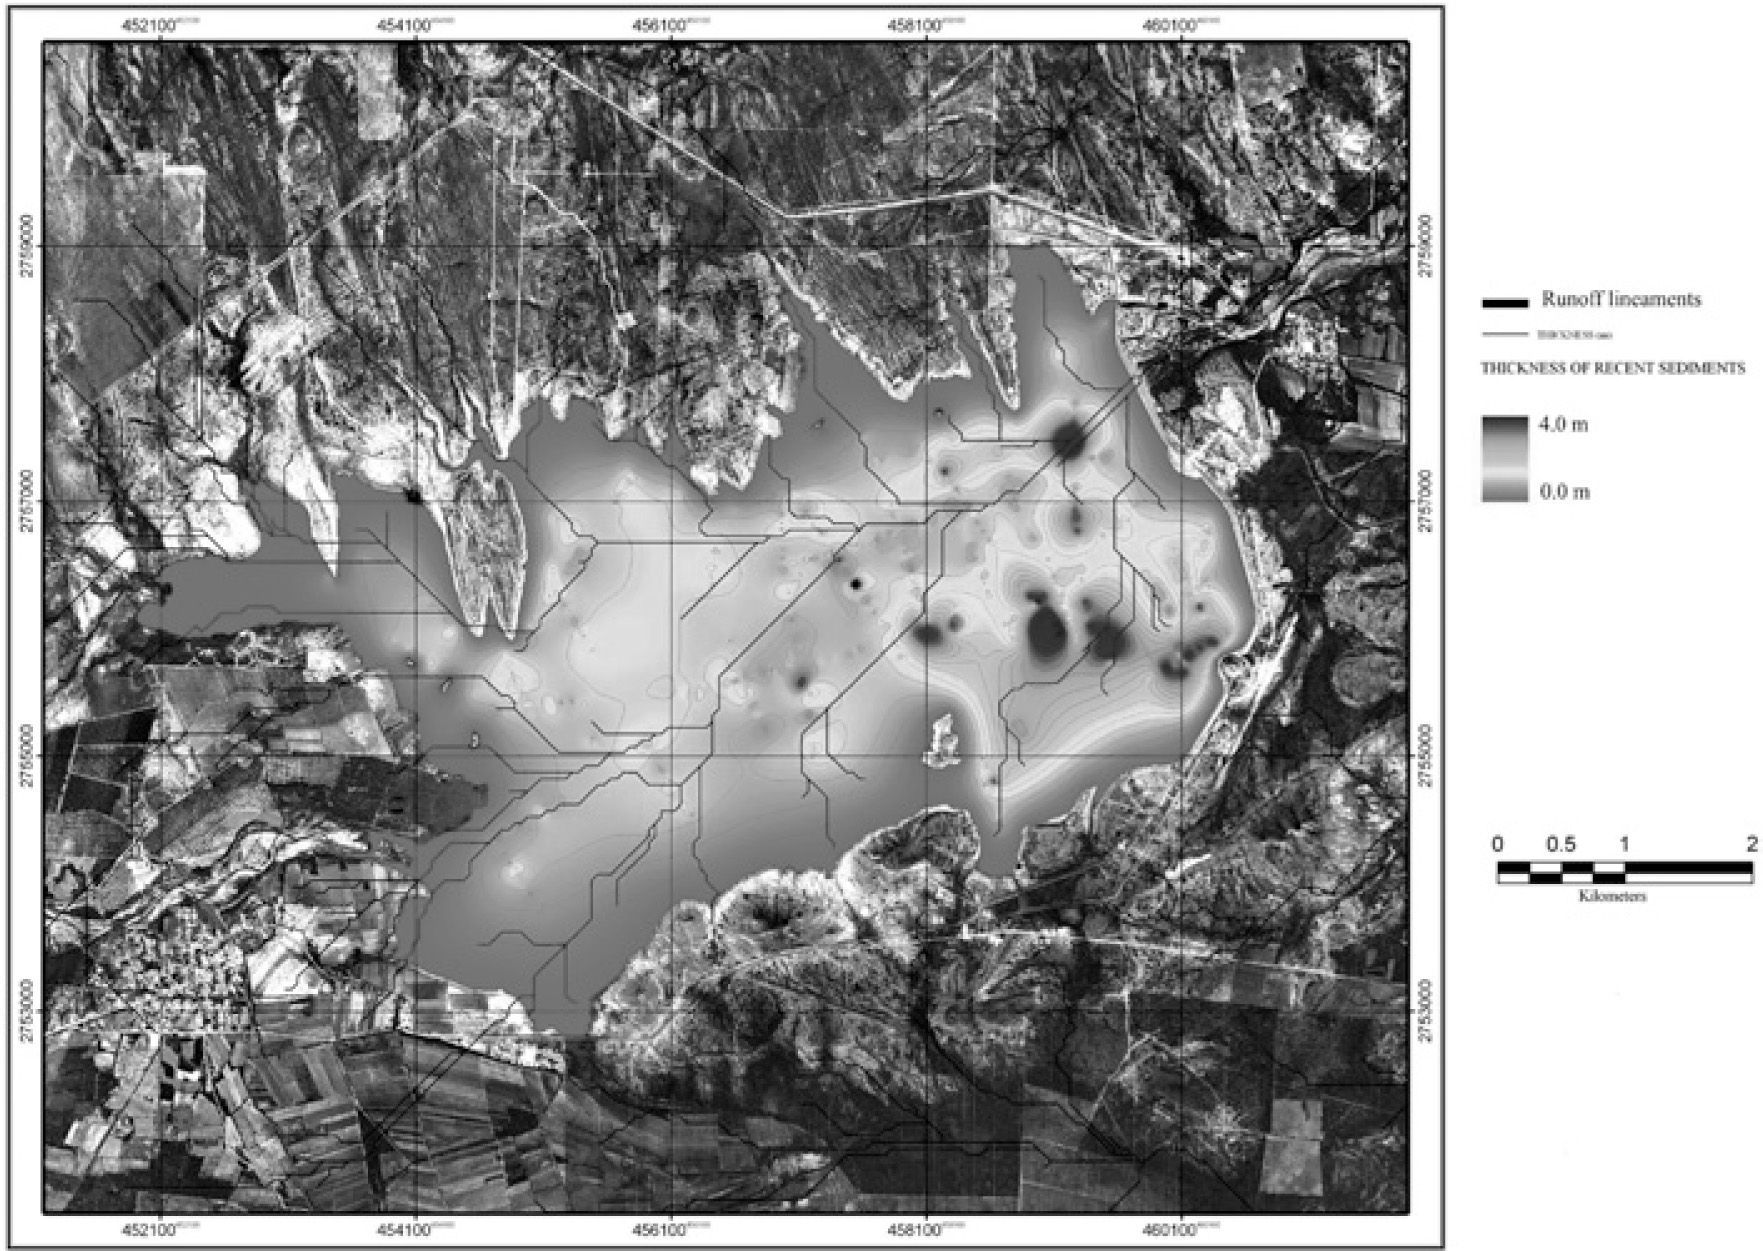
Recent sediment thicknesses obtained from the interpretation of non-linear acoustic have been mapped (Figure 8). Sediment thickness within the lake basin varies from zero to over 3.5m. There are five centers of sediment accumulation localized in the eastern deep area. The greatest thicknesses occur in narrow bottom valleys (troughs) in the central and eastern parts of the lake (figures 7, 8).

The sediments in the basin are generally confined to the southeastern part of the lake. The western area is relatively shallow and the sediments are thin (0-0.5m). It means that average rate of the siltation is up to 1-2cm/year.
The river Pablillo is the main source of water and sediments for the basin. So, it seems ra- ther strange that the western part of the lake near river mouth does not show a large amount of sediments. We hypothesize that sediments are mainly fine grained (silt), deposited slowly and distributed by water currents uniformly through the basin.
The total volume of this accumulated material estimated by the acoustic data is approximately 8.8±0.5million cubic meters. It is possible to suppose that some recent sedimentary layers (bodies) are not reflected on the acoustic records. This means that the volume of the acoustically visible sediments could be less than the real (total) volume of sediments.
Water storageAnalysis of the storage volume was conducted using three data sets: the Digital Elevation Model of Cerro Prieto and surrounding area (The Consortium for Spatial Information, 1980), a register of the water balance of Cerro Prieto dam, and new data of the high resolution acoustic survey.
According to CNA reports the maximum water storage of the Cerro Prieto water reservoir is 393million of cubic meters, which corresponds to a water level of 285meters above sea level (a.s.l.) (see Table 1, volume CNA). However, this level was reached only three times after the dam’s construction. Hurricanes Gilbert (1988), Keith (2000), and Emily (2005) contributed to reach the full capacity storage of the dam.
Water volume (storage capacity) and area of the water reservoir according to echo-sounding data (SES), Digital Elevation Model (DEM) and National Commission of Water (CNA).
| H, m | Volume DEM, x106m3 | Area DEM, km2 | Volume CNA, x106m3 | Area CNA, km2 | Volume SES, x106m3 | Area SES, km2 |
|---|---|---|---|---|---|---|
| 285 | 278.743 | 26.95 | 393.000 | - | 360.000* | - |
| 284 | 252.249 | 26.06 | 344.375 | 31.60 | 320.000* | - |
| 283 | 226.664 | 25.16 | 313.529 | 29.50 | 292.000* | - |
| 282 | 202.033 | 24.15 | 285.789 | 27.50 | 268.348 | 21.15 |
| 281 | 178.503 | 22.99 | 259.474 | 25.67 | 244.858 | 21.15 |
| 280 | 156.396 | 21.24 | 233.500 | 23.93 | 221.379 | 21.15 |
| 279 | 139.065 | 16.61 | 210.000 | 22.20 | 198.022 | 21.09 |
| 278 | 123.513 | 15.01 | 188.800 | 20.67 | 175.143 | 20.74 |
| 277 | 109.240 | 13.88 | 169.231 | 19.23 | 153.311 | 19.53 |
| 276 | 96.197 | 12.68 | 150.714 | 17.76 | 133.619 | 17.52 |
| 275 | 83.875 | 12.01 | 133.833 | 16.42 | 116.045 | 15.84 |
| 274 | 72.181 | 11.39 | 117.857 | 14.97 | 100.748 | 13.66 |
| 273 | 61.115 | 10.77 | 103.571 | 13.67 | 87.367 | 12.30 |
| 272 | 50.647 | 10.18 | 92.571 | 12.73 | 75.316 | 11.20 |
Table 1 shows summary data of the water storage of the lake and the surface area of the reservoir for different water levels, calculated according to the Digital Elevation Model (DEM) and SES echo-sounding data. The procedure comprises a standard hydrological modeling (implemented in Arc/Info) that is a cell-based modeling of water depth and storage volumes (Stout et al., 1985). In both procedures the Digital Elevation Model for Linares and surrounding areas from INEGI (Instituto Nacional de Estadística, Geografía, e Informática) was used. Grid node spacing was 30x30m.
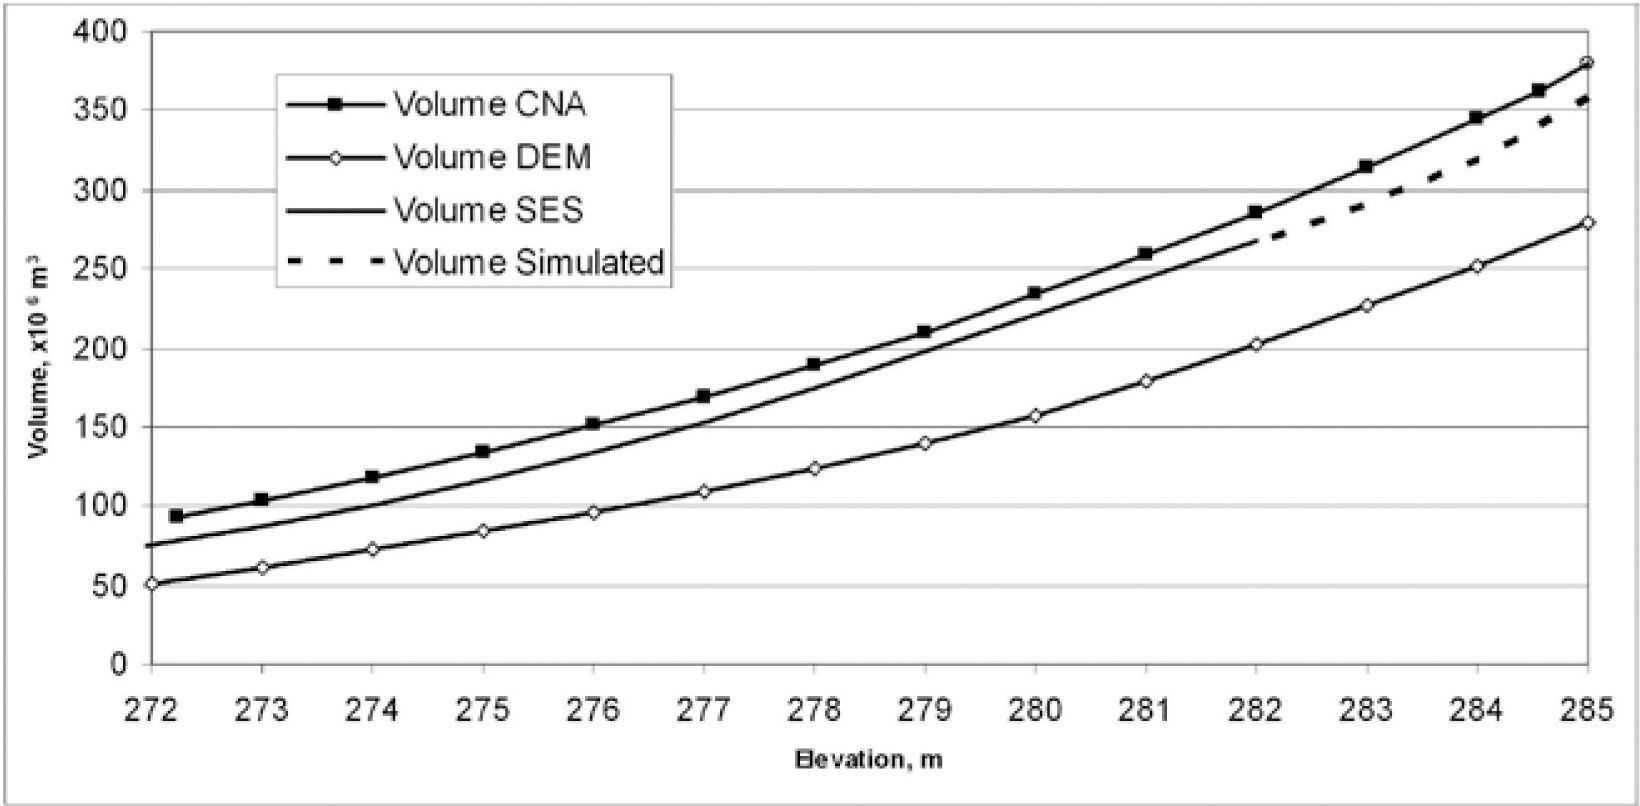
The volume capacity values (Figure 9) derived from the analysis of the bathymetric map (Figure 7) indicate a predicted total storage capacity of 360millionm3 (Table 1), whereas the storage capacity generated from DEM shows only 279millionm3. This discrepancy could be explained by the fact that the Digital Elevation Model was developed in the early 80-ies before the dam construction and excavations of the basin material as reported by De León (1993) (Figure 4).
, Digital Elevation Model (DEM) and National Commission of Water (CNA).")
The volume of water, mentioned in the report of CNA, is approximately (12-17)±2millionm3 larger than the amount calculated from the SES data for operation levels 280-275meters respectively (Table 1). This can be explained by recent sedimentation.
There is a difference between the loss in storage capacity and calculated sediment volume (8.8±2million cubic meters). It is possible supposed that calculated sediments could be underestimated. Nevertheless, the observed difference in calculated sediment volume (8.8millionm3) and loss in observed storage capacity (12-17millionm3) changes the average sedimentation rate a little (from 1.5 up to 2cm/year).
The trend line of water volume (simulation) shows that sediment accumulation between 1982 and 2009 in the Cerro Prieto Lake could result a loss up to 30millionm3 of storage capacity (Table 1, Figure 9) for maximum operation level (285m a.s.l.). And 17millionm3 for low operational level (275m) is more critical. It corresponds to storage loss 19% of total volume or 11-12 days water supply (fourmillion inhabitantsx370 l/day).
ConclusionsThis study discusses the advantage of geophysical data to evaluate the current state of water reservoir (distribution of recent sediments and real storage capacity).
Analysis of the non-linear echo-sounding data provides the volume of the reservoir at different levels of water table and the volume of sediments as well as distribution of the sediments through the basin.
A high rate of recent sedimentation (1-2 up to 14cm/year) at the artificial water reservoir is revealed. Interpretation of the SES echo-sounding data shows that the thickness of sediments due to siltation of the reservoir reaches 2.5-4.0m. The total volume of this accumulated material estimated by the acoustic data is evaluated about 9million cubic meters.
The volume of water, calculated from the acoustic data for common operating levels is approximately 12-17million cubic meters smaller than the values of operational management data. This is about 5-12 % of total storage capacity. A significant reduction in the size and volume of the reservoir is obvious. This factor could have been taken into account in the calculations of the volume of water for this reservoir.
The authors would like to thank Universidad Autónoma de Nuevo León (UANL), Mexico, for funding support of the project PAICYT CT-1705-07 and Innomar Technologie GmbH, Germany, who kindly provided the SES-2000 compact equipment. We are indebted to Pedro Garza of National Commission of Water (Rio Bravo Division, Monterrey) for providing access to water balance data. Authors thank Dirk Masuch Oesterreich (UANL) for his assessment of GIS calculations. We also would like to thank Dr. John M. Sharp, Jr. (The University of Texas at Austin), Dr. Vadim Galkine (Canada) and Dr. Wouter Buytaert (Imperial College, Great Britain) for their constructive comments and suggestions, which helped to improve this paper. Comments and suggestions from two anonymous reviewers and the editor are greatly appreciated.